ISSN: 2372-4811 (Print), 2372-482X (Online) Copyright © The Author(s). 2014. All Rights Reserved. Published by American Research Institute for Policy Development
Dopant Effect and Characterization of Poly (O-Toluidine)/Vanadium
Pentoxide Composites Prepared by in Situ Polymerization Process
Shama Islam1, Mohsin Ganaie1, Shabir Ahmad1, Azher M. Siddiqui1 and M. Zulfequar2
Abstract
Conducting polymer composites of poly o-toluidine/vanadium pentoxide (POT/V2O5) were synthesized by polymerization of o-toluidine with V2O5 using (NH4)2 S2O8) as an oxidant. The V2O5 is varied in five different weight percentages of POT in POT/V2O5 composites. The synthesized polymer composites are characterized by dc conductivity; UV–Visible absorption spectroscopy, FTIR, Phototluminescence and XRD techniques. Electrical conductivity of the compressed pellets depends on the concentration of V2O5 in POT. The optical band gap of composites decreases with increase in the weight percent of V2O5. X-ray diffraction pattern shows increases in the crystallinity which is due to interaction of POT with V2O5. The PL emission intensity of all the polymer/V2O5 composites makes them suitable for various optoelectronic devices. Keywords: Optical properties/techniques, Chemical properties, Defects, Electrical properties, Powder processing
1. Introduction
Conducting polymers have emerged as a very important class of materials because of their unique electrical, optical and chemical properties leading to the wide range of technological applications.
This class of materials provides tremendous scope for tuning of their electrical conductivity from semiconducting to metallic regime by way of doping [1, 2].
1 Department of Physics, Jamia Millia Islamia, New Delhi-110025, India.
The unique properties of conducting polymers have led to the development of new models to explain their observed properties, particularly various mechanisms of charge transport [3, 4]. Among all conducting polymers, polyaniline is one of the most promising conducting polymers; but this is inherently brittle and has poor processibility, due to the insolubility in common organic solvents [5-7]. This problem has been overcome to some extent by using substituted derivatives of anilines such as o-toluidines, anisidines, N-methyl or N-ethyl anilines etc. [8-10]. In order to obtain additional insight into polyaniline, a methyl substituent has been used to block the
ortho position of aromatic ring of aniline. It may be remarked that methyl-substituted
aniline called o-toluidines has been found to have additional advantage over polyaniline due to its fast switching time between the oxidized and reduced states. POT was chosen as the conducting polymer owing to its higher processibility as well as solubility as compared with PANI [11].
The composite materials based on electrically conductive polymers have attracted the attention of investigators for the development of new functional materials [12-15]. The reason for such interest is that materials of this type frequently manifest properties that cannot be achieved by the individual components. These compounds have great potential for their use in chemical current sources, photo- catalytic and electro- catalytic systems and as dopant additions for enhancement of quantum yield in these devices.
However, when they are taken in the composite form their electrical as well as dielectric properties are altered from those of basic materials. A number of groups have reported studies on the electrical conductivity and dielectric properties of composites of a variety of conducting polymers [16, 17]. It has been shown that the conductivity of these heterogeneous systems depends on many factors such as the concentration of conducting fillers, their shape, size, orientation and interfacial interaction between filler molecules and host matrix. In case of conducting polymers as fillers, the degree of cross-linking between the polymeric chains also affects the electrical properties in these composites [18-19].
V2O5 exhibits photovoltaic action, where light is converted directly into electricity and photoconductive action where electrical resistance decreases with increased illumination. It is a Lewis acid, which makes it a suitable candidate for the doping of conducting polymers. Moreover, V2O5 is stable and has no hazardous effects and is easy to manipulate. It has been reported that V2O5 can remarkably improve the current efficiency of Organic field-effect transistors and OLEDs [21–23]. V2O5 has found various applications in sensor and electro chromic devices, lithium batteries, catalysts, etc.
In the present paper, we report the synthesis of POT by chemical oxidation polymerization in aqueous medium and POT/V2O5 composites with five different weight percentage of V2O5. DC conductivity measurements have been done for undoped POT and POT/V2O5 composites separately. The composites are characterized by UV-Visible studies and XRD. FTIR studies have also been performed to study the structural changes due to the incorporation of dopant into polymeric chain. Photoluminescence (PL) studies of the materials were also observed.
2. Experimental
All chemicals used were of analytical reagent (AR) grade. The monomer o-toluidine was distilled prior to use. Ammonium persulphate (NH4)2 S2O8), hydrochloric acid (HCl) and Vanadium pentoxide V2O5 were used as received in the present study.
This approach promotes molecular level mixing of precursor and the polymerization of initiators of both networks. All the composites were filtered and dried in an oven for 24 h and vacuum dried at 60–70° C for 1 h. These composites were then characterized by different techniques.
DC conductivity of all the polymer composites was measured by using two-probe technique in the temperature range 305 - 470K. For measuring DC conductivity, bulk samples in the form of pellets were obtained by finely grinding the polymer powder and then compressing it under a pressure of 6.2 ton. A voltage of 1.5 V (DC) was applied across the pellet and resulting current was measured with a Keithley electrometer Model 6157A. The pellets were mounted between the two steel electrodes inside a metallic sample holder. The temperature was measured with a calibrated copper–constantan thermo couple mounted near the electrodes [24-26].
For information about the crystallinity, X-ray diffraction (XRD) studies have been carried out by using a panalytical (PW 3710) X-ray powder diffractometer with
Cu Kα radiation. The sample is scanned in angular range of 0–700 with scan speed of 0.010/s under similar conditions. UV–Visible Spectroscopy of the samples has been carried out using Camspec M550 double beam UV–Visible Spectrophotometer. FTIR spectra of undoped and doped pellets were obtained by using Perkin Elmer FTIR spectrometer in the range from 400 cm−1 to 4000 cm−1.
3. Results and Discussion
3.1. Dc Conductivity Studies
The electrical conductivity of conducting polymers results from mobile charge
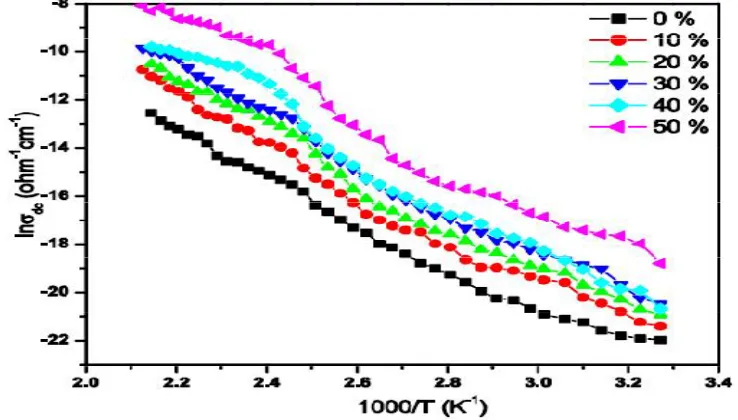
carriers introduced into the π-electronic system through doping [27]. The DC conductivity (σ ) of all the polymer composites in a temperature range of 305 - 470K is studied at a constant voltage of 1.5V. The conductivity as a function of temperature can be represented by the relation [25, 26]
Here △ is the activation energy, σο is the pre exponential factor related to
Arrhenius plots of conductivity of undoped and doped POT with different weight percentage of V2O5 are shown in Figure 1. The value of the activation energy (△ ) is estimated with the help of the slope of lnσdc versus 1000 ⁄plot and using a linear fit. The plots are straight lines, which indicate that conduction in these samples is through an activated process; the change in slope is responsible for the change in activation energy. As the slope of the graph increases with the dopant concentration, DC conductivity and the activation energy increases. Further, the slope of the graph explains the conductivity mechanism taking place in the doped POT samples.
Figure 1: Temperature Dependent DC Conductivity in the Temperature Range (305 K–470 K) of POT/ V2O5 Composites with different Weight Percentage of
V2O5
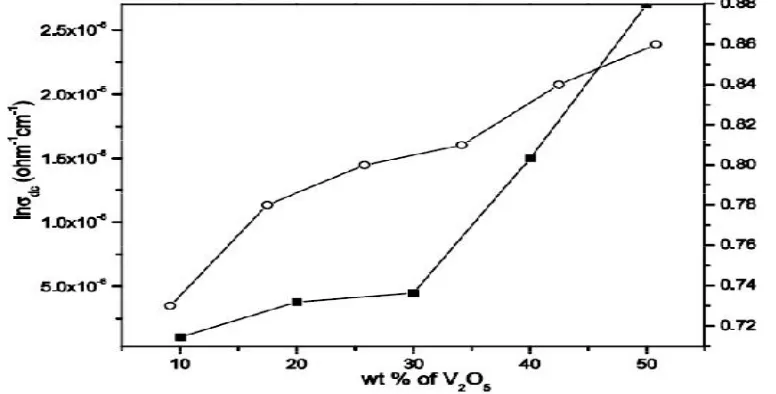
Thus, V2O5 doped POT at these particular doping percentages, can be used for sensor purposes.The variation of σ and △ with concentration of dopant are shown in Figures 2.
Figure 2: The Plot of DC Conductivity and Activation Energy vs. Weight Percentage of V2O5
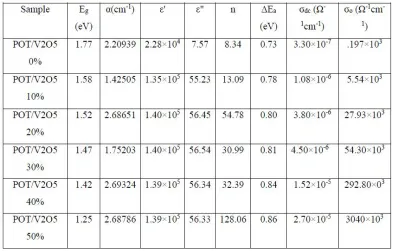
This figure shows that, the initial increase in activation energy with the increase of dopant concentration might be due to the increase of charge carrier concentration and the Fermi level may change. The activation energy alone does not indicate that the mechanism of conductivity is taking place in extended states above the mobility edge or by the hopping in localized states. For obtaining a distinction between these mechanisms, Davis and Mott suggested that the pre exponential factor for conduction in extended states should be two or three orders greater than the conduction in localized states [28]. The magnitude of pre exponential factor lies in the range of 103-104 ohm-1cm-1 which shows that the conduction is due to the excitation of charge carriers into the extended states. Also, the conduction is taking place by hopping process because of the wide range of localized states present near the Fermi level. Thus conduction through extended states is completely ruled out. The value of activation energy, DC conductivity (σdc) and pre exponential factor (σο)
Table 1: Variation of activation energy (ΔEa, ), DC conductivity (σdc), pre -exponential factor (σο) and Indirect band gap (Eg), absorption coefficient (α), real part of dielectric constant (ε'), imaginary part of dielectric constant (ε"), refractive index (n) with different concentration of V2O5 in POT at 450 K, 620 nm
3.2. UV-Visible and Dielectric Studies
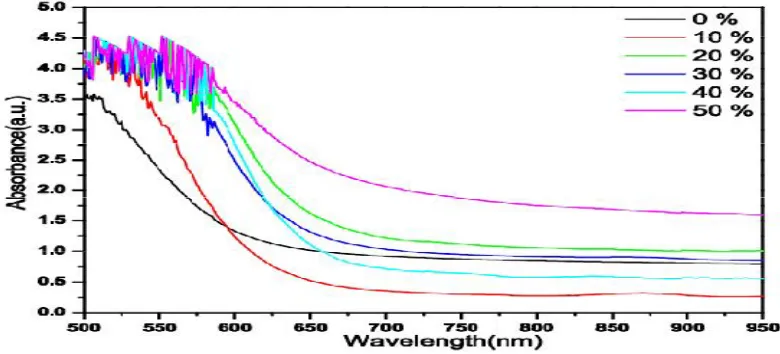
UV-Visible absorption spectra of the undoped and doped POT are shown in Figure 3, which clearly indicates that the absorption intensity increases after doping.
Figure 3: UV-Visible Absorption Spectra of POT/ V2O5 Composites with different Weight Percentage of V2O5
From UV-Visible absorption spectrum the optical band gap has been measured using Tauc’s relation [23, 24],
The index n has discrete values like 1/2, 3/2, 2 or more depending on whether the transition is direct or indirect and allowed or forbidden, respectively. In the direct and allowed cases, the index n is 1/2 whereas for the direct but forbidden cases it is 3/2. But for the indirect and allowed cases n=2 and for the forbidden cases it will be 3 or more. The present system obeys the rule of indirect transition with n=2.
is given by,
where is wavelength of incident photon. The optical band gap of doped
and undoped samples has been measured by plotting versus energy [29]. The optical band gap has been found to decrease with increase weight percentage of V2O5. The decrease in band gap may occur due to broadening of polaron bands, which is attributed to the increase in carrier concentration in the polymer composites. The increase in conjugation also leads to decrease in the optical band gap. The difference between the optical band gap and electronic band gap (activation energy) is due to the indirect transition in the system during optical analysis. This transition has two step process in which electron absorbs both photon and phonon. Here photon supplies the needed energy and the phonon supplies the momentum. But the activation energy is the energy required to excite the electron from valence band to conduction band. So the optical band gap value is always greater than the electronic band gap [30, 31].
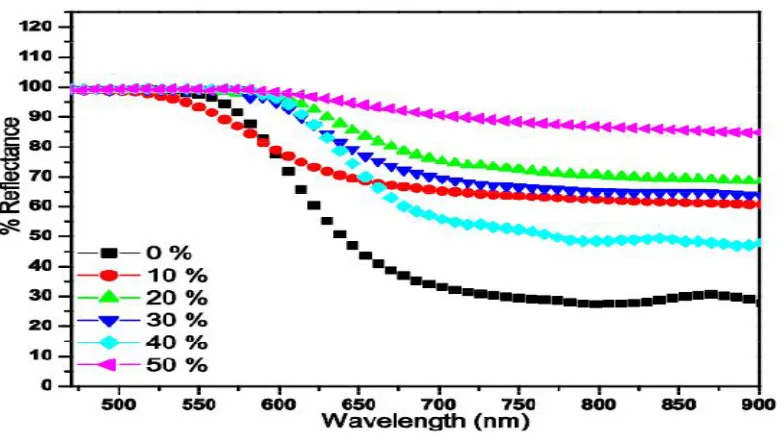
The UV-visible reflection spectrum is given in Figure 4. From reflection and absorption spectra the refractive index, dielectric constant and dielectric loss in the visible region were measured. The refractive index (n) has been determined by using following relation
The values of dielectric constant ( ’) and dielectric loss ( ”) are estimated by using the following relations [25]
Figure 4: UV-Visible Reflection Spectra of POT/ V2O5 Composites at different Weight Percentage of V2O5
The optical parameters have been plotted versus photon energy in figures 5 (a, b). It is clear from these figures that the refractive index and dielectric constant of POT/V2O5 composites increase exponentially with photon energy. Higher dielectric constant and dielectric loss for higher content of oxide, which may be due to increase in oxide, increases the crystallinity (as revealed from XRD). As a result orderliness increases the interfacial interactions between the polymer and V2O5 leading to maximum space charge polarization. The dielectric constant arises due to static dielectric permittivity, which can be given as
Figure 5(a): The Refractive Index of POT/ V2O5 Composites at different Weight Percentage of V2O5
The grain conductivity decreases with increase in V2O5 concentration, the charge carrier concentration decreases resulting in a decrease in grain boundary capacitance. The grain size also decreases with increasing V2O5 content. Hence the reduction of grain boundary capacitance and grain size gives rise to a decrease in dielectric constant. In case of composites, while oxide content is less (i.e. 10%) in the polymer the interface between the polymer and grain is poor leading to decrease in conductivity and dielectric behaviour. There is no change in the dielectric constant in visible region. The change observed only in UV region [31].
3.3. FTIR Studies
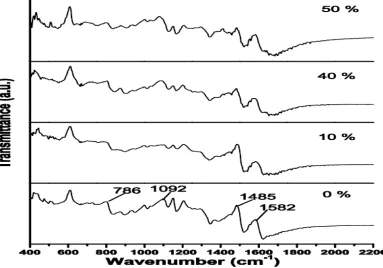
From FTIR spectra we can observe a change in the functional groups. In these spectra, the region from 0 to 1000 cm−1 is the finger print region and 1000 cm−1 to 4500 cm−1 is the functional group region. Figure 6 shows FTIR spectra of undoped POT and POT doped with V2O5 in different compositions (w/w).
Figure shows all the characteristic bands of POT. Bands observed in the range of 1574–1591cm_1 are the characteristic peaks of nitrogen quinoid ring, [32] whose broadening reduces with dopant concentration. According to the vibrational analysis of PANI and its derivatives, the position of this band can be taken as an indication of the degree of oxidation of the polymer. The origin of this band is due to the superposition of C- C stretching vibrations of the benzene ring. The characteristic peaks at around 1582 cm−1 and 1485 cm−1 are attributed to the stretching vibrations of N Q Nand N B N rings respectively (where Q refers to Quinoid and B refers to Benzenoid ring). The band at 1485 cm−1 is assigned to the C H stretching of
secondary aromatic
amine. The band at 1092 cm−1 is attributed to the characteristic peak of B– NH–Q or B–NH–B bonds which are in plane bending modes. The out of plane bending deformations of C – H in the 1, 2, 4 substituted benzene ring are attributed to the band at 786 cm−1. The peaks obtained are in good agreement with the literature of POT [33, 34]. As the dopant concentration is increasing we can see the formation of alkynes corresponding to the wave number 1679–1687 cm−1 which are weak, showing the C=C stretch. The alkyne group creation requires a huge reorganization of molecular bonds. The simultaneous C–C and C–H bond breaking is necessary to trigger the alkyne’s formation. In the present case the electronic excitation energy values are above the threshold, which is necessary to trigger the alkyne formation. The delocalization of π electrons is also evident from the formation of triple bonds. Comparison of POT/ V2O5 spectra with POT spectrum shows shift of peaks of Quinoid units from 1485 cm−1 to 1476 cm−1 and from 1092 cm−1 to 1075 cm−1. The shift in the peak of FTIR spectra of V2O5 doped POT is due to more ion formation after doping. After a doping of 10 % the alkyne formation takes place [35]. This indicates that the formation of triple bonds is affecting the semi conducting property of the doped polymer. So, although there is alkyne formation the semiconducting nature of the doped polymers is more.
3.4. XRD Studies
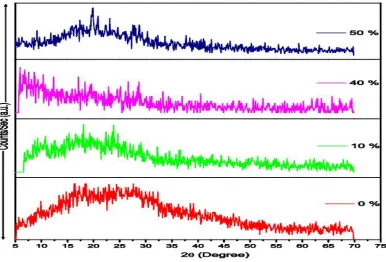
In undoped sample the amorphous hump at 27.30 is in accordance with the values found in the literature [10]. As the concentration of dopant increases, the crystallinity of polymer increases thus reducing the hump at 27.30 in the XRD pattern.
Figure 7: The XRD Pattern of POT at different Doping Concentrations of V2O5
The increase in crystallinity of the composites after doping may be due to the systematic alignment of polymer chain folding or by the formation of single or multiple helices, for part of their length [25].
3.5. Photoluminescence Studies
It is also observed that PL peaks are broadened with increase in doping concentration. The relative intensity of emission peaks is also found to alter with different weight percentage of dopant (due to polarity).
Figure 8: Photoluminescence Spectra of POT at different Doping Concentrations of V2O5
The PL spectra of samples have the same shape, which indicates that it is an efficient way to tune the intensities of the peak by employing specific dopant with different compositions (w/w).
4. Conclusion
In the present communication, POT is successfully synthesized and doped with different weight percentage of V2O5. It has been observed that doping causes noticeable changes in the electrical and spectroscopic properties of POT. DC conductivity measurements show that the polymer composites are semi conducting in nature and there is an increase in conductivity after doping by three orders of magnitude. It is suggested that conduction is taking place due to a wide range of localized states present in the polymer composites. XRD studies of these polymer composites indicate increase in crystallinity after doping which may be correlated with a decrease in the band gap. FTIR spectra corroborate the structural changes of POT after doping of V2O5 and also confirm the incorporation of V2O5 in polymer chain. UV-Visible studies reveal the existence of indirect bandgap within the polymer which decreases after doping. Also the incorporation of the dopant causes systematic alignment of polymeric chains and increases delocalisation in the polymer matrix which lowers the band gap. These composites have been found to show high values of both real and imaginary parts of dielectric constant and loss. The doped polymers exhibit PL emission intensity which makes them suitable for use in various optoelectronic applications, such as polymer LEDs.
Acknowledgements
We also acknowledge Dr. Sukhveer Singh and his group (NPL) for FTIR Spectrophotometer.One of the authors (Shama Islam) acknowledges the financial support by the UGC.
References
MacDiarmid, A.G., & Epstein A. J. (1994). Frontiers of polymers and advanced materials. (New York: Plenum Press) 251.
MacDiarmid, A. G., & Epstein A. J. (1995). secondary doping in polyaniline. Synth. Met., 69, 85.
Kaiser, A. B., Liu, C. J., Gilberd, P. W., Kemp, N. T., Wessling, B., Blaszkiewicz, M., McLachlan, D. S., & Newnham R. (1992). The volume fraction and temperature dependence of the resistivity in carbon black and graphite polymer composites: An effective media—percolation approach. J. Polym. Eng. Sci., 32, 421.
Angelopoulos, M., Ray, A., MacDiarmid, A. G., Epstein A. J. (1987). Polyaniline: Processability from aqueous solutions and effect of water vapor on conductivity. Synth Met., 21, 12.
Andreatta, A., Cao, Y., Chiang, J. C., Heeger, A. J., & Smith P. (1988). Electrically-conductive fibers of polyaniline spun from solutions in concentrated sulfuric acid. Synth Met., 26, 383.
Kumar, N., Vadera, S. R., Singh, J., Das, G., Negi, S. C., Aparna, P., & Tuli A. (1996). Clonductihg Polymers: Emerging Commercial Mater:ials. Def. Sci. J., 56, 91.
Dao, L. H., Leclerc, M., Guay, J., & Chevalier J. W. (1989). Synthesis and characterization of substituted poly(anilines). Synth Met. E, 29, 377.
D’Aparno, G., Leclerc, M., & Zotti G. (1993). J. Electroanal Chem., 35, 145. Mortimer R. J. (1995). Electrochromic materials. Mater Chem., 5 969. Datta, M., & Singhal, R. J., (2006). Appl. Polym. Sci.,103, 3299.
Chen, L. F., Ong, C. K., Neo, C. P., Varadan, V.V., & Varadan V. K. (2004). Microwave electronics: Measurement and materialcharacterization. (England: John Wiley & Sons), 177.
Dutta, P., Biswas, S., Ghosh, S., De, S. K., & Chatterjee S. (2001). The dc and ac conductivity of polyaniline–polyvinyl alcohol. blends Synth. Met., 122, 455.
Gangopadhyay, R., De, A., & Ghosh G. (2001). Polyaniline–poly(vinyl alcohol) conducting composite: material with easy processability and novel application potential. Synth. Met., 123, 529.
Saad, A. A., Khan, W., Dhiman, P. & Naqvi A. H. (2013). Structural, Optical and Magnetic Properties of Perovskite (La1-xSrx)(Fe1-xNix)O3, (x = 0.0, 0.1 & 0. 2) Nanoparticles. Electronic Materials Letters., 9, 77.
Murugesan, R., & Subramanian E. (2003). Charge dynamics in conducting polyaniline–metal oxalate composites. Bull. Mater., Sci. 26, 529.
Troung, V. T., Codd, A. R., & Forsyth M. (1994). Dielectric-properties of conducting polymer composites at microwave-frequencies. J. Mater. Sci., 29, 4331.
Brosseau, C., Queffelec, P., & Talbot P. (2001). Microwave charecterizaation of filled polymers. J. Appl. Phys., 89, 4532.
Rana, O., Srivastava, R., Chauhan, G., Zulfequar, M., Husain, M., Srivastava, P. C., & Kamalasanan M. N. (2012). Modification of metal–organic interface using F4-TCNQ for enhanced hole injection properties in optoelectronic devices. Phys. Status Solidi A, 209, 2539
Majeed Khan, M. A., Zulfequar, M., Kumar, A. & Husain M. (2004). Conduction mechanism in amorphous Se75In25-xPbx films. Mater. Chem. Phys., 87, 179.
Kido, J., Endo, J., Nakada, T., Mori, T., Yokoi, A., & Matsumoto T. Extended Abstract (49th Spring Meeting, 2002), Jpn. Soc. Appl. Phys., p. 1308 [in Japanese].
Lakshmi, G. B. V. S., Avasthi, D. K., Jai Prakash, Siddiqui, A. M., Ali, V., Khan, S. A., & Zulfequar M. (2011). Structural, optical and gas evolution studies of 60 MeV Si5+ ion irradiated PoT-PVC blends. Adv. Mat. Lett., 2(2), 125-130.
Heeger, A. J., Kivelson, S., Schrieffer, J. R., & Su W. P. (1988). Rev. Mod. Phys., 60, 781. Zishan, H. Khan, Malik, M. M., Zulfequar, M., & Husain M. (1995). Electrical conduction
mechanism in a-Se80-xTexGa20 films (0<or=x<or=20). J. phy. Cond. Matter., 7, 8979–8991.
Mott, N. F., & Davis E. A. (1979). Electronics Processes in Non-Crystalline Materials. Clarendon, Oxford, 428.
Ghiordanescu, V., Sina, M., Neldelcu, M. & Giubelan M. J. (2001). Optoelectron. Adv. M., 3, 89.
Mott, N. F., & Davis E. A. (1970). Conduction in non-Crystalline systems. Philos. Mag., 22, 7. Lakshmi, G. B. V. S., Ali, V., Siddiqui, A. M., Kulriya, P. K., & Zulfequar M. (2008).
RF-plasma polymerization and characterization of polyaniline. European Physical Journal, Applied Physics, 39(3), 251.
Tauc, J., Grigirovici, R., & Vancu A. (1996). Phys. Status Solidi, 15, 627.
Shamshad, A. Khan, Zulfequar, M., & Hussain M. (2005). Optical band gap and optical constants in a-Se80Te20−xPbx thin films. Current Applied Physics, 5, 583.
Mallick, K., Witcomb, M. J., & Scurrell M. S. (2006). In situ synthesis of copper nanoparticles and poly(o-toluidine): a metal-polymer composite material. Eur. Polym. J., 42, 670. Saravanan, S., Joseph Mathai, C., Venkatachalam, S., & Anatharaman M. R. (2004). New J
Phys, 664.
Fink, J., & Leising G. (1991). Physical Review B, 15, 2022-2025.
Ameen, S., Ali, V., Zulfequar, M., Haq, M. M., & Husain M. (2009). Preparation and measurements of electrical and spectroscopic properties of sodium thiosulphate doped polyaniline. Current Applied Physics, 9, 2.