277
Structural and Morphological studies on Fly ash Reinforced Polystyrene
Composites
SamikshaTiwari
1, Arunendra Kumar Patel
2, R. Bajpai
1 1Department of Postgraduate Studies and Research in Physics and Electronics,Rani Durgavati University, Jabalpur (M.P.), 482001
2
Department of Postgraduate Studies and Research in Physics and Electronics, St. Aloysius College, Jabalpur (M.P.), 482001
Abstract: - In this study the structure and surface morphology of different type of fly ash reinforced polystyrene composites have been investigated .Fly ash reinforced polystyrene composites have been prepared with the solution casting method. Samples in the form of composite films, AFM analysis is done to observe surface morphology of composites. The AFM images confirm the presence of fly ash particle in Nano phase within PS matrix. XRD analysis is reported the crystallite size, inter planner distance and crystallinity index. It is found that the crystallinity index increases with increasing the concentration of the fly ash. FTIR spectra of pure polystyrene, pure fly ash and fly ash based composites have been observed and analyzed. The shifting of parent peaks was observed in composite films. The shifting may come from the results of physical bonding between polystyrene and fly ash.
Keywords: - AFM, FTIR, XRD, PS, FA.
I. INTRODUCTION
Polymer composites are very important as they are widely used in large number of applications due to their light weight , easy of fabrication and variety of other properties[2],[3]. With increasing demands of high technology areas such as air frame, jet engines, space shuttles and atomic energy field. The need for lightweight materials with high strength and stiffness has led to the development of flyash based composites [4]. The composite concept allows us to produce stiffer, stronger and tough materials with improved elevated temperature capability. Polymers have low strength and stiffness and are ductile .In resent time researchers are exploring the possible use of waste materials like fly ash in composites to produce good materials for wide range of application[3][2]. The flyash is produced as industrial by product from the combustion of coal in thermal power plant and properties of flyash depend primarily on the type of coal burned, the type of combustion of equipment used and the type of flyash collection mechanism [6]. The major component of the flyash is silica and alumina and oxides of iron, calcium, magnesium along with elements like Ti, carbon, Mg. etc. [2].Fly ash can increase the strength and making these
light weight composites very desirable for the automotive ,aircraft and aerospace industries [1]. In developing composites using most environmental friendly wastes as reinforcing fillers and thermosetting polymers as matrixes [9]. Recent investigations of polymer- based composite materials have opened new routes for polymer formulations and have allowed the manufacture of new product with optimal properties for special applications.
II. EXPERIMENTAL
2.1 Materials
For the preparation of the polymeric composite films ,the commercially available polymer Polystyrene obtained from- Research lab fine chemical industries Mumbai and fly ash in powder form has produced from thermal power plant ,Singroli (M.P.) used without further purification.
2.2 Preparation of Specimen
Fly ash in different concentration was added to the polystyrene to yield the composite of required concentration and designated as pure polystyrene(PS), pure fly ash (FA), 3% FA & PS, 5% FA & PS and 8% FA & PS for 3,5 and 8 weight percentage concentration of fly ash respectively. The solution casting method has been utilized to prepare the composite films of pure polystyrene(PS) and fly ash based composite films. 1, 2 Dichloroethane has been taken as solvent. Fly ash and polystyrene were mixed in solvent 1,2 dichloroethane with the help of magnetic stirrer at 60 0C temperature for 6h. A known quantity of homogeneous solution poured in glass mould of size 5x5 cm2 and kept in an electric oven at 70 0C temperature for 24h. Samples of 4x2 cm2 size were cut from the pallets and kept in the air tight polyethylene bags.
2.3 FTIR Spectroscopy
The structural characterization of pure polystyrene, fly ash powder and their composites of various ratio were recorded with NICOLET 6700 (Thermo scientific) with resolution of 4 cm-1.
2.4 X-ray Diffraction
278 RIGAKU 18KV diffractometer, X-ray powder
diffractometer with CuKα radiation (wave length
0.15405 nm) performed at 40kV and 100 mA. The diffraction pattern is recorded in the 2θ range from 100 to 700 with scanning speed of 20 per minute. The crystallinite has been measured on the premise that increasing amorphousness tends to broaden the line width whereas increasing crystallinity increasing the intensity. The height (CrH) of the main peak above its adjacent minimum represents the crystallinity of the sample and the width (AmW) of the peak at this adjacent minimum is considered to represent the amorphousness of the sample. The crystallinity CrI is calculated from the Eq.1:
CrI = [1 - t x (AmW)/ (CrH)] (1)
Where t is the scale factor relating the height of CrH to full scale (total blackness)[5]. From the diffraction patterns of the various samples, the interplaner distance
d was computed for different peaks. Bragg‟s equation
3 was used to determine the distance between two successive planes from which the X-rays were diffracted:
2dsinθ = nλ (2)
Where λ is the X-ray wavelength, θ is the Bragg‟s angle and n is the order of diffraction .d was calculated from the first order (n = 1) for various peaks obtained in the diffraction patterns (Eq. 3):
d = λ/ (2sinθ) (3)
The relationship between the crystallite size and the X-ray line broadening was determined from the
Scherrer „s equation:
D = kλ / βsin θ (4)
Where, D is crystallite size , λ is the wavelength, β is
the angular line width of half maximum intensity , and
θ is the Bragg‟s diffraction angle ,k is the constant
with a value of 0.89[7].
2.5 AFM Study
In present investigation the surface topography was determined using SOLVER NEXT, NT-MDT, Moscow made in Russia atomic force microscope and analysis was carried out using semi contact mode.
III.RESULTS AND DISCUSSION
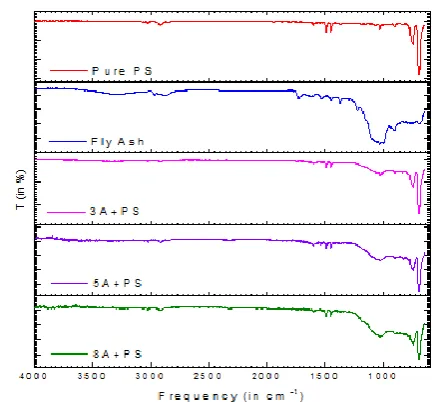
3.1 FT- IR Spectroscopy
The FT-IR spectrum of pure polystyrene in (fig .1) indicates the details of functional groups present in
the synthesized polystyrene. The characteristic absorption bands of pure PS polymer film occur at 3019 cm-1 and 2923.7 cm-1 due to aeromatic and aliphatic C-H stretching respectively. The peaks at 1492.2 cm-1 and 1447.8 cm-1 are ascribed to the aeromatic C=C stretching. The peaks at 1026 cm-1 and 904 cm-1 due to out of plane bending vibration of =C-H of vinyl group [10].The styrene prominent peaks appear at 745.2 cm-1 and 694.2 cm-1 due to out of plane bending vibrations of aeromatic =C-H and C=C respectively. The FTIR spectra of pure FA are shown in fig.1 .The characteristic absorption bands of FA occurs at 3280.8 cm-1 due to symmetric and anti-symmetric stretching vibrations of water band. The O-H stretching bending vibrations appears at 2866.3 cm-1 and 1634.2 cm-1. The C-O stretching vibrations of CO3
2-observed at 1444 cm-1 [8].The Si-O vibration appear at 1224.6 cm-1 and 1153.4 cm-1. The Si-O-Si asymmetric stretching vibration observed at 1023 cm-1. C-O bending vibration of CO32- appears at 904 cm-1 and Al-O vibrations
occurs at 666 cm-1 [6].
Figure 1 FTIR analysis of pure polystyrene (PS), Fly ash (FA) powder, 3wt% FA and PS, 5wt%FA and PS, and
8wt% FA and PS
279 vibrations appear at 663.4 cm-1. These shifts also have been observed for higher concentration composites.
3.2 X-ray Diffraction
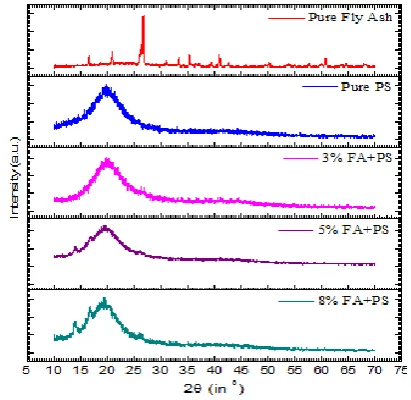
The structure and morphology is basically dependent upon regular arrangement of the atomic system or crystallinity. Polymers are in general amorphous or semi crystalline material. Crystallization of polymer depends on the degree of missibility and mobility of crystallizable and non crystallizable component in the specimen. The X-ray pattern of pure polystyrene, fly ash powder and fly ash reinforced polystyrene composites are showed. In all the samples based on the fly ash reinforced polystyrene composites a broad peak observed between 150 to 240 .
Figure 2 X-Ray diffraction pattern of pure fly ash, pure polystyrene,3wt% fly ash and PS,5wt% fly ash and
PS,8wt% fly ash and PS.
Table 1 Crystallinity, Peaks at 2θ (0
), Interplaner distance„d‟ (A0) and Crystallite size „D‟ (A0)
The flyash powder gives the broad peak at 26.60 to 26.90. In pure polystyrene a broad peak observed between 120 to 270 , yielding crystallinity index (CrI) = 44.5%.Since the fly ash contains SiO2 , Al2O3, Ca(Co)3, Fe2O3 and other constituents which contributes to crystalline phase, so reinforcement of fly ash within polystyrene increases the crystallinity of the prepared composites.
The CrI increases from 44.5% to 56.14% for the 3 wt. %. Concentration of flyash in polystyrene. The interplaner distance “d” is 4.439 A0 and crystallite size (D) increase from 5.325 A0 to 7.262 A0. These parameters also increase for 5 wt. % as shown in the table 1.The higher concentration of fly ash ( 8 wt. %) within polystyrene gives the crystallinity index 56.39%, interplaner distance 4.671 A0 and crystallite size 7.976 A0.
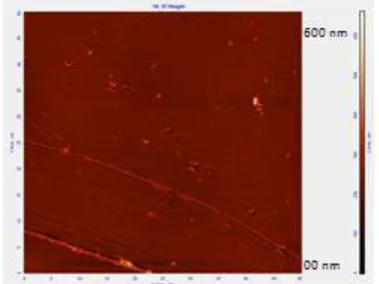
3.3 AFM study
The surface structural studies on the basics of AFM exhibits development of compatible and smooth structures of FA and PS composites leading to morphological texture with uniform distribution of FA over the PS surface. It can be inferred from fig.3(a - b) of pure PS film that features like nano hills structure with 80 nm size are observed on pure PS film surface . The incorporation of FA in to the PS in different concentrations seems to development of nano domain globular structures within the PS matrix. The distinctive domains with reasonable size and shape of FA within the PS matrix are obtained for various compositions. 3D and 2D AFM image reveals the dispersion of well-organized FA domains within the PS matrix (figure 3 a - h).
Figure 3(a) Pure PS 3D AFM Topography
Figure 3(b) Pure PS 2D AFM Topography
280 of nano domains are increasing and giving rough and stable surface to the developed nano composite films.
Figure 3 (c) 3 % FA composite 3D AFM Topography
Figure 3 (d) 3 % FA composite 2D AFM Topography
Figure 3 (e) 5 % FA composite 3D AFM Topography
Figure 3 (f) 5% FA composite 2D AFM Topography
Figure 3 (g) 8 % FA composite 3D AFM Topography
Figure 3 (h) 8 % FA composite 2D AFM Topography
IV. CONCLUSION
The outcome of the studies undertaken for the structural and morphological behavior of fly ash reinforced polystyrene composite can be formed. The FT-IR studies of pure polystyrene, fly ash and fly ash reinforced polystyrene composite confirms the formation of new peaks and shifting of existing peaks which occurs in the prepared composites thus there is a better linkage of flyash molecules with polystyrene molecules confirming the development of stable composites. The XRD measurement indicates that there is a formation of crystalline region. Crystallinity Index and crystallite size also increases with increasing the concentration of fly ash. The AFM study of pure PS and composites confirm the presence of nano particles of fly ash on the surface of the polymer matrix. The qualitative analysis of these images also confirms the good linkage of these nano particles within the PS matrix. All these studies confirm that the addition of fly ash within the polystyrene causes the enhancement in crystallinity and morphology yielding better structural properties.
ACKNOWLEDGEMENTS
The author acknowledges with thanks Mr. Akhilesh Singh of the department of Material science IT-BHU for FTIR & XRD, Mr. KKS Gautam of the department of Material science MANIT Bhopal for the help during test AFM of the samples.
REFERENCES
281 based composites with flyash, cenospheres, and calcium aluminosilicate as fillers. Journal of applied polymer science, Vol. 116, 3087-3094, (2010).
[2]. Singla Manoj and Chawla Vikas. Mechanical properties of Epoxy resin Flyash composite. Journal of minerals & materials characterization & Engineering, Vol. 9, No. 3, PP 199-210, (2010).
[3]. Chauhan S.R., Kumar Anoop Singh and Kumar Prashant. Effect of flyash content on friction and dry sliding wear behavior of Glass fiber reinforced polymer composites – A Taguchi Approach. Journal of minerals & Materials Characterization & Engineering, Vol. 9, No. 4, pp. 365-387, (2010).
[4]. Kishore. Kulkarni SM, Sharathchadra S, Sunil D. On the use of an instrumented set-up to characterize the impact behavior of an epoxy system containing varying flyash content. Polymer testing 21, pp. 763-771, (2002).
[5]. Statton WO. Hand book of X-ray diffraction, emission, absorption and microscopy. In: Kaelble EF (Ed) Chapter 21, McGraw-Hill, New York, pp. 21.1-21.19, (1967).
[6]. Celik Ozlem, Damli Erdem & Diskim Sabriya .Characterization of flyash and its effects on the compressive strength properties of Portland cement. Indian Journal of engineering & materials sciences Vol. 15, pp. 433-440, (2008).
[7]. Dubey PK, Bajpai R, Keller JM. Structural, morphological and micro hardness characterization in polymer complex of laser dye Rhoda mine (Rh6G) doped polymethyl methacoylate. Microsyst Technol 14; 1165-1171, (2008).
[8]. Fernandez –Jeinenez A, and Palmo A. Composition and microstructure of alkali activated flyash binder: Effect of the activator. Science direct cement and concrete research 35, 1984-1992, (2005).
[9]. P. E. Imoisili, C.M. Ibegbulam, T.I. Adejugbe, the Pacific Journal of Science and Technology, pp. 463-468, 2012.
[10].Yongfeng Li,Yixing Liu, Xiurong Li ,Jian Li, Xiangming Wang. Material Science Forum Vols. 675-677; pp. 491-494, (2011).
AUTHOR’S PROFILE
Mrs. Samiksha Tiwari is a Research Scholar, Department of Postgraduate Studies and Research in Physics and Electronics, Rani Durgavati University, Jabalpur (M.P.). Her fields of interest are Polymer & Bio composite Synthesis and Characterization.
Dr. Arunendra Kumar Patel did his Ph.D. from Rani Durgavati University, Jabalpur (M.P.). Currently he is working as Assistant Professor, Department of Postgraduate Studies and Research in Physics and Electronics, St. Aloysius College, Jabalpur. His fields of interest are Synthesis and Characterization of Polymers blends composite and Bio composites.