1
Added dietary cobalt or vitamin B12, or injecting vitamin B12 does not
2improve performance or indicators of ketosis in pre- and
post-3partum Holstein-Friesian dairy cows
45 6 7
W.A.D.V. Weerathilake1*, A.H. Brassington2, S.J. Williams1, W.Y. Kwong2, L.A.
8
Sinclair1† and K.D. Sinclair2
9 10
1Department of Animal Production, Welfare and Veterinary Sciences, Harper Adams 11
University, Edgmond, Newport, Shropshire, UK, TF10 8NB
12
2School of Biosciences, University of Nottingham, Sutton Bonington Campus,
13
Loughborough, Leicestershire, UK, LE12 5RD
14 15 16 17 18
*Current address: Department of Livestock and Avian Science, Faculty of Livestock, 19
Fisheries and Nutrition, Wayamba University of Sri Lanka, Makandura, Gonawila
20
(NWP), 60170, Sri Lanka.
21 22 23
†E-mail: lsinclair@harper-adams.ac.uk 24
25
Short title: Cobalt and vitamin B12 metabolism in dairy cows
Abstract 28
Vitamin B12 is synthesised in the rumen from cobalt and has a major role in metabolism
29
in the peripaturient period, although few studies have evaluated the effect of the 30
dietary inclusion of cobalt (Co), vitamin B12 or injecting vitamin B12 on the metabolism,
31
health and performance of high yielding dairy cows. Fifty-six Holstein-Friesian dairy 32
cows received one of four treatments from 8 weeks prior to calving to 8 weeks post 33
calving: C, no added Co; DC, additional 0.2 mg Co/kg DM; DB, additional 0.68 mg 34
vitamin B12/kg DM; IB, intra-muscular injection of vitamin B12 to supply 0.71
35
mg/cow/day pre-partum and 1.42 mg/cow/day post-partum. The basal and lactation 36
rations both contained 0.21 mg Co/kg DM. Cows were weighed and condition scored 37
at drying off, 4 weeks prior to calving, within 24 h of calving and at 2, 4 and 8 weeks 38
post-calving, with blood samples collected at drying off, 2 weeks pre-calving, calving 39
and 2, 4 and 8 weeks post-calving. Liver biopsy samples were collected from all 40
animals at drying off and 4 weeks post-calving. Live weight changed with time, but 41
there was no effect of treatment (P>0.05), whereas cows receiving IB had the lowest
42
mean body condition score and DB the highest (P<0.05). There was no effect of
43
treatment on post-partum DM intake, milk yield or milk fat concentration (P>0.05) with
44
mean values of 21.6 kg/day, 39.6 kg/day and 40.4 g/kg respectively. Cows receiving 45
IB had a higher plasma vitamin B12 concentration than those receiving any of the other
46
treatments (P<0.001), but there was no effect (P>0.05) of treatment on homocysteine
47
or succinate concentrations, although mean plasma methylmalonic acid 48
concentrations were lower (P=0.019) for cows receiving IB than for Control cows.
49
Plasma β-hydroxybutyrate concentrations increased sharply at calving followed by a 50
decline, but there was no effect of treatment. Similarly, there was no effect (P>0.05)
51
of treatment on plasma non-esterified fatty acids or glucose. Whole tract digestibility 52
there was little effect of treatment on the milk fatty acid profile except for C15:0, which 54
was lower in cows receiving DC than IB (P<0.05). It is concluded that a basal dietary
55
concentration of 0.21 mg Co/kg DM is sufficient to meet the requirements of high 56
yielding dairy cows during the transition period, and there is little benefit from additional 57
Co or vitamin B12.
58
Key words: dairy cow, digestibility, liver metabolism, milk, minerals 59
60
Implications 61
The microbes in the rumen of dairy cows require cobalt to synthesise vitamin B12 which
62
the cows then requires for efficient energy and protein metabolism, particularly during 63
the transition from pregnancy to early lactation. This study investigated the effect of 64
feeding different levels of dietary cobalt and supplementing the diet or injecting vitamin 65
B12, and found little benefit from providing additional amounts on cow performance,
66
health or milk quality. This information can be used to more accurately formulate diets 67
for dairy cows to improve health and performance and reduce diet costs. 68
69
Introduction 70
During the transition period from late gestation to early lactation it is usual for dairy 71
cows to experience an imbalance between dietary energy intake and nutrient demand 72
for milk production (Lean et al., 2013; Raboisson et al., 2014). This results in varying
73
degrees of negative energy balance and consequently mobilisation of body adipose 74
tissue (Raboisson et al., 2014). The inability of the liver to metabolise mobilised fat
75
can result in sub-clinical or clinical ketosis, normally defined when plasma β-76
hydroxybutyrate (3-OHB) concentrations are ≥ 1.2 mmol/L (McArt et al., 2013). The
77
prevalence of sub-clinical ketosis (SCK) has been reported to be approximately 22% 78
in European dairy herds (Suthar et al., 2013), whilst in North America a rate of 43%
has been reported (McArt et al., 2012). Cows with SCK have been reported to have
80
an increased odds of developing clinical ketosis, displaced abomasum and metritis of 81
9.5, 5.0 and 1.5 respectively (Suthar et al., 2013), and a decreased probability of
82
pregnancy (Raboisson et al., 2014).
83
Vitamin B12 has a major role in the metabolism of lipid by the liver and subsequently
84
plays a central role in controlling SCK. One of the two main functions of vitamin B12 in
85
the dairy cow is its action as a co-factor in the transformation of methylmalonyl CoA to 86
succinyl CoA which is then used in the Krebs cycle within the liver for the synthesis of 87
glucose from propionate (McDowell 2000). Insufficient tissue supply of vitamin B12
88
therefore results in an accumulation of methylmalonic acid (MMA) and ketones in the 89
blood. The second role of vitamin B12 is its requirement as a co-factor for the synthesis
90
of methionine via the transfer of a methyl group from 5-methyl-tetrahydrofolate to 91
homocysteine (McDowell 2000). Methionine is generally regarded as one of the first 92
limiting amino acids in milk protein synthesis (NRC, 2001) and plays a key role in the 93
synthesis of S-adenosylmethionine as a methyl donor (McDowell 2000), and
94
consequently has a major impact on milk production. 95
Within the rumen, elemental cobalt (Co) is used by bacteria to synthesise 96
vitamin B12, and it has traditionally been considered that the rumen bacteria are able
97
to synthesise sufficient amounts to meet the cows requirements over the peri-98
parturient period and throughout lactation, provided there is a sufficient dietary supply 99
of Co (NRC, 2001). The current recommended level of dietary Co for dairy cows, 100
based on NRC (2001), is 0.11 mg/kg DM, but vitamin B12 synthesis in the rumen has
101
been shown to increase linearly between 0.1 and 1.0 mg Co per kg DM (Tiffany et al.,
102
2003; 2006), and growing beef cattle are known to respond to dietary Co levels up to 103
0.25 mg/kg DM (Stangl et al., 2000). In the well-fed dairy cow, serum vitamin B12
104
and Socha, 2007), but crucially, production and liver-health related responses to 106
dietary Co spanning current recommended levels have not been determined in the 107
transition cow, highlighting an area where investigation is required. Additionally, whilst 108
elemental Co is nontoxic, dietary Co sources have recently been re-classified under 109
EU legislation (EU 601/2013 amended 2014) as carcinogenic, so that mineral 110
premixes have been set to contain a maximum of 0.34 mg Co/kg DM. Rumen 111
protected forms of vitamin B12 are available, but given that vitamin B12 is important in
112
rumen function, it is questionable if rumen protected sources of vitamin B12 alone are
113
desirable substitutes for dietary Co. Consequently, there is a need to re-evaluate dairy 114
cow Co requirements and the benefits of vitamin B12 supplementation over the
peri-115
parturient period in higher yielding dairy cows. The objectives of the study were to 116
determine the effects of the dietary addition of Co, vitamin B12 or the injection of vitamin
117
B12 in late gestation/early lactation on dairy cow metabolism, intake and performance.
118 119
Materials and methods 120
Animals and treatments
121
Fifty-six Holstein-Friesian dairy cows (12 primiparous and 44 multiparous) 122
commenced the study 57 (SE ± 0.9) days pre-partum, and remained on study until 56 123
days post-partum. Cows were blocked according to parity (1st, 2nd and 3rd+), and
124
previous 305 day milk yield, and randomly allocated to one of four dietary treatments. 125
Pregnant, non-lactating cows were housed in a free stall-building from the end of 126
lactation (approximately 8 weeks prior to calving), with ad libitum access to the same
127
basal dry cow diet which was fed as a total mixed ration (TMR; Table 1) via a barrier 128
with individual head locks. Approximately 3 days prior to calving the cows were 129
transferred to a straw bedded calving yard where they remained until approximately 130
housed in a loose yard where they had access to a lactation TMR that contained no 132
added Co via a feed barrier with individual head locks. Cows were then transferred to 133
free-stall housing containing individual feeders. All cows had continual access to 134
water. 135
Prior to calving the cows received one of four dietary treatments: C = no added 136
Co; DC = an additional 0.2 mg Co/kg DM (supplied as cobalt carbonate; Anima, 137
Krakow, Poland); DB = 0.68 mg added vitamin B12/kg DM (Impextraco, Heist-op-den
138
Burg, Belgium) or IB = injected vitamin B12 (5 ml of 1000 µg vitamin B12/ml resulting in
139
0.71 mg/day; AnimalCare, York, UK; intra muscular every 7 days). The additional level 140
of 0.2 mg Co/kg DM in DC was chosen to provide a daily Co supply approximately 141
twice that of C, but to be within the permitted EU legal limit of 0.34 mg/kg DM. The 142
0.68 mg vitamin B12/kg DM provided in DB was calculated to provide a similar
143
predicted tissue supply of vitamin B12 as DC assuming a 4 % conversion of Co to
144
cobalamin, a loss of 80 % of supplementary vitamin B12 in the rumen, and 10 %
145
absorption of vitamin B12 at the duodenum (Stemme et al., 2008; Girard et al., 2009;
146
Akins et al., 2013). The level of injected vitamin B12 was chosen to provide a
supra-147
nutritional tissue supply based on Girard and Matte (2005a), and therefore act as a 148
positive control. All animals were individually supplemented with 200 g/day of ground 149
wheat which acted as a carrier for treatments DC and DB by restraining each cow 150
using the individual head-lock gates until the daily allowance had been consumed, and 151
assuming a DM intake of 12 kg/cow/day (NRC, 2001). 152
From calving until approximately 8-10 days post-calving all cows were fed a TMR 153
(Table 1) containing no additional Co or vitamin B12. During this period all animals
154
were supplemented with 200 g/day of ground wheat as a carrier to provide treatments 155
DC and DB, assuming a DM intake of approximately 20 kg/day (NRC 2001), with IB 156
receiving 10 ml of 1000 µg vitamin B12/ml injected every 7 days, resulting in 1.42
mg/day. For the remainder of the study the supplements were included into the TMR, 158
and intake monitored using roughage intake feeders (Hokofarm, Marknesse, The 159
Netherlands). 160
Experimental routine
161
The cows were weighed and condition scored (Ferguson et al., 1994) at drying off, 4
162
weeks post-drying off, within 24 h of calving, and at weeks 2, 4 and 8 post-calving. 163
Samples of the TMR and individual forages were collected weekly: the forage sample 164
was oven dried and the quantity of lucerne and maize silage adjusted to achieve the 165
desired ratio, and the TMR sample frozen at -20°C prior to analysis. Blood samples 166
were collected by jugular venepuncture at 1000 h on the day of drying off, 6 weeks 167
post-drying (approximately 2 weeks prior to calving), within 24 h of calving, and 2, 4 168
and 8 weeks post calving. Liver samples were collected by biopsy through the 11th
169
intercostal space from all animals at drying off and at 4 weeks post-calving; samples 170
were snap frozen in liquid N and stored at -80°C until subsequent analysis. Cows were 171
milked twice daily at approximately 0600 and 1700 h, with yield recorded at each 172
milking, and samples taken weekly on consecutive am and pm milkings for subsequent 173
analysis. Additional milk samples were collected during week 7 of lactation for the 174
determination of the fatty acid (FA) profile. Whole tract digestibility was estimated 175
during week 7 of lactation by collecting faecal samples from each cow over 5 days at 176
approximately 0800 and 1400 h (Van Keulen and Young, 1977), and stored at -20°C 177
for subsequent analysis. 178
Chemical analysis
179
Weekly TMR samples were bulked within month and analysed according to AOAC 180
(2012) for DM (934.01) and CP (988.05), whilst NDF and ADF were determined 181
according to Van Soest et al. (1991). The determination of NDF was conducted without
182
analysed for major and trace minerals as described by Cope et al. (2009). Plasma
184
samples were analysed for urea, glucose, non-esterified fatty acids and 3-185
OHB (Randox Laboratories, County Antrim, UK; kit catalogue no. TP245, UR221, 186
AB362, GL1611, FA115 and RB 1008 with an intra-assay CV of 3.5, 1.8, 3.0 and 4.7% 187
respectively) using a Cobas Miras Plus auto-analyser (ABX Diagnostics, Bedfordshire, 188
UK). Plasma samples were analysed for mineralsas described by Cope et al. (2009). 189
Analysis of plasma vitamin B12, homocysteine, MMA, succinic acid (SA) and hepatic
190
triacylglycerol (TAG) concentration (along with their intra-assay CV) are provided in 191
Supplementary Material S1. For MMA and SA only the two most extreme treatments 192
(C and IB) were analysed. Milk samples were analysed for fat, protein, lactose and 193
somatic cell count by Eurofins UK (Wolverhampton, UK). Fatty acid methyl esters 194
(FAME) in hexane were prepared from milk fat and individual FAME were determined 195
by GLC (Hewlett Packard 6890, Wokingham, UK) fitted with a CP-Sil 88 column (100 196
m x 0.25 mm i.d. x 0.2 μm film) as described previously by Sinclair et al., (2015). 197
Faecal samples were bulked between days and sampling times and analysed for acid 198
insoluble ash (Van Keulen and Young 1977), ash (AOAC, 2012; 942.05), CP, NDF 199
and ADF. 200
Statistical analysis
201
Performance and blood parameters were analysed as repeated measures 202
analysis of variance, using Genstat 17.1 (VSN Int. Ltd., Oxford, UK). The performance 203
in the week prior to allocation was used as a co-variate where appropriate: 204
Yijk = µ + Bi + Cj + Tk + Cj.Tl + εijk
205
Where Yijk = dependent variable; µ = overall mean; Bi = fixed effect of blocks; Cj =
206
effect of treatment; Tk = effect of time; Cj.Tk = interaction between treatment and time,
207
and εijk = residual error. Milk SCC and hepatic TAG concentrations were log
208
levels substituted parity for treatment. Milk FA concentration and diet digestibility were 210
analysed as a randomised block design by analysis of variance as: 211
Yij = µ + Bi + Cj + εij
212
Where Yij = dependent variable; µ = overall mean; Bi = fixed effect of blocks; Cj =
213
effect of treatment, and εij = residual error. Results are presented as treatment
214
means with a SED, with post-hoc analysis using Tukey’s test at a 5% level of 215
significance. 216
217
Results 218
Diet analysis, intake and animal performance.
219
The chemical composition of the basal dry-cow diet was similar to that predicted, 220
whereas the background concentration of Co was higher in both the dry cow and 221
lactation diets at 0.21 mg/kg DM (Table 2). The four lactation diets had a similar mean 222
DM, OM, CP, NDF and ADF concentration of 469 g DM/kg, 940, 168, 368 and 231 223
g/kg DM respectively. The four diets also had a similar concentration of macro and 224
trace elements. In contrast, the treatments with no added Co (C, and IB) had a dietary 225
concentration of approximately 0.21 mg Co/kg DM, whilst DC had almost double the 226
dietary concentration of Co, with DB being 0.02 mg Co/kg DM higher than the Control. 227
There was an increase in DM intake (P<0.001) from 18.6 kg/d during week 2 of
228
lactation to 23.7 kg/d during week 8, with a mean intake of 21.6 kg/d over the study 229
period, but there was no effect (P>0.05) of dietary treatment or treatment x time
230
interaction (Table 3). Similarly, milk yield increased (P<0.001) from 30.3 kg/d in week
231
1 to 43.6 kg/d in week 8 of lactation, but there was no effect (P>0.05) of treatment or
232
time x treatment interaction on milk performance or composition, with mean values of 233
39.6 kg/day, 40.4 g/kg and 33.1 g/kg for milk yield, fat and protein concentration 234
respectively. There was an effect of time (P<0.001) on live weight, which increased
between drying off and 4 weeks pre-calving, before decreasing immediately post-236
calving but there was no effect (P>0.05) of treatment, or time x treatment interaction.
237
There was also an effect of time on BCS (P<0.001), which declined post-calving, and
238
treatment, with cows receiving IB having the lowest and DB the highest BCS (P<0.05).
239
Plasma metabolite and mineral concentrations, and hepatic triacylglycerol content
240
Plasma glucose concentration decreased from 8 weeks pre-calving to calving, then 241
increased to week 8 post calving (P<0.001), but there was no effect (P>0.05) of dietary
242
treatment on weekly or mean concentration (Table 4 and Supplementary Figure 1a). 243
In contrast, plasma 3-OHB concentrations increased pre-calving, with a sharp 244
increase at calving followed by a decrease at week 2 of lactation (Supplementary 245
Figure 1b), but there was no effect (P>0.05) of dietary treatment. There was an effect
246
of time on plasma NEFA concentration (Supplementary Figure 1c; P<0.001), which
247
decreased pre-calving, before increasing post-calving, but there was no effect 248
(P>0.05) of treatment. Plasma urea concentrations declined rapidly at calving
249
(Supplementary Figure 1d; P<0.001) but were not affected (P>0.05) by treatment.
250
There was no effect (P>0.05) of dietary treatment on mean plasma mineral
251
concentration, except Co, which was higher (P<0.05) in cows receiving DC or IB than
252
C or DB, and Zn, which was higher in cows receiving DC than IB (P<0.05).
253
There was a treatment x time interaction (P<0.001) for plasma vitamin B12
254
concentration, which decreased post calving in all treatments (Figure 1a), and overall 255
was higher (P<0.001) in cows receiving IB than any of the other treatment groups (246
256
vs 192, 195 and 190 pmol/L for IB vs C, DC and DB respectively). There was no 257
treatment effect on plasma concentrations of homocysteine, which decreased 258
(P<0.001) following calving (Figure 1b). In contrast, plasma concentrations of both
259
MMA (Figure 1c) and SA (Figure 1d) increased (P<0.001) following parturition, with
260
an interaction between treatment and time for plasma MMA concentrations (P=0.033);
MMA being lower in IB than Control cows post-calving. There was no treatment effect 262
on hepatic TAG concentrations pre- or post-partum (P>0.05), however, TAG
263
concentrations were higher (P<0.001) in samples collected during the early
post-264
partum period than during late gestation. 265
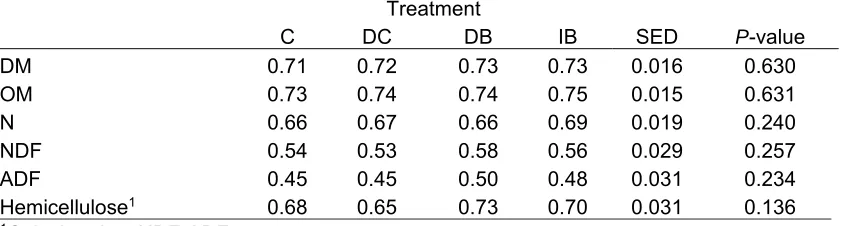
Diet digestibility and milk fatty acid profile
266
There was no effect (P>0.05) of dietary treatment on the digestibility of any of the
267
parameters measured (P>0.05; Table 5). There were few differences in the FA profile
268
of milk from cows fed any of the treatments, except C15:0 which was lower (P<0.05)
269
in cows receiving supplementary Co (DC) compared to injected vitamin B12 (IB; Table
270
6). The desaturase index calculated using cis-9, trans-11 CLA was lower (P<0.01) in
271
cows receiving IB compared to C or DC, but there was no other effect of dietary 272
treatment. 273
274
Discussion 275
To attempt to provide a low dietary Co concentration in the current study, feed 276
ingredients were selected to be low in Co, with the mineral/vitamin supplement 277
formulated to contain no Co. Despite this, both the dry cow and lactation control diets 278
contained 0.21 mg Co/kg DM, above the recommended dietary requirement of 0.11 279
mg/kg DM stated by NRC (2001), but considerably lower than a number of similar 280
studies that have attempted to provide low dietary Co diets (Akins et al., 2013; Girard
281
et al., 2009). The addition of 0.2 mg Co/kg DM in DC resulted in a dietary concentration
282
approximately twice that of C, but was well within the permitted EU legal limit of 0.34 283
mg added Co/kg DM, or the 1.14 mg Co/kg DM limit in the total diet. 284
Performance and dry matter intake
285
The peri-parturient period in dairy cows is characterised by a phase of negative energy 286
homeorhetic and homeostatic regulation of metabolic functions (McArt et al., 2013). In
288
particular, there is a substantial increase in demand for glucose for foetal growth in 289
late pregnancy, and for the synthesis of lactose for milk production by the mammary 290
gland in early lactation (Lean et al., 2013). Vitamin B12, through its role as a co-enzyme
291
for methylmalonyl-CoA mutase (EC:5.4.99.2), is crucial for the synthesis of glucose
292
from propionate (McDowell, 2000), and a deficiency in this vitamin can be translated 293
into a reduction in milk synthesis (NRC, 2001). Milk secretion also requires a 294
considerable supply of amino acids, with methionine generally being regarded as one 295
of the first rate limiting AA in most dairy cow rations (NRC, 2001), and vitamin B12 has
296
a key role in the activity of methionine synthase (EC:2.1.1.13) which regenerates
297
homocysteine to methionine (McDowell 2000). In the current study, additional dietary 298
Co or vitamin B12 or parenteral supply of vitamin B12 did not influence milk production
299
or composition in early lactation. Similarly, Kincaid and Socha (2007) reported no 300
effect of dietary Co concentration (0.15, 0.89 and 1.71 mg/kg DM) on early lactation 301
milk yield or composition. In contrast, Juchem et al., (2012) reported a decrease in
302
milk fat concentration, but not fat yield, when rumen protected B-vitamins were 303
included in dairy cow rations, although the combination of vitamins used precludes 304
any conclusion to be drawn on the relative efficacy of vitamin B12. Duplessis et al.,
305
(2017) also reported no effect of weekly injections of 10 mg of vitamin B12 on milk
306
performance or composition over the transition period. Weekly intramuscular 307
injections of vitamin B12, however, resulted in a significant increase in energy corrected
308
milk yield of early lactation primiparous dairy cows supplemented with folic acid and 309
methionine in the study of Girard and Matte (2005a), due to a combination of an 310
increase in milk yield and milk fat concentration, despite dietary Co levels being stated 311
as adequate. In contrast, NRC (2001) concluded that there was no evidence of a 312
performance response to vitamin B12 injections in dairy cows when fed adequate (i.e.
above 0.11 mg/kg DM) amounts of Co. Results from the current study support that the 314
recent EU restriction on the amount of supplementary Co that can be added to the diet 315
should not impair dairy cow performance or health. There may, however, be some 316
value to higher dietary levels of Co, or rumen protected vitamin B12 to increase the
317
vitamin B12 content in milk for human consumption as suggested by Girard and Matte
318
(2005b), particularly in situations where foods are fortified with folic acid. 319
Regulation of lipogenesis and lipolysis in the transition period involves a 320
complex interaction between neural, hormonal and paracrine stimuli, along with 321
immune cell migration that changes the structure and cellular distribution of adipose 322
tissue (Contreras et al., 2017). In the current study, both live weight and body condition
323
score were characterised by an increase pre-partum, followed by a rapid decline post-324
partum, reaching a nadir at approximately 4 weeks post-calving. This rapid decline in 325
body condition and live weight is greater than that reported in other studies that have 326
investigated the effect of diet on body energy reserves where the nadir in energy 327
balance is typically not reached until approximately week 8 to 10 post-partum 328
(Duplessis et al., 2017). Parenteral administration of vitamin B12 resulted in the lowest
329
mean BCS post-partum, but this was not reflected in an increase in milk or milk fat 330
yield. Duplessis et al. (2017) reported no benefit to injections of vitamin B12 on body
331
condition over the transition period, although dietary levels of Co (1.45 and 1.05 mg/kg 332
DM for the dry period and lactation respectively) were substantially higher than that 333
used here. 334
Cows fed any of the dietary treatments in the current study continued to 335
increase their DM intake throughout the first 8 weeks of lactation, but there was no 336
effect of dietary Co level or vitamin B12 on intake. Several other studies have also failed
337
to demonstrate a benefit to Co supplementation or parenteral administration of vitamin 338
B12 on DM intake either pre-partum or during lactation (Akins et al., 2013; Girard and
Matte, 2005a). Indeed, supra-nutritional levels of Co have been demonstrated to result 340
in a reduction in DM intake in some studies, particularly in early lactation (Kincaid and 341
Socha, 2007). 342
Blood metabolites, minerals and hepatic triacylglycerol content
343
Poor adaptation to negative energy balance through the transition period is associated 344
with an elevation in plasma NEFA and 3-OHB concentrations (McArt et al., 2013).
345
Whilst there is much debate regarding definitive cut-point concentrations of these 346
metabolites for milk production and disease outcomes, NEFA values of 0.3 to 0.5 347
mmol/l pre-partum and 0.7 to 1.0 mmol/l post partum, and 3-OHB concentrations of 348
1.2 mmol/l, have been suggested as a good combination between sensitivity and 349
specificity (McArt et al., 2013). Based on these assumptions, mean plasma NEFA in
350
the current study were high at drying off and again at calving, whereas mean plasma 351
3-OHB concentrations were always well within accepted limits. Plasma glucose 352
concentrations were also affected by day of sampling in the current study, decreasing 353
sharply at 2 weeks post-calving before returning to pre-partum levels by week 4. There 354
was, however, no effect of dietary treatment on any of these metabolites pre or post-355
partum, and it is apparent that vitamin B12 was not limiting for cows. A number of other
356
studies have also reported no effect of dietary Co level (Akins et al., 2013; Kincaid and
357
Socha, 2007), dietary supplementation with vitamin B12 (Graulet et al., 2007) or
358
following parenteral administration of vitamin B12 (Akins et al., 2013; Duplessis et al.,
359
2017) on serum NEFA concentration. 360
A threshold for plasma vitamin B12 of 150 µmol/l has been suggested, above
361
which there is little further benefit to milk performance in dairy cows (Duplessis et al.,
362
2017). Plasma vitamin B12 in the current study was above this threshold in cows fed
363
any of the dietary treatments, and were approximately 28% higher in cows receiving 364
weekly injections of vitamin B12. The high demands for metabolism and secretion into
milk (Kincaid and Socha 2007) may predispose higher yielding dairy cows to vitamin 366
B12 deficiency and can be exhibited in an increase in plasma concentrations of key
367
intermediaries in energy and amino acid metabolism. The dependency of methionine
368
synthase and methylmalonyl-CoA mutase on vitamin B12 results in plasma
369
concentrations of homocysteine and MMA acid being good indicators of vitamin B12
370
adequacy (Stangl et al., 2000). These authors reported a significant decline in both
371
plasma homocysteine and MMA when dietary Co concentrations were increased 372
above 0.2 mg/kg DM in growing beef cattle. However, in the current study there was 373
little effect of supplementary Co, vitamin B12 or parental administration of vitamin B12,
374
and supports the performance and blood metabolite results that the basal dietary Co 375
concentration of 0.21 mg/kg DM was sufficient to meet requirements in late pregnancy 376
and early lactation. Despite the lack of an effect of treatment on hepatic TAG 377
concentrations in the current study there was a 3-fold increase in concentration post- 378
compared to pre-partum (mean values of 19 and 6 mg/g liver respectively), although 379
mean values were still within the 1-5% liver TAG concentration that is associated with 380
mild fatty liver (Bobe et al., 2004).
381
Whole tract digestibility
382
In addition to the requirement for the metabolism of glucose and methionine in the 383
dairy cow, vitamin B12 has been demonstrated to be an essential growth factor for
384
efficient rumen microbial metabolism, with ruminal synthesis of vitamin B12 and
385
subsequent flow to the duodenum being significantly related to the rate of microbial 386
protein synthesis in the rumen (Castagnino et al., 2016). This has been suggested to
387
improve fibre digestion in the rumen (Lopez Guisa and Satter, 1992), and increase the 388
ruminal production of propionate in some studies (Tiffany et al., 2003), but not others
389
(Stemme et al., 2008). Increasing dietary Co concentration from sub-optimal levels
390
highest at a dietary level of 0.6 mg/kg DM (Wang et al., 2007). Similarly, Kadim et al.
392
(2003) reported that the parental provision of vitamin B12 increased diet digestibility in
393
goats, which was speculated to be due to an increase in intestinal absorption of 394
nutrients or microbial production in the rumen. In the current study digestibility co-395
efficients for DM, N, OM and fibre fractions were similar to that reported by others 396
when feeding similar diets (Sinclair et al., 2015), but there was no effect of dietary
397
treatment, and it can be concluded that there was sufficient vitamin B12 available for
398
ruminal metabolism. 399
Milk fatty acids
400
The concentration of saturated FA in milk may be reduced via the action of steroyl-401
CoA desaturase (SCD) on both de novo and absorbed FA such as C14:0, C16:0 and
402
C18:0, and is responsible for the majority of the cis-9, trans-11 CLA from its action on
403
C18:1 trans-11 (Shingfield et al., 2013). Several studies have investigated the impact
404
of the dietary inclusion, ruminal infusion or intravenous injection of Co on SCD activity, 405
and reported a dose dependent decrease in activity by up to 72% (Leskinen et al.,
406
2016). Infusing Co does not impact on gene expression of SCD, and its effects would 407
therefore appear to be at a post-transcriptional level (Karlengen et al., 2012). However,
408
in previous studies that have reported a reduction in SCD activity supra-nutritional 409
levels of Co have been fed. For example, Karlengen et al. (2012) reported no effect
410
on the milk desaturase index in cows when fed approximately 0.2 or 19 mg Co/kg DM, 411
but it was reduced when 270 mg/kg DM was infused into the rumen. In the current 412
study, there was little evidence of an effect of adding approximately 0.2 mg Co/kg DM, 413
or additional vitamin B12 administered per os, on SCD activity. In contrast, SCD activity
414
was reduced when supra-nutritional levels of vitamin B12 were injected, although few
415
other studies have examined the effect of vitamin B12 on the activity of this enzyme.
Conclusions 418
A dietary Co concentration of 0.21 mg/kg DM provides sufficient Co for the synthesis 419
of vitamin B12 required for the metabolism, performance and diet digestibility of
high-420
yielding dairy cows. Recent restrictions on the inclusion of Co in the diet in the 421
European Union are therefore unlikely to have an impact on intake, performance or 422
health over the periparturient period, and there is little justification for the use of 423
supplementary sources of vitamin B12.
424 425
Acknowledgements
426The authors would like to acknowledge the input of Jess Marshall, Paul Daley, Rosie 427
Barraclough and Marcus Doig for assistance with collecting and analysing the 428
samples, and to AHDB Dairy for funding the study. WADV Weerathilake was 429
supported by a Commonwealth Studentship, and AH Brassington by a scholarship 430
from The Perry Foundation. 431
432
Declaration of interest
433None 434
435
Ethics Statement 436
The procedures involving animals were conducted in accordance with the UK Animals 437
(Scientific Procedures) Act 1986 (amended 2012), and were approved by the Harper 438
Adams University Local Ethical Review. 439
440
Software and data repository resources 441
None. 442
References
444Akins MS, Bertics SJ, Socha MT and Shaver RD 2013. Effects of cobalt supplementation 445
and vitamin B12 injections on lactation performance and metabolism of Holstein dairy cows. 446
Journal of Dairy Science 96, 1755-1768. 447
Association of Analytical Chemists (AOAC) 2012.Official methods of analysis, volume 1, 448
19th edition, AOAC, Arlington, VA, USA. 449
Bobe G, Young JW and Beitz DC 2004. Invited review: pathology, etiology, prevention, and 450
treatment of fatty liver in dairy cows. Journal of Dairy Science 87, 3105-3124. 451
Castagnino DS, Seck M, Beaudet V, Kammes KL, Voelker Linton JA, Allen MS, Gervais R, 452
Chouinard PY and Girard CL 2016. Effects of forage family on apparent ruminal synthesis of 453
B vitamins in lactating dairy cows. Journal of Dairy Science 99, 1884-1894. 454
Contreras GA, Strieder-Barboza C and Raphael W 2017. Adipose tissue lipolysis and 455
remodelling during the transition period of dairy cows. Journal of Animal Science and 456
Biotechnology 8, 41. 457
Cope CM, Mackenzie AM, Wilde D and Sinclair LA 2009. Effects of level and form of dietary 458
zinc on dairy cow performance and health. Journal of Dairy Science 92, 2128-2135. 459
Duplessis M, Lapierre H, Pellerin D, Laforest JP and Girard CL 2017. Effects of intramuscular 460
injections of folic acid, vitamin B12, or both, on lactational performance and energy status of 461
multiparous dairy cows. Journal of Dairy Science100, 4051-4064. 462
Ferguson JD, Galligan DT, and Thomsen N 1994. Principal descriptors of body condition score 463
in Holstein cows. Journal of Dairy Science 77, 2695-2703. 464
Girard CL, Santschi DE, Stabler SP and Allen RH 2009. Apparent ruminal synthesis and 465
intestinal disappearance of vitamin B12 and its analogs in dairy cows. Journal of Dairy Science 466
Girard CL and Matte JJ 2005a. Effects of intramuscular injections of vitamin B12 on lactation 468
performance of dairy cows fed dietary supplements of folic acid and rumen-protected 469
methionine. Journal of Dairy Science 88, 671-676. 470
Girard Cl and Matte JJ 2005b. Folic acid and vitamin B12 requirements of dairy cows: A concept 471
to be revised. Livestock Production Science 98, 123-133. 472
Graulet B, Matte JJ, Desrochers A, Doepel L, Palin MF and Girard CL 2007. Effects of dietary 473
supplements of folic acid and vitamin B12 on metabolism of dairy cows in early lactation. 474
Journal of Dairy Science 90, 3442-3455. 475
Juchem SO, Robinson PH and Evans E 2012. A fat based rumen protection technology post-476
ruminally delivers a B vitamin complex to impact performance of multiparous Holstein cows. 477
Animal Feed Science and Technology 174, 68-78. 478
Kadim IT, Johnson EH, Mahgoub O, Srikandakumar A, Al-Ajmi D, Ritchie A, Annamalai K and 479
Al-Halhali AS 2003. Effect of low levels of dietary cobalt on apparent nutrient digestibility in 480
Omani goats. Animal Feed Science and Technology 109, 209-216. 481
Kanakkaparambil R, Singh R, Li D, Webb R and Sinclair KD 2009. B-vitamin and 482
homocysteine status determines ovarian response to gonadotrophin treatment in sheep. 483
Biology of Reproduction 80, 743-752. 484
Karlengen IJ, Harstad OM, Taugbøl O, Berget I, Aastveit AH and Våge DI 2012. The effect 485
of excess cobalt on milk fatty acid profiles and transcriptional regulation of SCD, FASN, 486
DGAT1 and DGAT2 in the mammary gland of lactating dairy cows. Journal of Animal 487
Physiology and Animal Nutrition. 96 1065-1073. 488
Kincaid RL and Socha MT 2007. Effect of cobalt supplementation during late gestation and 489
Lean IJ, Van Saun R and DeGaris PJ 2013. Energy and protein nutrition management of 491
transition dairy cows. Veterinary Clinics Food Animal Practice 29, 337–366. 492
Leskinen H, Viitala S, Mutikainen M, Kairenius Piia, Tapio I, Taponen J, Bernard L, Vilkki J 493
and Shingfield KJ 2016. Ruminal infusions of cobalt EDTA modify milk fatty acid composition 494
via decreases in fatty acid desaturation and altered gene expression in the mammary gland 495
of lactating cows. Journal of Nutrition 146, 976-985. 496
Lopez-Guisa JM and Satter LD 1992. Effect of copper and cobalt addition on digestion and 497
growth in heifers fed diets containing alfalfa silage or corn crop residues. Journal of Dairy 498
Science 75, 247-256. 499
McArt JAA, Nydam DV and Oetzel GR 2012. Epidemiology of subclinical ketosis in early 500
lactation dairy cattle. Journal of Dairy Science 95, 5056-5066. 501
McArt JAA, Nydam DV, Oetzel GR, Overton TR and Ospina PA 2013. Elevated non-esterified 502
fatty acids and ß-hydroxybutyrate and their association with transition dairy cow performance. 503
The Veterinary Journal 198, 560-570. 504
McDowell LR 2000. Vitamins in animal and human nutrition, 2nd edition. Iowa State University 505
Press, Ames, IA, USA. 506
National Research Council (NRC) 2001. Nutrient requirements of dairy cattle. 7th revised 507
edition. National Academy Press. 508
Preynat A, Lapierre H, Thivierge MC, Palin MF, Matte JJ Desrochers A and Girard CL 2009. 509
Effects of supplements of folic acid, vitamin B12, and rumen-protected methionine on whole 510
body metabolism of methionine and glucose in lactating cows. Journal of Dairy Science 92, 511
Raboisson D, Mounié M and Maigné E 2014. Diseases, reproductive performance, and 513
changes in milk production associated with subclinical ketosis in dairy cows: A meta-analysis 514
and review. Journal of Dairy Science 97, 7547-7563. 515
Shingfield KJ, Arölä A, Ahenjärvi S, Vanhatalo A, Toivonen V, Griinari JM and Huhtanen P 516
2013. Ruminal infusions of cobalt-EDTA reduce mammary ∆9-desturase index and later milk 517
fatty acid composition in lactating dairy cows. The Journal of Nutrition 138, 710-717. 518
Sinclair LA, Edwards R, Errington KA, Holdcroft AM and Wright M 2015. Replacement of 519
grass and maize silages with lucerne silage: effects on performance, milk fatty acid profile 520
and digestibility in Holstein-Friesian dairy cows. Animal 9: 1970-1978. 521
Stangl GJ, Schwarz FJ, Müller H and Kirchgessner M 2000. Evaluation of the cobalt 522
requirement of beef cattle based on vitamin B12, folate, homocysteine and methylmalonic 523
acid. British Journal of Nutrition 84, 645-653. 524
Stemme K, Lebzien P, Flachowsky G and Scholz H 2008. The influence of an 525
increased cobalt supply on ruminal parameters and microbial vitamin B12 synthesis in 526
the rumen of dairy cows. Archives of Animal Nutrition 62, 207-218. 527
Suthar VS, Canelas-Raposo J, Deniz A and Heuwieser W 2013. Prevelance of subclinical 528
ketosis and relationships with postpartum diseases in European dairy cows. Journal of Dairy 529
Science 96, 2925-2938. 530
Tiffany ME, Spears JW, Xi L and Horton J 2003. Influence of supplemental cobalt source 531
and concentration on performance, vitamin B12 status, and ruminal and plasma metabolites 532
in growing and finishing steers. Journal of Animal Science 81, 3151-3159. 533
Tiffany ME, Fellner V and Spears JW 2006. Influence of cobalt concentration on vitamin B12 534
production and fermentation of mixed ruminal microorganisms grown in continuous culture 535
Van Keulen J and Young BA 1977. Evaluation of acid-insoluble ash as a natural marker in 537
ruminant digestibility studies. Journal of Animal Science 44, 282-287. 538
Van Soest PJ, Robertson JB and Lewis BA 1991. Methods for dietary fiber, neutral detergent 539
fiber, and nonstarch polysaccharides in relation to animal nutrition. Journal of Dairy Science 540
74, 3583-3597. 541
Wang RL, Hong XH, Zhang YZ, Zhu XP, Narenbatu and Jia ZH 2007. Influence of dietary 542
cobalt on performance, nutrient digestibility and plasma metabolites in lambs. Animal Feed 543
Table 1 Basal dry cow and lactation total mixed ration composition
Dry cow1 Lactation
Ingredient, g/kg DM
Chopped wheat straw 471 ---
Maize silage 218 389
Lucerne silage 87 111
Wheat 109 79
Molassed sugar beet feed --- 79
Soy hulls --- 66
Molasses 3 7
Protected fat --- 16
Rapeseed meal 31 91
Corn gluten feed 26 76
Hipro soybean meal 19 55
Palm kernel meal 9 25
Feed grade urea 10 1
Dry cow minerals2 13 ---
Lactation minerals3 --- 5
Magnesium chloride 4 ---
1Water was added at 0.43 kg/kg DM
2Dry cow minerals g/kg: Ca 20; P 60; Mg 200; Na 5; mg/kg I 400; Se 30; Cu 750; Mn 4 000; Zn 6 000; iu/kg Vit A 800 000; Vit D 200 000; Vit E 10 000; Biotin 75 mg/kg.
Table 2 Chemical and mineral composition of dry cow and lactation diets that contained no added cobalt (C), added dietary Co (DC), added dietary vitamin B12 (DB) or injected vitamin B12(IB)
Nutrient Dry cow1 C and IB DC DB
DM, g/kg 474 471 466 468
Organic matter, g/kg DM 932 941 939 937
Ash, g/kg DM 67.8 59.2 60.9 63.1
CP, g/kg DM 139 168 169 165
NDF, g/kg DM 561 364 359 386
ADF, g/kg DM 359 230 226 238
Hemicellulose, g/kg DM 202 134 133 148
Fat, g/kg DM 16.7 33.5 34.4 31.7
Fatty acids, g/100 g FA
C16:0 25.1 25.9 24.1 25.9
C18:0 nd2 2.10 1.99 2.10
C18:2 cis-9, cis-12 28.5 27.5 27.1 27.5
C18:3 cis-9, cis-12, cis-15 3.15 2.69 2.44 2.69
Macro minerals, g/kg DM
Ca 5.82 7.84 7.71 7.87
P 2.92 4.03 4.15 4.05
Mg 4.25 2.69 2.71 2.74
Na 1.32 1.66 1.66 1.66
K 12.8 15.7 15.8 15.9
S 1.77 2.50 2.50 2.32
Micro minerals, mg/kg DM
Co 0.21 0.21 0.36 0.23
Mn 76.0 58.9 57.2 59.4
Fe 279 281 274 285
Zn 102 67.1 64.0 65.6
Mo 1.34 1.16 1.20 1.48
1Dry cow treatments achieved by individually providing either no added Co (C), 0.2 mg Co/kg DM (DC), 0.68 mg vitamin B12/kg DM (DB) or injected vitamin B12 (IB).
Table 3 Intake (post calving), milk performance and body condition (mean value pre- and post-calving) of dairy cows offered diets that contained no added cobalt (C), added dietary Co (DC), added dietary vitamin B12(DB) or injected vitamin B12(IB)
Treatment P-value1
C DC DB IB SED Treatment Time
DM intake (kg/day) 21.5 21.3 21.7 21.8 0.78 0.918 <0.001 Milk yield (kg/day) 38.3 39.5 40.8 39.6 1.58 0.480 <0.001
Milk fat (g/kg) 40.6 40.8 40.6 39.6 1.92 0.922 <0.001
Milk protein (g/kg) 32.9 33.2 33.3 33.1 0.67 0.936 <0.001 Milk lactose (g/kg) 45.0 45.0 45.4 45.0 0.37 0.668 <0.001
Milk fat (kg/d) 1.54 1.59 1.63 1.55 0.921 0.715 0.035
Milk protein (kg/d) 1.24 1.28 1.34 1.30 0.046 0.235 <0.001 Milk lactose (kg/d) 1.72 1.75 1.86 1.79 0.073 0.256 <0.001
SCC (log10/ml)2 1.74 1.59 1.67 1.83 0.152 0.452 <0.001
Body condition 3.00ab 3.08ab 3.14b 2.94a 0.069 0.042 <0.001
Live weight (kg) 665 657 683 651 22.0 0.504 <0.001
1There were no (P>0.05) Treatment x Time interactions 2Scc = somatic cell count
Table 4 Mean plasma metabolite and mineral concentration, and hepatic triacylglycerol concentrations in dairy cows offered diets that contained no added cobalt (C), added dietary Co (DC), added dietary vitamin B12 (DB) or injected vitamin B12 (IB)
Treatment P-value1
C DC DB IB SED Treatment Time
Metabolites2
Glucose (mmol/l) 3.52 3.39 3.48 3.54 0.107 0.480 <0.001
3-OHB (mmol/l) 0.48 0.52 0.51 0.51 0.030 0.598 <0.001
NEFA (mmol/l) 0.40 0.40 0.41 0.44 0.054 0.848 <0.001
Urea (mmol/l) 4.36 4.24 4.29 4.27 0.214 0.953 <0.001
Minerals
P (mmol/l) 3.01 3.18 3.19 3.19 0.141 0.519 <0.001
Mg (mmol/l) 0.86 0.79 0.90 0.73 0.133 0.582 0.611
Fe (µmol/l) 37.5 35.9 39.7 36.8 2.05 0.294 <0.001
Zn (µmol/l) 12.4ab 13.5b 12.8ab 11.6a 0.59 0.023 <0.001
Cu (µmol/l) 14.5 15.1 14.9 15.0 0.70 0.863 <0.001
Co (µmol/l2) 0.014 ±0.0022
0.018 ±0.0022
0.015 ±0.0022
0.019 ±0.0022
<0.001 0.045
Se (µmol/l) 1.04 1.03 1.04 1.04 0.031 0.965 <0.001
Mo (µmol/l) 0.25 0.23 0.24 0.25 0.025 0.817 <0.001
Hepatic triacylglycerol, mg/g fresh3
Pre-partum 5.81
±2.349
5.85 ±2.349
5.56 ±2.349
7.23 ±2.349
0.616 --
Post-partum 16.1
±2.651
18.4 ±2.651
22.0 ±2.651
19.3 ±2.651
0.862 --
1There were no (P>0.05) Treatment x Time interactions
23-OHB = ß-hydroxybutyrate, NEFA = non-esterified fatty acids
Table 5 Diet digestibility (kg/kg) of DM, organic matter (OM), nitrogen (N) and fibre in dairy cows offered diets that contained no added cobalt (C), added dietary Co (DC), added dietary vitamin B12 (DB) or injected vitamin B12 (IB)
Treatment
C DC DB IB SED P-value
DM 0.71 0.72 0.73 0.73 0.016 0.630
OM 0.73 0.74 0.74 0.75 0.015 0.631
N 0.66 0.67 0.66 0.69 0.019 0.240
NDF 0.54 0.53 0.58 0.56 0.029 0.257
ADF 0.45 0.45 0.50 0.48 0.031 0.234
Hemicellulose1 0.68 0.65 0.73 0.70 0.031 0.136
Table 6 Milk fatty acid profile during week 7 of lactation in dairy cows offered diets that contained no added cobalt (C), added dietary Co (DC), added dietary vitamin B12 (DB)
or injected vitamin B12 (IB)
C DC DB IB SED P-value
Fatty acid (g/100g)
C4:0 4.87 4.78 4.94 4.42 0.322 0.401
C6:0 2.77 2.66 2.62 2.67 0.099 0.356
C8:0 1.56 1.33 1.34 1.60 0.124 0.066
C10:0 3.27 3.01 2.64 3.22 0.170 0.164
C12:0 3.68 3.44 3.32 3.62 0.190 0.242
C14:0 10.7 10.4 10.1 10.6 0.353 0.366
C14:1 cis-9 0.87 0.94 0.89 0.90 0.079 0.817
C15:0 0.99ab 0.93a 0.94ab 1.09b 0.056 0.025
C16:0 27.5 27.6 27.1 27.9 0.671 0.651
C16:1 cis-9 1.42 1.61 1.58 1.50 0.121 0.383
C17:0 0.53 0.55 0.51 0.58 0.028 0.150
C18:0 7.83 7.96 7.57 7.40 0.352 0.393
C18:1 trans 6 to 8 0.40 0.41 0.39 0.38 0.047 0.936
C18:1 trans-9 0.30 0.36 0.35 0.31 0.057 0.692
C18:1 trans-10 0.61 0.54 0.67 0.73 0.104 0.323
C18:1 trans-11 0.61 0.66 0.66 0.91 0.116 0.061
C18:1 trans-12 0.53 0.60 0.66 0.48 0.091 0.222
C18:1 cis-9 18.3 18.8 18.5 17.3 0.926 0.447
C18:2 cis-9, cis-12 2.53 2.41 2.40 2.48 0.124 0.686
C18:2 cis-9, trans-11 0.56 0.62 0.56 0.56 0.069 0.769
C18:2 trans-10, cis-12 0.03 0.05 0.05 0.05 0.008 0.221
C18:3 cis-9, cis-12, cis-15 0.06 0.10 0.10 0.12 0.036 0.383
C20:0 0.07 0.06 0.06 0.07 0.006 0.801
C20:1 cis-9 0.35 0.31 0.30 0.35 0.038 0.428
C20:5 n-3 0.05 0.05 0.06 0.05 0.008 0.647
C22:6 n-3 0.06 0.08 0.08 0.08 0.014 0.259
Other 9.64 9.69 11.37 10.65 1.528 0.625
Summation
Saturated 64.0 62.9 61.7 63.4 1.37 0.386
Monounsaturated 23.4 24.3 24.0 22.9 1.07 0.579
Polyunsaturated 3.30 3.32 3.30 3.37 0.181 0.984
<16 28.8 27.6 27.2 28.3 0.88 0.284
16:0 and 16:1 29.0 29.4 28.8 29.5 0.70 0.693
>16 32.9 33.6 33.0 31.9 1.33 0.651
Desaturase index
14:1/(14:0+14:1) 0.07 0.08 0.08 0.08 0.005 0.475
16:1/(16:0+16:1) 0.05 0.06 0.06 0.05 0.004 0.264
18:1/(18:0+18:1) 0.70 0.70 0.71 0.70 0.010 0.861
c-9, t-11 CLA/( 18:1 t-11+
c-9, t-11 CLA1 0.50
b 0.51b 0.47ab 0.40a 0.033 0.006 1CLA = conjugated linoleic acid.
Supplementary Material S1
Added dietary cobalt or vitamin B
12, or injecting vitamin B
12does not
improve performance or indicators of ketosis in pre- and
post-partum Holstein-Friesian dairy cows
W.A.D.V. Weerathilake1*, A.H. Brassington2, S.J. Williams1, W.Y. Kwong2, L.A.
Sinclair1† and K.D. Sinclair2
Animal Journal
Plasma vitamin B12 analysis was conducted using the ADIVA Centaur CP VB12 assay
at the AHVLA laboratory, Shrewsbury, Shropshire, UK. The limit of detection was 33
pmol/l, and coefficients of variation (CVs) for low, medium and high quality controls
were 12.2, 12.4 and 12.4% respectively. Plasma homocysteine (Hcy) was determined
using an Imola Auto analyser (RX imola; Randox Laboratories Ltd., Antrim, U.K.) using
a kit supplied by Randox Laboratories (catalogue no. HY4036). The limit of detection
was 1.74 µM and CV’s for low, medium and high quality controls were 1.03, 0.83 and
0.95% respectively.
Plasma methylmalonic acid (MMA) and succinic acid (SA) concentrations were
determined by GC with mass spectroscopic detection (GC-MS) following derivatisation
and extraction, modified from the method of Kanakkarambil et al. (2009). Briefly, 50
µl of plasma and 5 ul of internal standard (4-chlorobutyric acid (CBA) 250 µM) were
added to 250 µl 12% BF3-methanol in a 2.5 ml screw capped glass vial, vortexed for
30 s and heated at 95°C for 15 minutes on a heating block. After cooling, 250 µl
for 30 s. The mixture was then centrifuged for 8 minutes at 2500 g at 4°C to separate
the layers. The lower dichloromethane layer was transferred to a screw capped
auto-sampler vial with insert for GC-MS analysis. The method used a DB-WAX (crosslinked
polyethylene glycol; J&W Scientific Agilent technology) 30 m long column of 0.25mm
i.d and 0.15 µm film thickness. The carrier gas was He and flow rate was 1.0 ml/min.
Injection mode was splitless and volume was 1 µl for both SCAN mode, for
qualification, and SIM mode, for quantification. Injection port temperature was 260°C.
The MS selective detector interference temperature was 280°C. The chromatograph
was programmed for an initial temperature of 50C for 2 minutes, increased to 150C
at 8C per minute, then increased to 220C at 100C per minute and held for 5 minutes
at the final temperature. The MS was operated in electron impact (EI) ionization mode
with the ionization energy of 70eV. SCAN mode measured at m/z: 20-500 and SIM
(selected ion-monitoring) ions were set at 105 (for CBA), 115 (for MMA and SA). The
same method was used for standards of MMA and SA at concentrations 0.156, 0.313,
0.625, 1.25, 2.5, 5, 10 and 20 µmol/l. Calibration was carried out by comparison of
peak areas of CBA with MMA and SA in the standards and the final results expressed
in µmol/l plasma. The limit of detection and limit of quantification was 0.156 µmol/l.
The CV’s for low, medium and high quality controls were 0.44, 1.03, 0.83% for MMA
and 1.2, 1.1 and 2.3% for SA respectively.
For hepatic triacylglycerol (TAG) analyses, samples were reduced to powder
under liquid N, and known amounts (around 90-120 mg) weighed and homogenised
in 1.6 ml of 0.47 M sodium sulphate, followed by the addition of 2 ml of 0.47 M sodium
sulphate and 5.4 ml hexane:isopropanol (3:2, v/v). The mixtures were vortexed for 30
s and centrifuged at 2000 g for 5 minutes at room temperature, then 2.5 ml of the top
reconstituted in 1 ml of hexane and 10 or 60 µl transferred to a second tube and dried
under nitrogen. Dried samples were then re-suspended in 120 µl of isopropanol and
50 µl was mixed with 250 µl of colour reagent from Wako LabAssay triglyceride kit
(Catalogue No. 290-63701; Alpha Laboratories, Hampshire, UK) for triacylglycerol
measurement. Different concentrations of triolein standard (Catalogue No. T7140,
Sigma-Aldrich, Gillingham, UK) were processed in parallel with liver samples to
generate a standard curve. Different concentrations of glycerol and non-extracted
triolein were included in each plate to monitor enzyme activity and completeness of
lipolysis by lipoprotein lipase. In addition, a single liver analysed in each plate served
Supplementary Figure 1 Plasma glucose (a), ß-hydroxybutyrate (3-OHB) (b), non esterified fatty acids (NEFA) (c) and urea (d) in pre- and post-partum of dairy cows offered diets that contained no added cobalt (Co) (C: ), added dietary Co (DC: ●), added dietary B12 (DB: ○) or injected B12 (IB: ).
mm
ol
/L
mm
ol
/L
mm
ol
/L
mm
ol
pm
ol
/ L
0 2 4 6 8 10
µm
ol
/ L
-8 -2 0 2 4 8
(b) Hcy
0.0 0.1 0.2 0.3 0.4 0.5
-2 0 2 4 8
(c) MMA
-8
0 2 4 6 8
Week relative to calving
-2 0 2 4 8
(d) SA