Jin Xu
a,b, Qi Zhou
a,*a School of Information Engineering, China University of Geosciences, Lumo Road 388, Wuhan, P.R. China
b Department of Geography and Urban Studies, Temple University,1115 W. Berks Street, 309 Gladfelter Hall, Philadelphia, PA 19122, United States
* Corresponding author
Abstract: Volunteered Geographic Information (VGI) crowdsourced from volunteering posts, is closely related to contributors’ mapping behavior. As the most noticeable VGI source, OpenStreetMap (OSM) is one of the most studied objectives in VGI and data contributors. In this paper, temporal-spatial analysis is applied in seeking the temporal and spatial patterns of the number of buildings and contributors in Beijing, China. Temporal changes of the number of updated buildings, and the population of total, new and quitted contributors, were interpreted, as well as the spatial distribution of updated buildings, participated contributors, and frequency of updates. The result suggests that the number of updated buildings, participated contributors, new and quitted contributors are growing. Buildings are mostly updated by a small number of contributors, the majority of which did not participated in mapping in the previous year. Most contributors update buildings for one year without succeeding till the next. Contributors are interested in updating a large amount of buildings frequently around landmarks, commercial districts, universities, and transit hubs. They update buildings at an expanding range and an increasing density, but their attentions do not necessarily bring large quantity of building updates. In general, OSM buildings in developing regions with less complete database are updated under similar patterns as developed regions where data are much more complete.
Keywords: OpenStreetMap; Temporal-spatial Analysis; Mapping Behavior; Building Data; Contributors
1. Introduction
The Volunteered Geographic Information (VGI), whose users are also data contributors, is capable of acting as an alternative for authoritative geographic data with its up-to-date database (Fekete, et al., 2015). One of the most discussed VGI projects that are applied in multiple means addition to authoritative data is OpenStreetMap (OSM) (Antoniou, 2017). As OSM is one of the best-known sources of framework geographic data that can be adapted in geographic services (Elwood, et al., 2012), the study of OSM stress its importance in understanding VGI (See, et al., 2016). Since VGI is user-generated, its data quality is closely related to contributors, especially their backgrounds and their interests (Goodchild, 2007). In the case of OSM, contributors and their mapping behaviors are influential to the datasets, resulting in the uneven distribution of data quality in different regions (Girres & Touya, 2010; Zhou, 2018; Husen, et al., 2018; Kounadi, 2009; Yagoub, 2017). Therefore, the analyses for participation of contributors are essential to unraveling how OSM datasets are completed and modified. Temporal-spatial analysis are needed to understand the pattern of contribution on both temporal and spatial scales, in order to gain more knowledge in deducing the possible future of OSM database.
Although many studies concerning the population, component, and motive of contributors were conducted through the analysis of OSM data they updated, they were mostly conducted in developed regions with completed OSM datasets, while studies concerning other regions where the completing of datasets are still undergoing (Tian, et al., 2019) were less focused. In lacking the voluntarily contributed data, authoritative data are heavily depended, thus little can be known for social implications (Elwood, 2010). Meanwhile, indicators for OSM data usually focus on roads rather than buildings, while both of them enjoy similar priority in contributors’ mapping activities (Imi, et al., 2012).
participated contributors, and update frequencies. This method was employed in both the analysis for general patterns as well as annual differences.
Beginning with a brief introduction of related work in contributors’ mapping behavior, the next section will draw forth the objective. Research design will be expounded in section 3, and results of temporal-spatial analysis will be shown in section 4. Conclusions and discussions will be stated in section 5.
2. Related Works
Current studies concerning OSM contributors’ mapping behavior are mainly conducted through analyzing the temporal changes and spatial distributions of contributors, their participations, and data they updated, as well as how the quantity and quality of data are influenced by the number of contributors, their motives, and their components. OSM data analyzed in these studies mainly focuses on OSM data in Europe, where OSM datasets are updated frequently by a large number of active contributors.
Studies of contributors’ mapping behavior from the temporal scale were conducted through the analysis of the number of contributors and the data they updated. In general, the number of registered OSM contributors is growing in exponent (Haklay & Weber, 2008). Their time for participation in general is also changing. Contributors’ mapping activities recently shifted from afternoon to evening (Yasseri & Quattrone, 2013). However, their passions for contribution do not last long. Contributors who updated for a long period of time only makes up a small portion among all contributors, while the majority only participated in updating data in a short period of time (Chung, et al., 2015). The analysis of contributors’ lifespan suggests that 79% of contributors are engaged in updating for 0 to 6 months, while only 20% of contributors updated for 6 to 72 months, and 1% for more than 72 months (Bégin, et al., 2018). Meanwhile, events play the role as catalysts for stimulating contributors’ contribution. Natural disasters increase the number of contributors and data they update (Imi, et al., 2012; Xu, et al., 2017).
On the spatial scale, studies were conducted for the distribution of contributor’s location and data they update. The majority of contributors’ update data within ranges of 50 square-kilometers (Neis & Zipf, 2012), and the number of contributors and their participation are uneven distributed (Chuang & Deng, 2013). The uneven updates of data present itself as the differences of contributors’ interests in various types of land-use. Urban regions, transport hubs, recreational zones, commercial districts and forests are more likely to be updated by contributors than other kinds of land-use (Arsanjani, et al., 2015). Meanwhile, roles are played differently by contributors in relation to their locations. During crisis, contributors with great updates are not local to affected regions, while local contributors aim at providing local knowledge (Poiani, et al., 2016), and contributors personalize their mapping activity under different local knowledge (Manrique-Sancho, et al., 2018).
These studies show how contributors’ mapping behaviors change in both temporal and spatial scales, but they do not answer the question of how their contributions are influencing OSM database quality. In response to that, several studies were conducted in the relations among data quality, the number of contributors, and their mapping behaviors. Data quality are generally higher if the number of contributors over one square-kilometer exceeded the number of 15, and data quality of the first 5 contributors are most important to general data quality (Haklay, et al., 2010). Contributors’ activities for updating OSM geometries and descriptions are also analyzed, and it suggests that OSM contributors who update features and those who provide descriptions are both increasing but there is no strong correlation between them (Mooney & Corcoran, 2012). OSM road datasets are influenced by their contributions as contributors’ mapping activities for roads are majorly increasing road density than creating new ones (Corcoran, et al., 2013). Contributors are influencing OSM datasets differently in relation to their participations and locations. Active contributors not only create new features on maps but also modify data updated by non-active contributors (Mooney & Corcoran, 2015). Nodes updated by contributors are generally more complete around their locations (Zielstra & Hochmair, 2014).
The studies concerning the number of contributors suggests that there is a relation between OSM data quality and contributors, but it generalized all participants as a whole, neglecting the differences in mapping behaviors of individual contributors. Hence, some studies focus on the relation between OSM data and the component of contributors. The majority of data are from professionals equipped with mapping skills and GIS backgrounds, and they draw maps with professional software (Yang & Fan, 2016). Data are also biased due to the component of contributors. Descriptions for OSM data are added mainly by male contributors, leading to sexualized biases in data (Stephens, 2013). OSM data quality and local demography are analyzed in some studies, and it suggests that OSM data quality is irrelevant to the component of white, minorities, women, and population with only high school degree (Mullen & Jackson, 2015), but it is positively related to population density, the proportion of young contributors, their education level, and percentage of non-agricultural population (Su & Lei, 2017).
non-active contributors as non-active contributors are more skillful and socially related. Non-active OSM contributors update data for completing maps, while active contributors mapping activities are related to communities, local knowledge, and GIS professions (Budhathoki & Haythornthwaite, 2013). OSM data are also related to the number of participated contributors. Europe, with a large number of contributors, is also updated for massive amount of OSM data (Neis, et al., 2013).
However, current studies concerning OSM contributors’ mapping behaviors mainly focus on OSM data in developed regions where contributors frequently participate in completing OSM datasets, while studies are rarely seen in developing regions with OSM datasets are continuingly. As contributors in developed regions also enjoy more complete OSM datasets (Girres & Touya, 2010), they might also participate in completing OSM datasets with less completeness, leading to different patterns of OSM data updates in less developed regions. Moreover, the quality and completeness of OSM roads are usually taken as indicators in these studies, while buildings, similarly significant in contributors’ mapping activities (Imi, et al., 2012), are less frequently studied.
3. Research Design
3.1 Study Area and Data
Study area was chosen as region enclosed by Beijing 6th Ring Highway, as shown in Figure 1. It covers most of the urban regions, containing the majority of buildings and functional zones in Beijing metropolis. As one of the global cities where capital, commodities, and labor forces are highly globalized (Sassen, 2005), Beijing attracts the attentions of foreign contributors with experiences in updating OSM data and personalized contribution patterns, providing a more complex component of contributors when comparing to other cities in China. Moreover, since OSM dataset in developed regions are more complete and with better quality (Girres & Touya, 2010), Beijing is chosen as it is one of the most developed cities in China, where OSM data are completed with better quality. It is a window to explore the general pattern of contributors’ mapping behavior with a growing trend of OSM data with a better quality. Therefore, it is chosen as the study area for better understanding how OSM dataset were completed in developing region.
Data for experiments includes polygon of the study area, polygon of annual Updated OSM buildings, their unique object IDs and corresponding usernames indicating the contributors making the last updates to this object. As the study area is not an administrative area, the polygon of it was transferred from Beijing 6th Ring road data that were downloaded from OpenStreetMap Data Extracts (http://download.geofabrik.de/index.html), where the latest OSM data were updated daily. Polygons of updated OSM buildings, their object IDs and corresponding usernames, between January 1st, 2008 and December 31st, 2017 were obtained through Overpass API with Overpass QL. The API is developed for extracting OSM
data at a certain place and time using Overpass QL query language (OpenStreetMap, 2019). Updated OSM buildings were exported in GeoJSON formats and transferred into shapefiles. The object IDs of updated buildings and corresponding usernames were saved as csv files that were later joined to the polygon of updated buildings using the object IDs. In doing so, each updated building was assigned a new field in the attribute table, recording the username of the last contributor making changes to it. Since each contributor usually update several buildings, values in username field are repeated.
Figure 1.Study Area
3.2 Methods and Steps
Updated OSM buildings were summarized annually by two groups in temporal analysis. They are contributors as a whole, i.e. all contributors who participated in updating OSM buildings within a year, and active contributors identified with Jiang’s head/tail break (Jiang, 2013). This method proposed in 2013 is an ideal way for classifying long-tail distributed dataset (Jiang, 2013). First, data were calculated for a mean as the first threshold. Data with values exceeding this threshold are classified as the head and data with values smaller than it are classified as the tail. Later, data at the head were calculated for a new mean, creating the second threshold for classifying the head and the tail. These steps are repeated until the head is no longer long-tail distributed (Jiang, 2013).
OSM data updates usually make up long tail distributions (Jiang & Jia, 2011; Lin, 2015). In this case, the classification of active and non-active contributors was achieved through the application of head/tail break method to the number of buildings they updated. Thresholds for classification were only calculated once for each year. They were calculated as the average number of OSM building updated by contributors in that year, i.e. the total number of updated buildings dividing the total number of contributors. Active contributors were identified as those whose building updates locate at the head of long tail distribution, while others are non-active contributors.
number of updated buildings were summarized by contributors’ usernames, and these usernames were also summarized into lists. These steps were to create tables containing the number of buildings updated by each contributor, and contributors’ usernames list in each year. Later on, new and quitted contributors were generated by comparing these username lists, and the results were counted for the number.
Same processes were also applied for temporal changes of OSM updates from active contributors, as classified by head/tail break. The number of updated buildings and number of usernames were extracted from results of previous step using active contributors’ username list. General and annual spatial distribution were analyzed with grids where the numbers of buildings and contributors, together with the frequency of updates were calculated within each cell. These grids were created with the range of the study area, dividing the study area into multiple 1000m×1000m cells. In each cell, the number of updated OSM buildings, participated contributors and frequency of updates were calculated based on the spatial relation of updated buildings and grids.
Centroids of building polygons were created in spatial analysis to avoid double counting the number of buildings in each cell, before intersecting with grids for cell ids of location. The attribute table of the results were extracted and summarized by cell ids for the number of building updates and the attached contributors in each cell. These tables containing cell ids and their corresponding quantity of updated buildings and participated contributors were later joined to the original grid files for the analysis of general spatial distributions, where ten years of the annual number of updated buildings, participated contributors, and frequency of updates are summed for each cell. Correlation coefficients were also calculated for the spatial relation between
3.3 Statistical Indicators
Statistical indicators for both temporal and spatial analysis are shown in Table 1. The first 4 statistical indicators in it are all applied in temporal analysis for both active contributors and contributors as a whole. While in spatial analysis, the number of buildings, the number of total contributors, and frequency of updates were calculated in grids for general and annual spatial distribution of updated OSM buildings.
The number of buildings was summarized as the number of records in the attribute table of annual OSM building updates shapefiles. Since each OSM building is identified with their unique object id and recorded as an individual row in attribute tables of annual OSM building updates shapefiles. The number of records in these attribute tables thus represent the number of buildings updated by contributors in each year.
The number of total contributors was summarized as the number of non-repeated usernames representing the last contributors who participated in updating OSM buildings. New and quitted contributors were summarized through comparing the non-repetitive username lists in two
successive years. Contributors with their usernames appearing in the username list of a certain year but not in the previous year were considered as new contributors who newly joined in updating OSM buildings in this year, and vice versa. The numbers of them are recorded annually. Statistical Indicators Expressions and Calculations Explanations Number of
Buildings Q The number of Buildings updated by all contributors. Number of
Total Contributors
N The number of all
contributors who updated data. Number of New Contributors ୍ൌ ሺሻ, I= A-AģB
The number of contributors who updated data in one year but not in the previous year.
A: Contributors in one year; B: Contributors in the previous year. Number of Quitted Contributors ൌ ሺሻ, O=B-AģB
The number of contributors who have not updated data in one year but in the previous year.
A: Contributors in one year; B: Contributors in the previous year.
Frequency
of Updates F The number of years when OSM buildings were updated.
Table 1. Statistical Indicators
Frequency of updates were counted as the number of years when buildings were updated. It is only applied in spatial analysis when illustrating the spatial distribution of how OSM contributors update building. If buildings within one cell of the grid were updated in a certain year, the frequency of update would be added for one.
4. Results
4.1 Temporal Changes for All Contributors
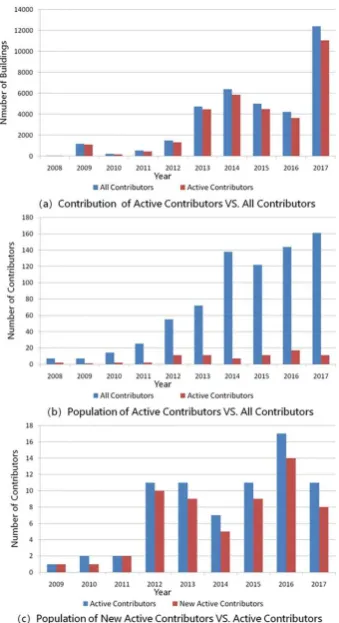
Temporal changes of the number of updated buildings, the number of contributors, and the number of new and quitted contributors were counted by year, the results of which are shown in Figure 2.
In general, the number of updated OSM building is increasing. As it is shown in Figure 2 (a), there are only 52 buildings updated in 2008, while there are 12,399 buildings updated in 2017, which is 237 times more than the former. Although fluctuation is observed, the distribution appears in a growing trend where more buildings are updated in more recent years.
reductions in 2015.The numbers of total, new and quitted contributors have increased 22 to 29 times since 2008. The number of contributors is only 7 in 2009 and 2008, while it is doubled in 2010 tripled in 2011, and 22 times more in 2017.
Figure 2. Temporal Changes of Updates for All Contributors
Most of the contributors only update buildings for one year without continuing till the next year as it is shown in Figure 2 (c). The numbers of quitted contributors in each year are almost equivalent with the numbers of new contributors in the previous year. There are 48 new contributors participated in updating OSM buildings in 2012 and 104 in 2015, while there are also 46 quitted contributors in 2013 and 105 in 2016.
4.2 Temporal Changes for Active Contributors
Temporal changes of the number of updated buildings, total, and new contributors are shown in Figure 3. The majority of updated buildings are provided by active contributors, and there is a growing tendency in it. As shown in Figure 3 (a), active contributors updated 11,052 buildings in 2017, taking up 89% of the total number of all 12,399 buildings updated in that year. They also updated 1310 buildings in 2012 while all contributors updated 1496 buildings, making up 87% of the latter. Meanwhile, active contributors only take up a small proportion of the total contributors, and the number of them keeps growing annually. As it is shown in Figure 3 (b), 2 out of 7 contributors in 2008 are classified as
active, while 11 out of 161 are active in 2017. The number of active contributors remains below 20 throughout the study period
Figure 3. Temporal Changes of Updates for Active Contributors
Moreover, new contributors make up the majority of active contributors. As illustrated in Figure 3 (c) the number of new contributors increased annually with the number of active contributors, and it remains at 71% to 91% of the population of active contributors. In 2012, 10 out of 11 active contributors are new comers, and there is only 1 contributor who participated in updating buildings in the previous year. The number of new contributors rises to 14 in 2016 when the total number of contributors is 17, taking up more than 82% of the latter.
4.3 General Spatial Distributions of Contributors’ Mapping Activities of Buildings
General spatial distributions and statistics of updated buildings participated contributors and frequency of updates are shown in Figure 4.
and Yongdingmen; iii) nearby regions of universities. More specifically, hotspots appear in these locations:
x The Forbidden City and nearby commercial and residential districts, government departments, and tourist attractions
x The commercial and residential districts between Jiangmen and Dongzhimen
x Nearby regions of Peking University and Tsinghua University
x The residential districts near industrial parks in Jiugong and Yizhuang
x Commercial and residential districts between Beijing South Railway Station and Yongdingmen
x Nearby regions of Beijing Jiaotong University
x Wangjing SOHO
Figure 4. General Spatial Distribution of Updated OSM buildings
Buildings are updated majorly near traffic hubs, universities, commercial districts and landmarks within 5th Ring Highway and the southeastern corner between 5th Ring and 6th Ring. Figure 4 (a) and (b) illustrates that the number of buildings appears in a long tail distribution with the maximum value of 504 and a spatial distribution as mentioned. Hotspots are at listed locations, except for Beijing Jiaotong University and Wangjing SOHO. Contributors are attracted by traffic hubs, universities, busy commercial districts and landmarks. Figure 4 (c)
and (d) suggests that the number of contributors has a similar statistical and spatial distribution as the number of updated buildings, with the maximum value of 19 and a long tail distribution. Locations of hotspots are generally consistent with buildings, except for the residential district around industrial parks in Jiugong and Yizhuang. In addition, hotspots also appeared in Beijing Jiaotong University and Wangjing SOHO.
Buildings are most frequently updated in similar locations. Figure 4 (e) and (f) suggests that the frequency of updates show in a long tail distribution with the maximum value of 8, and its hotspots cover all listed locations. Moreover, factories inside the industrial park in Jiugong and Yizhuang are also updated frequently, highlighted as hotspots for frequency of updates.
Meanwhile, differences are also observed in the spatial distributions. Inconsistencies of their hotspots appear in locations near Beijing Jiaotong University, Wangjing SOHO, and the industrial and residential districts in Jiugong and Yizhuang.
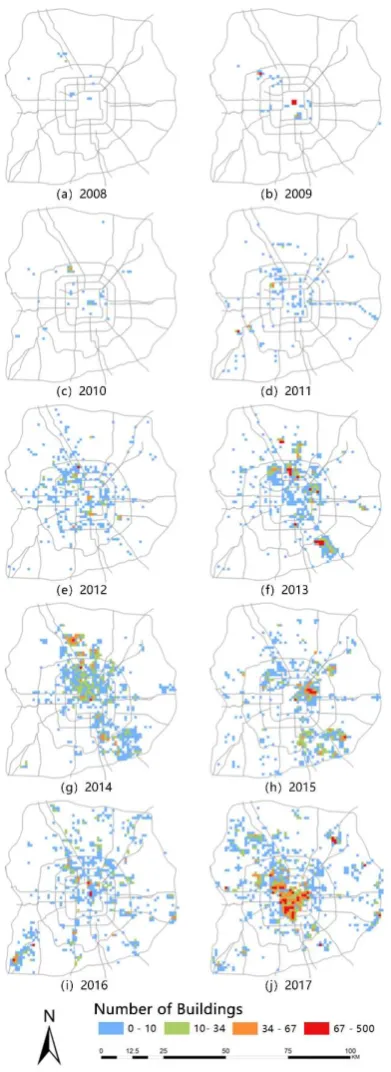
4.4 Annual Spatial Distributions of Contributors’ Mapping Activities of Buildings
Annual spatial distributions of the number of updated buildings and participated contributors are shown separately in Figure 5 and Figure 6. Since the frequency of updates is defined as the number of years when buildings were updated, this statistical indicator is counted as one in all cells when analyzing annually. The range of contributors’ mapping activities for building expands from the center, with an increasing density and number of hotspots. Earliest updates for building appear within the 5th Ring, and the first hotspots of it are observed within the 2nd Ring together with the northwest corner between 4th and 5th Ring. Outside the 5th Ring, updated buildings first appear near primary roads. Participation of contributors shows a similar distribution, but the first hotspots of it appears within the 2nd Ring, as well as the northwest corner between 3rd and 4th Ring Updated buildings mainly scatter in the northwestern region in 2008, while they spread out to the entire 6th Ring in 2011. The number of cells with updated buildings keeps growing afterwards, with an increasing density. Hotspots for the number of buildings and contributors appears in the center city within the 2nd Ring and the northwestern corner of the 5th Ring at the beginning, and the numbers of them keep growing afterwards.
Figure 5. Annual Spatial Distribution of the Number of Building
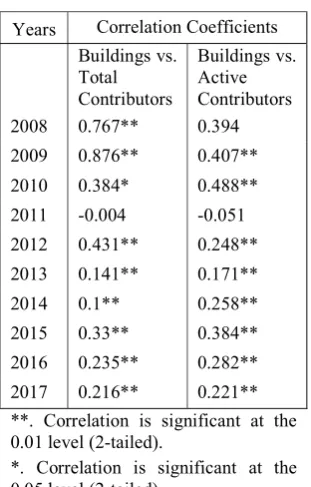
In response to that, Pearson correlation coefficients among buildings, contributors, and active contributors were calculated annually to testify the correlation between the spatial distributions of updated buildings and participated contributors. The result is shown in Table 2
Figure 6. Annual Spatial Distribution of the Number of Contributors
Years Correlation Coefficients
Buildings vs. Total Contributors
Buildings vs. Active Contributors
2008 0.767** 0.394
2009 0.876** 0.407**
2010 0.384* 0.488**
2011 -0.004 -0.051
2012 0.431** 0.248**
2013 0.141** 0.171**
2014 0.1** 0.258**
2015 0.33** 0.384**
2016 0.235** 0.282**
2017 0.216** 0.221**
**. Correlation is significant at the 0.01 level (2-tailed).
*. Correlation is significant at the 0.05 level (2-tailed).
Table 2. Pearson Correlation Coefficient of the Spatial Distribution of Buildings, Contributors, and Active Contributors
Correlation coefficients of the spatial distribution of updated buildings and total contributors exceed 0.4 for only 3 times, with 2 years exceeded the critical value of 0.6. Correlation coefficient in 2011 is not statistically significant. In general, these coefficients are between 0.1 and 0.4, with only 2 exceptions exceeded 0.7.
Meanwhile, correlation coefficients of the spatial distribution of buildings and active contributors are at a similar level. Other than the two values exceeded 0.4 in 2009 and 2010, as well as the two statistically insignificant results in 2008 and 2011, the correlation coefficients are generally below 0.4. These coefficients suggest that the correlation between buildings and active contributors is not strong.
The moderate to week correlation between the spatial distributions of updated buildings and contributors, both active and as a whole explained the phenomena of inconsistency. Although similarity exists between the spatial distribution of updated buildings and participated contributors, buildings at locations attracting most contributors do not necessarily get updated.
5. Conclusions and Discussions
In this paper, temporal-spatial analysis was conducted for seeking the pattern of contributors’ mapping behavior of OSM buildings through the temporal and spatial changes of OSM data. The result suggests that OSM building data in developing regions with less complete database are updated under similar patterns as developed regions where data are much more complete. These patterns of contributors’ mapping behaviors provide additional knowledge on how OSM data were updated outside developed regions, implying that the background and components of contributors could be similar with those who participated in updating OSM data in developed
regions, further providing potential objectives for future studies.
As shown in temporal analysis, i) the number of updated buildings, participated contributors, new and quitted contributors are growing between 2008 and 2017, with 237 times of increase in the number of updated buildings, and 22 to 29 times in the number of all, new and quitted contributors. ii) Data are mostly updated by a small number of contributors, the majority of which did not participated in data contribution in the previous year. iii) Most contributors only updated buildings for one year without continuing updating in the successive year. As illustrated in spatial analysis, i) locations with the greatest number of updated buildings, participated contributors, and frequency of updates are generally around landmarks, commercial districts, universities, and transit hubs, ii) Contributors update buildings at an expanding range in space, with an increasing density. iii) The spatial distributions of updated buildings and participated contributors are correlated at a moderate to weak level, suggesting that the attentions drawn from contributors towards a certain place do not necessarily bring large quantity of building updates to it.
Meanwhile, several shortages in this research can be improved in relative future studies. First, only ten years of data were analyzed at an annual scale in this study, while smaller scales and longer study period for temporal analysis can be applied for more detailed temporal-spatial patterns of data updates. Second, the frequency of updates was calculated as the number of years when buildings were updated by contributors, but a building can be updated for multiple times within a year. An option to consider in better determining frequency of updates is the change of OSM building versions. Third, the analysis focuses on OSM buildings as it is a major feature updated by contributors other than roads, while contributors’ mapping behavior for other features might have different temporal and spatial patterns. Moreover, the analysis of behavior takes contributors as groups, while individual contributors might be unique in mapping behaviors.
6. Acknowledgements
This project was supported by the National Natural Science Foundation of China (Nos. 41771428 and 71874165) and Fundamental Research Funds for the Central Universities, China University of Geosciences (Wuhan).
7. References
Antoniou, V. (2017). Mapping and the Citizen Sensor.
(G. Foody, L. See, S. Fritz, P. Mooney, A.-M. Olteanu-Raimond, & C. Fonte, Eds.) Ubiquity Press.
Arsanjani, J. J., Helbich, M., Bakillah, M., & Loos, L. (2015). The emergence and evolution of OpenStreetMap: A cellular automata approach.
International Journal of Digital Earth.
communities -the case of OpenStreetMap. International Journal of Geographical Information Science, 1, 1-20. Budhathoki, N. R., & Haythornthwaite, C. (2013).
Motivation for open collaboration: Crowd and community models and the case of OpenStreetMap.
American Behavioral Scientist, 59(5), pp. 548-575. Chuang, T.–R., & Deng, D.–P. (2013). The one and many
maps: participatory and temporal diversities in OpenStreetMap. In Proceedings of the Second ACM SIGSPATIAL International Workshop on Crowdsourced and Volunteered Geographic Information (pp. 79-86). ACM.
Chung, T.-Y., Hsu, C.-M., Chuang, K.-T., & Ku, W.-S. (2015). Spatiotemporal Crowdsourcing Behavior: Analysis on OpenStreetMap. In 2015 Conference on Technologies and Applications of Artificial Intelligence (TAAI) (pp. 373-380). IEEE.
Corcoran, P., Mooney, P., & Bertolotto, M. (2013). Analysing the growth of OpenStreetMap networks.
Spatial Statistics, 3, pp. 21-32.
Elwood, S. (2010). Geographic information science: Emerging research on the societal implications of the geospatial web. Progress in Human Geography, 34(3), 349-357.
Elwood, S., Goodchild, M., & Sui, D. (2012, 5). Researching Volunteered Geographic Information: Spatial Data, Geographic Research, and New Social Practice. Annals of the Association of American Geographers, 102(3), 571-590.
Fekete, A., Tzavella, K., & Iuliana, A. (2015). Critical data source; Tool or even infrastructure? Challenges of geographic information systems and remote sensing for disaster risk governance. ISPRS international journal of geo-information, 4, pp. 1848-1869.
Girres, J.-F., & Touya, G. (2010). Quality Assessment of the French OpenStreetMap Dataset. Transactions in Gis, 4, pp. 435-459.
Goodchild, M. F. (2007). Goodchild M F. Citizens as sensors: the world of volunteered geography.
GeoJournal, 4, pp. 211-221.
Haklay, M., & Weber, P. (2008). OpenStreetMap: User-Generated Street Maps. IEEE Pervasive Computing. Haklay, M., Basiouka, S., Antoniou, V., & Ather, A.
(2010). How many volunteers does it take to map an area well? The validity of Linus’ law to volunteered geographic information. The Cartographic Journal, 47(4), pp. 315-322.
Hristova, D., Quattrone, G., Mashhadi, A., & Capra, L. (2013). The life of the party: Impact of social mapping in OpenStreetMap. In ICWSM.
Husen, S., Idris, N., & Ishak, M. (2018). The quality of OpenStreetMap in Malaysia: A preliminary assessment.
International Archives of the Photogrammetry, Remote Sensing and Spatial Information Sciences - ISPRS Archives. 42, pp. 291-298. International Society for Photogrammetry and Remote Sensing.
Imi, Y., Hayakawa, T., & Ito, T. (2012). Analyzing the Effect of OpenStreetMap during Crises: The Great East
Japan Earthquake. In IEEE 14th International Conference on Commerce and Enterprise Computing (CEC), 2012 (pp. 126-130). IEEE.
Jiang, B. (2013). Head/tail Breaks: A New Classification Scheme for Data with a Heavy-tailed Distribution.
Professional Geographer, 3, pp. 482-494.
Jiang, B., & Jia, T. (2011). Zipf's law for all the natural cities in the United States: a geospatial perspective.
International Journal of Geographical Information Science, 25(8), pp. 1269--1281.
Kounadi, O. (2009). Assessing the quality of OpenStreetMap data. Msc geographical information science, University College of London Department of Civil, Environmental And Geomatic Engineering. Lin, W. (2015). Revealing the making of OpenStreetMap:
A limited account. The Canadian Geographer, 59(1), pp. 69-81.
Manrique-Sancho, M.-T., Avelar, S., Iturrioz-Aguirre, T., & Manso-Callejo, M.-Á. (2018, 8 20). Using the Spatial Knowledge of Map Users to Personalize City Maps: A Case Study with Tourists in Madrid, Spain. ISPRS International Journal of Geo-Information, 7(8), 332. Mooney, P., & Corcoran, P. (2012). Characteristics of
Heavily Edited Objects in OpenStreetMap. Future Internet, pp. 285-305.
Mooney, P., & Corcoran, P. (2015). Analysis of Interaction and Co‐editing Patterns amongst OpenStreetMap Contributors. Transactions in GIS, 128(5), pp. 633-659.
Mullen, W., & Jackson, S. (2015). Assessing the impact of demographic characteristics. GeoJournal, 80(4), pp. 587-605.
Neis, P., & Zipf, A. Z. (2012). Analyzing the Contributor Activity of a Volunteered Geographic Information Project — The Case of OpenStreetMap. ISPRS International Journal of Geo-Information, 1(2), pp. 146-165.
Neis, P., Zielstra, D., & Zipf, A. (2013). Comparison of Volunteered Geographic Information Data Contributions and Community Development for Selected World Regions. Future Internet, 5(2), pp. 282-300.
OpenStreetMap. (2019, 5 7). Overpass API. Retrieved 3
22, 2019, from Overpass Wiki:
https://wiki.openstreetmap.org/wiki/Overpass_API Poiani, T. H., Rocha, R., Degrossi, L. C., & Albuquerque,
J. P. (2016). Potential of collaborative mapping for disaster relief: A case study of OpenStreetMap in the Nepal earthquake 2015. In System Sciences (HICSS), 2016 49th Hawaii International Conference on (pp. 188-197).
Sassen, S. (2005). The global city: introducing a concept.
Brown Journal of World Affairs, 2, pp. 27-43.
Crowdsourced Geographic Information. ISPRS International Journal of Geo-Information, 5(5), 55. Stephens, M. (2013). Gender and the GeoWeb: divisions
in the production of user-generated cartographic information. GeoJournal, 78(6), pp. 981-996.
Su, S., & Lei, C. (2017). Coverage inequality and quality of volunteered geographic features in Chinese cities: Analyzing the associated local characteristics using geographically weighted regression. Applied geography, 78, pp. 78-93.
Tian, Y., Zhou, Q., & Fu, X. (2019, 1 18). An Analysis of the Evolution, Completeness and Spatial Patterns of OpenStreetMap Building Data in China. ISPRS International Journal of Geo-Information, 8(1), 35. Xu, J., Li, L., & Qi, Z. (2017). Spatial-temporal Analysis
of OpenStreetMap Data After Natural Disasters: a Case Study of Hatti Under Hurricane Matthew. ISPRS - International Archives of the Photogrammetry, Remote Sensing and Spatial Information Sciences, XLII-2/W7, pp. 1401-1406.
Yagoub, M. (2017, 9 2). Assessment of OpenStreetMap (OSM) Data: The Case of Abu Dhabi City, United Arab Emirates. Journal of Map and Geography Libraries, 13, pp. 300--319.
Yang, A., & Fan, H. (2016). Amateur or Professional: Assessing the Expertise of Major Contributors in OpenStreetMap Based on Contributing Behaviors.
ISPRS International Journal of Geo-Information, 5(2), p. 21.
Yasseri, T., & Quattrone, G. (2013). Temporal analysis of activity patterns of editors in collaborative mapping project of OpenStreetMap. In Proceedings of the 9th International Symposium on Open Collaboration (p. 13).
Zhou, Q. (2018). Exploring the relationship between density and completeness of urban building data in OpenStreetMap for quality estimation. International Journal of Geographical Information Science, 32(2), 257-281.