Mapping Gentrification in Little Tokyo, Los Angeles: Using
Geographic Information System (GIS) Analytical Tools
Saki Nakashima
aaTokyo Gas Corporation, World Trade Center 3rd Floor, 2-4-1 Hamamatsucho, Minato, Tokyo, saki0182@tokyo-gas.co.jp
Abstract: From the time when its roots traced back all the way back in 1886, Little Tokyo has overcome numerous obstacles including the Great Depression, Japanese American internments in the Second World War, racial discrimination, transition into Bronxville, multinational redevelopment projects, and the demographic/ geographic dispersion of the Nikkei communities. Despite these numerous development, Little Tokyo remains the major historical, cultural, and civic center for Japanese Americans living in Southern California and has continued to be a historically and a culturally symbolic space for many.
This research strives to identify the trends of gentrification in the study area; Little Tokyo, through indicators or variables in 5 domains: (A) Housing, (B) Demography, (C) Income, (D) Education Level, and (E) Public Safety with the central focus on housing. To analyze the occurrence of these elements between the year 1990 and 2013, quantitative research including GIS groundworks were delivered. This research is aimed at becoming a tool to measure and potentially assist communities to make more robust development intervention and implementation by identifying the trends that emerge socio- economic problems like gentrification facing local communities around the world.
Keywords: gentrification, GIS, Little Tokyo, urban planning
1. Introduction
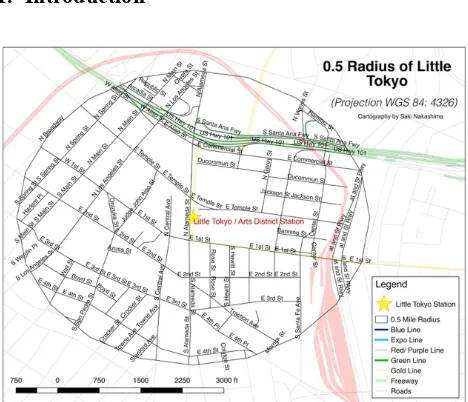
Figure 1. Map of the Study Area
With the installment of Los Angeles’s new rail transit system in 2009, the city has promoted to a more environmentally sustainable lifestyle and introduced innovative approaches to support economic revitalization for the residents of L.A. County. Due to these visible changes, some individuals may argue that factors such as the installment of this new public transportation source lead to “positive gentrification.”
However, authentic benefits for the whole that exist from gentrification can only be appreciated by the public unless it is acknowledged, understood, and
anticipated openly by those in the fields of policy-making and other private/ public professionals that have a direct impact on the progression of gentrification in an area.
Little recognition and research have been preceded to evaluate the massive impact of gentrification that is put on the transit- oriented development (TOD) sites. More particularly, this is towards the areas that are culturally and historically significant for ethnic enclave neighborhoods, such as Little Tokyo. Residents and business owners may be vulnerable to displacement, rent burdens, or other forms of negative gentrification unless actors such as policymakers, urban studies academicians, and community stakeholders intervene in effectively manage a tool to ensure equal distribution of benefits. In this research, Little Tokyo, Los Angeles will be the study area (Figure 1). Through GIS applications and other multimethod researches, it will aim to create a visual tool to measure and identify the roots of the gentrification in Little Tokyo.
1.1 Definition of Terms
For this paper, the following definitions apply. 1.1.1 Gentrification
In references to the ongoing discussion of the evolving definition of gentrification, this research will examine the changes in housing characteristics, demographics, education backgrounds, economic fluctuates between 1990 and 2013 using CSV files provided from Little Tokyo Committee and the Los Angeles Government.
neighborhood -using real estate investment and new high- income residents moving in - as well as demographic change not only regarding income level but also in terms of changes in the education level or racial makeup of residents.1
1.1.2 Transit Oriented Development (TOD)
In this paper, Hank Dittmar, Gloria Ohland, and Peter Calthorpe’s interpretation will be used for defining transit-oriented development (TOD): a cross-cutting approach to development that can help offer new ranges of development patterns for households, businesses, towns, and diversity brought about by the installment of a transportation system. 2
To understand the complex web of transit modes with the topic of gentrification, essential strategies for economic, cultural, and environmentally sustainable growth in Little Tokyo will be discussed. This paper will confront the regional issues of open space preservation, mobility, affordable housing and lifestyle, and vitality in the community through Sustainable Little Tokyo’s planning framework sets forth the community's values, aspiration, and priorities.
1.1.3 Japanese Americans (Nikkei)
In the broad umbrella term, Japanese Americans include individuals who are not American citizens and who may not have been born or raised in the United States. However, in this paper, the term “Japanese American(s)” or “Nikkei” will refer to American citizens of Japanese ancestry, who are born and raised in the United States. Japanese Americans are defined in this way because of the study’s focus includes the significance of historical and ancestral ties in the physical space of Little Tokyo.
2. Research Question
2.1 Research Problem and Questions
The following questions are research questions, which serves as the guide or the core of the study that helps elucidate the purpose of the information the writer has gathered, reasons for why the data collected, and from which source the data originates. Furthermore, the research question intends to take notice of unique cultural, geographical, and socio-economic factors that can only be explained from the rare backgrounds and phenomenon in Little Tokyo. These factors should not be directly applicable toward any similar study areas but rather hint the possibility of a similar phenomenon to be the principal factor in other potentially gentrified study areas.
1 "Gentrification Explained”,
https://www.urbandisplacement.org/gentrification-explained. Accessed 18 Feb. 2019.
2Dittmar, Hank, Gloria Ohland, and Peter Calthorpe. The New Transit Town Best Practices in Transitoriented Development. Island Press, 2004.
The answers to each other questions will be conducted through detailed and multimethod methodologies, and moreover clarified through findings and analysis section later in this paper:
1) What are the root causes of contemporary gentrification in Little Tokyo?
2) How can Transit- Oriented Development (TOD) objectives influence the culturally, economically, and ecologically sustainable urban transit planning process in Little Tokyo, Los Angeles?
3. Methodology
3.1 Data Sources
Quantitative methods are used to understand the progression of demographic and socioeconomic factors through visual images using GIS and looking at yearly updated real estate data in the two decades between 1990 and 2013. Through analysis of the multiple data sources, this report will strive to identify the trends of gentrification in Little Tokyo through indicators or variables in 5 domains: (A) Housing, (B) Demography, (C) Income, (D) Education Level, and (E) Public Safety, with the central focus on housing.
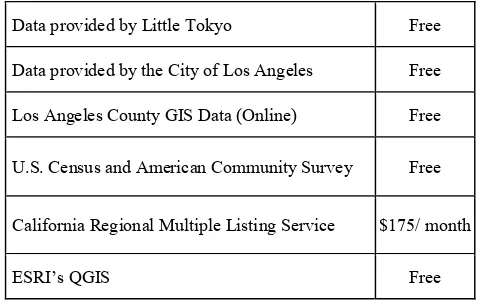
Below is a summary of the data sources that were used throughout the research methodology:
Data provided by Little Tokyo Free
Data provided by the City of Los Angeles Free
Los Angeles County GIS Data (Online) Free
U.S. Census and American Community Survey Free
California Regional Multiple Listing Service $175/ month
ESRI’s QGIS Free
Table 1. Data Source
3.2 Real Estate Data and GIS: (A) Housing
In this section, the focus will be put on variable (A) “Housing” to identify the trends of gentrification. The following dependent variables relevant to residentials are factors picked up through mainly using California Regional Multiple Listing Service. However, Census Tracts from 1990, 2000, and 2013 will also be used to indicate longitudinal and latitudinal x- y coordinates to pin and determine the geographic location of each point:
1) Rent burdens
2) % of Renters Households 3) Median Gross Rent
To obtain these data and have access to various information through Geographic Information System techniques, CRML and the Census are used to create the CSV (Comma Separated Values). In the process of obtaining polygon- figured ESRI’s GIS Shapefiles, the writer began with collecting CRML’s total data and listing the result as a CSV file. By merging 2010’s Census Tract and CSV file’s geoID, the writer was capable of creating a new layer from a delimited text file with no geometry but only attribute tables. Columns were selected afterward through graduated layer renderings in the mode setting of “Equal Intervals”. Another simpler method to import CSV data and convert it into polygon shapefile is by using the Python.
As mentioned previously, CMRL is a crucial tool for this section. From selecting a location through the website, the lease and descriptions such as by whom it was rented, when the building was made, previous lease price, and background of the residents are presented; which can later be exported as .txt file or .csv files.
3.2.1 Rent Burdens
To create these maps indicating the rent burdens in Los Angeles County during the time periods of 1990, 2000, and 2013, the California Regional Multiple Listing Service is used. As represented by the Department of Housing and Urban Development (HUD), “rent burdens” are defined in this paper as renters spending 30% more than their household income on rent (HIR). The numeric values in the data are calculated in United States dollar values and are not adjusted for inflation. Along with the California Regional Multiple Listing Service, the rent burdens of 1990, 2000, and 2013 are collected from the Census (1990 SF3), Census (2000 SF3), and American Community Survey (2009-2013) respectively.
3.2.2 % Renter household
To create these maps, rent households from 1990, 2000, 2013 are collected by CRMLS, Longitudinal Tract Database, Census 1990 SF3, Census 2000 SF3, and American Community Survey 2009-2013. This data explains the percentage of renter household in the particular area and does not have ownership towards the property. The color legend are categorized using the format method: Standard Deviation.
3.2.3 Median Gross Rent
These maps aim to explain the median gross rent in the years 1990, 2000, and 2013. The data is collected through Geolytics Neighborhood Change Database 1990/ 2000, American Community Survey 2009-2013, and CRMLS. The rate of the money is adjusted to the dollar values in 2013. The color legend is categorized by using the format: Standard Deviation.
3.2.4 Total Number of New Homes Built and Condo Conversion
These maps identify the total number of homes being built in each neighborhood. Using LA County Assessor
Parcel File 2013’s data, the trend can be apparent through the Standard Deviation format. The numbers of Percentage of the Condo Conversions are separately created and indicated as numerical values in the maps.
3.3 Census Data and GIS: (B) Demographics, (C) Income, (D) Education Level
In this section, the focus will be put on variable (B) Demographics, (C) Income, (D) Education Level through using multiple census data/ surveys and utilizing GIS to identify the trends of gentrification in Little Tokyo, Los Angeles. The following socio-economic dependent variables are factors picked up through mainly using Census Tract 1990, 2000, 2013 and indicate the longitudinal and latitudinal x- y coordinates to pin the geographic location of the following areas:
1) Population of Size and Density 2) Demographic
3) Education Level of Residence 4) Average Household Income
To collect the socio-economic data of these variables, similar to the method in collecting housing fields, each data were input individually as a CSV files. GeoID and 2010’s Census Tracts were merged together, enabling multipurpose usage through Geographic Information System tool ESRI QGIS. Another method to import CSV data and change it into polygon GIS shapefile (.shp) is by using the Python binary format.
3.3.1 Population of Size and Density
The GIS Shapefiles for the population size and density of Little Tokyo and its neighboring area are collected through Census 1990 SF1, Census 2000 SF1, and American Community Survey 2009- 2013. As the base for this map, the population in size is given with a label of population density per Square Mile in the years 1990, 2000, and 2013. According to the consumption/ demand theory, both variables will be crucial to fully understand the trends of gentrification.
3.3.2 Demographic
The GIS Shapefiles made for QGIS are collected from the Longitudinal Tract Database, Census 1990 SF1, Census 2000 SF1, and American Community Survey 2009- 2013. And despite the fact that there are many more ethnic groups or race that can be acknowledged, in the second part of the demographic maps, a pie graph is represented to show the demographic backgrounds of the residence in the area in four categories. These are the definitions for each demographic group:
1) Non- Hispanic White: those who are considered racially white and not of Hispanic/ Latino origin 2) Non-Hispanic Black: those who are considered
racially black and not of Hispanic/ Latino origin 3) Hispanic: those who are descendants of
countries of Hispanic America or Spain.
4) Asian: those who are descendants of countries of Asian nation- states.
3.3.3 Education Level of Residence
Two categories are given to identify the resident’s education level in Little Tokyo, Skid Row, Arts District, Civic Center, and nearby Union Station: percentage of adults who have obtained a bachelor’s degree or higher and adults with less than high school completion. “Adult” is defined as an individual that is older than the age of 25. Data for the GIS Shapefiles are converted into adjustable polygons through CSV files inputted from Longitudinal Tract Database, Census 1990 SF3, Census 2000 SF3, American Community Survey 2009- 2013.
3.3.4 Average Household Income
The map provides graduated representation of the average household income in Little Tokyo and the neighborhood areas in 1990, 2000, and 2013. The numeric values that are indicated on the map signify the percentage of the individual poverty rate. The data for creating the GIS Shapefile is collected from the American Community Survey from 2009- 2013, Longitudinal Tract Database, Census 1990 SF3 and 2000 SF3, and the Geolytics Neighborhood Change Database 1990, 2000, 2010. United States Dollar ($) is used as a constant value that is adjusted to its worth in 2013.
3.4 Los Angeles County Sheriff Data and GIS: (E) Public Safety
Lastly, in this section, the focus will be on the (E) Public Safety variable. Through crime data collected by the Los Angeles County Sheriff and offered from Los Angeles County GIS Portal, the numbers of crimes from 2005 (the oldest data publicly provided through the portal website) and 2017 (the newest data publicized) will be compared. Through utilizing QGIS functions such as radius buffers and heat maps, GIS tools will assist to identify the relationship between crimes and locations of train stations and police stations through maps.
Similar to the method in collecting housing data and socio-economic data previously introduced, each data were input individually as a CSV files. GeoID and 2010’s Census Tracts were merged together, enabling multipurpose usage through Geographic Information System tool ESRI QGIS. Another method to import CSV data and change it into polygon GIS shapefile (.shp) is by using the Python binary format.
4. Findings
4.1 Mapping Findings
Through the literature reviews, analyzing attribute tables, and mapping CSV files collected from the real estate data, U.S. census data, and Los Angeles County Sheriff data the two research questions (page two) were answered.
4.1.1 Housing Outlook
While the median rent of Little Tokyo has been somewhat high but stable compared to the other neighborhoods in Los Angeles County, the rent burden; or the percentage of renters paying more than 30 percent of their income on rent, increased significantly during the three time periods, where it went from approximately 43% to 54%. This statement is very much true if we only viewed the U.S. Census Data. The median gross rent of the households in the Census Tract divided “Little Tokyo” did not fluctuate substantially ($393.38/month in 1990, $386.10/month in 2000, and $424.00/ month in 2013), and it can be stated that the rental price does not help explain this phenomenon of increased rent burdens. This finding proves that median gross rent fails to explain the rise in the percentage of rent burdens. Therefore, the drop in the renter’s median household income was relied to explain the rise of rent burden percentages. It is true as further results in the economic section and figures 18, 19, 20 reveal, the medium income in Little Tokyo dropped as result of the financial crisis, and assists to prove the rise in the percentage of households with rent burdens.
However, additionally, when focusing on the median gross rent maps of the study area created through GIS (see figures 8, 9, 10), and focusing within the 0.5 Mile Radius from the Little Tokyo Station on the Gold Line, it can be seen that there are vast transitions in the property value especially in the North- West and the entire East region. The North- West part has increased from $686.53/ month, $1156.95/month, to $2370/month. The East area also altered from $612.32/ month, $735.75/ month, to $2001/month in 1990, 2000, and 2013 respectively. This hints the overflowing changes in the total distribution of income for the residents living in the study area and concluded to be an additional factor to explain the increase in the proportion of households experience difficulty paying their rents in the two decades (see figures 2, 3, 4).
From mapping the household transitions of study area (see figures 5, 6, 7), it can also be analyzed that the percentage of renters household in Little Tokyo and most of its neighborhood besides the Arts District did not change massively: approximately 89% (1990) to 90% (2000), and to 83% (2013) in Little Tokyo. However, considerable change can be interpreted from figure 11, which explains the condominium conversion percentage between 2003 and 2013 and the numbers of new condominiums built between 2005 and 2013.
Figure 2. Rent Burden 1990 Figure 3. Rent Burden 2000
Figure 4. Rent Burden 2013 Figure 5. Renter 2013
Figure 6. Renter 2000 Figure 7. Renter 2013
Figure 8. MG Rent 1990 Figure 9. MG Rent 2000
Figure 10. MG Rent 2013 Figure 11. New and Conversion
4.1.2 Demographic Outlook
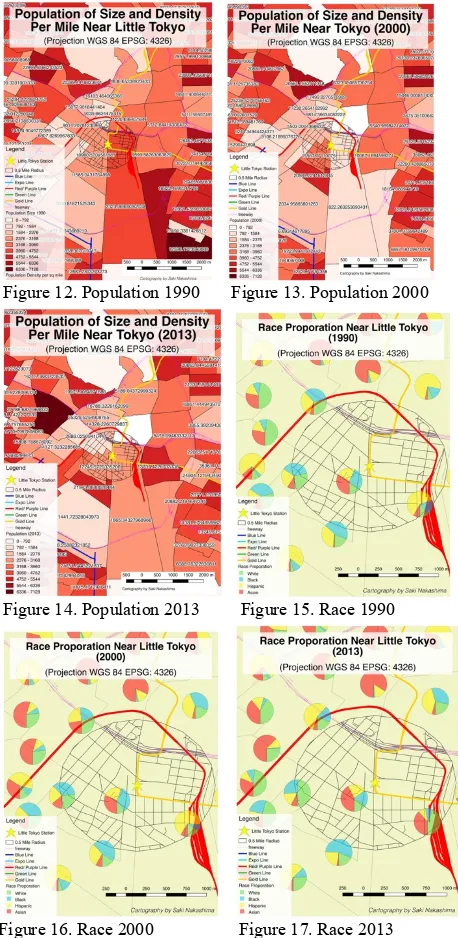
From figures 15, 16, and 17, it can be observed that Little Tokyo is an ethnically diverse community, and a large percentage of its residents are Asians, with African Africans representing the second most significant race group in all three time periods of 1990, 2000, and 2013. The proportion of African Americans residing within the study area has increased remarkably between 1990 and 2000, while the portion of Asian residents went downhill. However, between 2000 and 2013, it can be seen that the total percentage of African American residents dropped significantly while the numbers of Asian residents grew in the area.
Additionally, from figures 12, 13, and 14, between the years 1990 and 2000, the total population in size and density per square mile in the study area has increased dramatically from 2,500 to 3,500 and approximately 10,960 to 15,567 per square mile, respectively. However, despite the great demographic transitions in neighboring areas, the population remained relatively stable over the next decade compared to neighboring areas. Also, from the information collected through the data processing of U.S. Census also revealed that the majority of the households live alone, and do not have descendants residing with them. Almost 50% of the total households do not have English speaking individuals that are above 15 years old, and roughly 25% of the people living in Little Tokyo are married. From this data, it can be predicted that “linguistic isolation” in the geographic area is one of the crucial issues in the study area, making many of the residents limited in the access to the assets provided by the community.
Finally from the maps that explain the demographic created through geographic information systems, the vast division in race proportion can be acknowledged. This outlook resonates greatly with the median household incomes and also the median gross rent, explaining the apparent great economic gaps within 0.5 mile radius from the Little Tokyo Station.
Figure 12. Population 1990 Figure 13. Population 2000
Figure 14. Population 2013 Figure 15. Race 1990
Figure 16. Race 2000 Figure 17. Race 2013
4.1.3 Economic Outlook
Through the literature review of the backgrounds of Little Tokyo, it is stated that more than 50 percent of the Little Tokyo residents live under the Federal Poverty Line (FPL). From figures 18, 19, and 20, it proves this statement by showing that from 1990 to 2013, the average household income remains to be much lower than its neighborhood areas besides Skid Row, south-west of the study area.
4.1.4 Education Level Outlook
Figures 18, 19, and 20 indicate that the ratio of residents with their last education from high school and from college to be stable during the previous 23 years in the study area. This outcome can be understood through Little Tokyo’s demographic background of great numbers of the aging population. However, when observing the
map in a broader perspectives, it can be seen in the areas near the Civics Center and the Arts District the ratio changes remarkably, indicating the dawning the wave of new, young, and highly educated residents moving into these neighborhoods between the years 1990 and 2013. This is a great factor for overflow and accelerating the speed of gentrification in Little Tokyo.
Figure 18. Income 1990 Figure 19. Income 2000
Figure 20. Income 2013
4.1.5 Public Safety Outlook
observed in figures 24 and 25. These maps look at the crimes that occurred with proximity to police stations near Little Tokyo, locally, in the years 2005 and 2016, and three notable factors can be noticed:
1. Despite the fact that the overall heat map proximity is relatively similar, the numbers of total violent crimes prevalent and the level of clusters for crimes have primarily unique traits. 2. Total crime is especially omnipresent along the
metro lines in 2016.
3. Total crimes seem to appear to occur in similar areas and certain roads.
Figures 24 and 25 show that the location of the police station is preferably in an arbitrary relationship with crime clusters. The study area neighborhood is entirely within the one mile radius of the nearby police stations, conceivably from the influence of the Civics Center where many of the county’s governmental offices, buildings, and courthouses are located.
Figure 21. Crime #1 Drug and Alcohol
Figure 22. Crime #2 Burglary
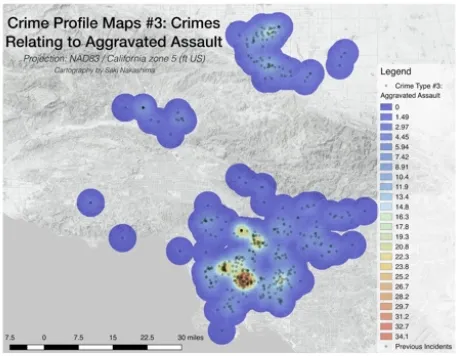
Figure 23. Crime #3 Aggregated Assault
Figure 24. Crimes 2005 Figure 25. Crimes 2016
4.2 Areas Susceptible to Gentrification
With all of the mapping findings from each domain (housing, demography, income, education level, and public safety), figure 26 will take the overall results from the quantitative research and replicate it to Lance Freeman’s method from 2005 and use the following criteria to define if neighborhoods have been gentrified between 1990 and 2013. Freeman’s method, which is organized in the table 2, is used commonly amongst scholars of contemporary gentrification due to the fact that it is known to be consistent with other urban planning studies on mapping variables; these include University of Berkeley Urban Displacement Project, Lisa Bate’s research on gentrification of Portland, Haas Institute and CJJC’s research on gentrification of the Bay Area, and Governing Magazine’s recent analysis on the gentrification of the largest fifty cities in the United States. 3
3 Mapping Displacement and Gentrification in SF Bay Area. https://www.urbandisplacement.org/map/sf. Accessed 18 Feb. 2019.
Gentrifiable • Have a median income less than the median for Los Angeles
• Have a proportion of housing built within the past 20 years lower than the proportion found at the median for Los Angeles
Gentrified • Have a percentage increase in educational attainment greater than the median increase in educational attainment for Los Angeles.
• Have an increase in real housing prices during the study period. Table 2. Freeman’s Criteria for Gentrification
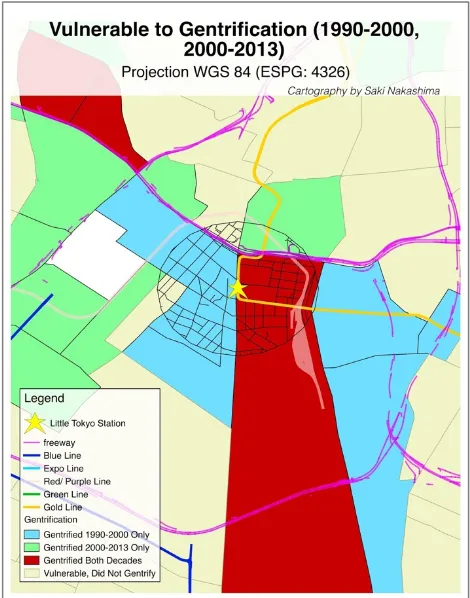
From figure 26, the results are striking. In the map, the red Census tracts represent the areas that have been gentrified both decades between 1990 and 2013, blue Census tracts to be the areas that were gentrified between 1990 and 2000, and green Census tracts to be the areas that gentrified between 2000 and 2013. Within the study area, 0.5-mile radius from Little Tokyo/ Arts District Station, these three colors are particularly stark, meaning that in this location, there is higher increases in renters’ income, overall housing prices, and residents’ education levels. It is true that figure 26 does not tell us who is moving, where, for what purpose. However, this visualization is crucial for policymakers, lawmakers, and community members to see where particular attention is required to support these vulnerable communities stay where they currently are and benefit from potential transit-related developments.
Figure 26. Vulnerable to Gentrification
5. Conclusion
From the quantitative research of this paper, the two research questions were answered:
1) Housing, demographic, economic, education level, and public safety outlooks of the study area were determined through mapping the U.S. Census, ACS Data, CRMLS, and the Los Angeles County Sheriff Data.
2) The Little Tokyo neighborhood is not vulnerable to gentrification but have already been gentrified between 1990- 2013 through Lance Freeman’s methodology of contemporary gentrification and GIS mappings.
6. References
Dittmar, Hank, Gloria Ohland, and Peter Calthorpe. The New Transit Town Best Practices in Transitoriented Development. Island Press, 2004.
"Gentrification Explained”,
https://www.urbandisplacement.org/gentrification-explained. Accessed 18 Feb. 2019.