Slinger, K.R., Stewart, A.H., Daniel, Z.C.T.R., Hall, H., Masey O’Neil, H.V., Bedford, M.R., Parr, T. and Brameld, M.V. 2019. The association between faecal host DNA or faecal calprotectin and feed efficiency in pigs fed yeast enriched protein concentrate. Animal.
The association between faecal host
DNA or faecal calprotectin and feed
efficiency in pigs fed yeast enriched
protein concentrate
by Slinger, K.R., Stewart, A.H., Daniel, Z.C.T.R., Hall,
H., Masey O’Neil, H.V., Bedford, M.R., Parr, T. and
Brameld, M.V.
Copyright, Publisher and Additional Information: Publishers version distributed under the terms of the Creative Commons Attribution License:
http://creativecommons.org/licenses/by/4.0/
DOI: 10.1017/S1751731119000818
The association between faecal host DNA or faecal calprotectin and
feed efficiency in pigs fed yeast-enriched protein concentrate
K. R. Slinger
1†, A. H. Stewart
2, Z. C. T. R. Daniel
1, H. Hall
3a, H. V. Masey O
’
Neill
3,
M. R. Bedford
4, T. Parr
1and J. M. Brameld
11Nutritional Sciences, School of Biosciences, Sutton Bonington Campus, The University of Nottingham, Leicestershire LE12 5RD, United Kingdom;2Animal Production, Welfare and Veterinary Sciences, Harper Adams University, Newport, Shropshire TF10 8NB, United Kingdom;3AB Agri Limited, Innovation Way, Lynch Wood, Peterborough PE2 6FL, United Kingdom;4AB Vista, Woodstock Ct, Marlborough SN8 4AN, United Kingdom
(Received 7 August 2018; Accepted 18 March 2019)
Gut cell losses contribute to overall feed efficiency due to the energy requirement for cell replenishment. Intestinal epithelial cells are sloughed into the intestinal lumen as digesta passes through the gastrointestinal tract, where cells are degraded by
endonucleases. This leads to fragmented DNA being present in faeces, which may be an indicator of gut cell loss. Therefore, measuring host faecal DNA content could have potential as a non-invasive marker of gut cell loss and result in a novel technique for the assessment of how different feed ingredients impact upon gut health. Faecal calprotectin (CALP) is a marker of intestinal inflammation. This was a pilot study designed to test a methodology for extracting and quantifying DNA from pig faeces, and to assess whether any differences in host faecal DNA and CALP could be detected. An additional aim was to determine whether any differences in the above measures were related to the pig performance response to dietary yeast-enriched protein concentrate (YPC). Newly weaned (~26.5 days of age) Large White×Landrace×Pietrain piglets (8.37 kg±1.10,n=180) were assigned to one of four treatment groups (nine replicates of five pigs), differing in dietary YPC content: 0% (control), 2.5%, 5% and 7.5% (w/w). Pooled faecal samples were collected on days 14 and 28 of the 36-day trial. Deoxyribonucleic acid was extracted and quantitative PCR was used to assess DNA composition. Pig genomic DNA was detected using primers specific for the pig cytochrome b(CYTB) gene, and bacterial DNA was detected using universal16Sprimers. A pig CALP ELISA was used to assess gut inflammation. Dietary YPC significantly reduced feed conversion ratio (FCR) from weaning to day 14 (P<0.001), but not from day 14 to day 28 (P=0.220). Pig faecalCYTBDNA content was significantly (P=0.008) reduced in YPC-treated pigs, with no effect of time, whereas total faecal bacterial DNA content was unaffected by diet or time (P>0.05). Faecal CALP levels were significantly higher at day 14 compared with day 28, but there was no effect of YPC inclusion and no relationship with FCR. In conclusion, YPC reduced faecalCYTBDNA content and this correlated positively with FCR, but was unrelated to gut
inflammation, suggesting that it could be a non-invasive marker of gut cell loss. However, further validation experiments by an independent method are required to verify the origin of pig faecalCYTBDNA as being from sloughed intestinal epithelial cells.
Keywords: gut, swine, faeces, sloughing,cytochrome b
Implications
The host DNA in faeces presumably originates from gut cell losses. This development of a non-invasive assessment method is potentially a novel indirect measurement of gut cell losses, although further validation experiments are required. A yeast-inclusion diet significantly reduced pig DNA in faeces and therefore may reduce gut cell losses. Turnover of gut cells contributes to feed efficiency; therefore,
assessment of host DNA in faeces could potentially, following further methodology development, form the basis of a procedure to indirectly assess gut health and feed conversion ratio.
Introduction
Global food security is driving demand for increased feed efficiency in livestock production, resulting from an ever-growing human population (Gill,et al.,2010). One important component of feed efficiency that is often ignored is gut
aPresent address: Anpario PLC, Manton Wood Enterprise Park, Worksop,
Nottinghamshire, S80 2RS, United Kingdom
†E-mail:kimberley.slinger@nottingham.ac.uk(corresponding author)
duction in any medium, provided the original work is properly cited.
animal
turnover, which relates to the continual proliferation, differ-entiation, movement and subsequent sloughing of epithelial cells lining the gastrointestinal tract. The rate at which this occurs can be very high (Bregendahl et al., 2004), requires both energy and nutrients for replenishment of cells (Baskin and Taegtmeyer,2011), and therefore influences the feed efficiency. Consequently, accurate measurements of gut turnover are important when attempting to establish ways to improve feed efficiency. Currently all methods to measure gut turnover are invasive or expensive involving the use of stable isotope-labelled amino acids (Buttery,1981) or deuterium-labelled water and expensive detection systems (Gasier et al.,2010). Hence a simple non-invasive method of meas-uring gut cell losses could potentially be extremely useful to understand growth efficiency and diet suitability.
Epithelial cells lining the small intestine are rapidly turned over and lost into the small intestine lumen where they are degraded by endonucleases, leading to DNA debris being present in faeces (Creamer,et al.,1961; Loretz,et al.,2006). Most literatures regarding DNA extraction from faeces in humans and animals relate to (i) determination of the microbial population in the gut (Ariefdjohan et al., 2010); (ii) use in human diagnostics of particular cancers (Roperch et al.,2015); (iii) species confirmation in wildlife research (Ram ´on-Lacaet al.,2015); or (iv) use in forensics (Boonseub et al., 2012). In all situations, the extraction of sufficient DNA of a suitable quality is the primary concern since faecal material contains inhibitors, such as bile salts, complex polysaccharides and haemoglobin degradation products (McOrist et al., 2002), that can impair analysis methods (e.g. PCR). Previous studies have assessed human faecal DNA content as a marker of gut inflammation due to the expected increase in gut cell loss as a result of disturbance to the gut homeostasis (Vincent,et al.,2015); however, to the best of our knowledge, the methodology has not been assessed in production animals. Our overall hypothesis is that the concentration of animal DNA present in faeces will be directly proportional to the number of cells lost from the gut. Therefore, the aim of this study was to use DNA extrac-tion and PCR methodology to detect animal (host) DNA in faecal samples as a potential novel, simple, non-invasive measure of gut cell losses. However, faecal DNA will also include DNA from a range of other sources including bacteria and feed ingredients, meaning a host species-specific gene target is required. Mitochondrial DNA gene targets have previously been used as host-specific markers in studies assessing faecal contamination of water sources (Martellini et al.,2005). Another advantage of using mitochondrial gene targets is the relatively high copy number in cells, including the sloughed epithelial cells present in faecal material (Caldwell,et al.,2011). DNA extracted from faeces is likely to be highly degraded, so choosing a high copy number gene should increase the likelihood of detection. Pigcytochrome b (CYTB) was therefore chosen as the gene for assessing host DNA content in pig faeces in the present study.
This was a pilot study designed to explore whether host DNA content in faeces could be extracted and quantified and
whether host DNA content in faeces was related to animal performance measures that might be influenced by gut cell sloughing. Inclusion of yeast extract in livestock diets had previously been shown to affect gut morphology, by increasing gut maturation, and also significantly improved animal performance (Muthusamy et al., 2011). Therefore, inclusion of yeast-enriched protein concentrate (YPC) was used as a dietary treatment in this pilot study to test the hypothesis, since a significant reduction in gut cell sloughing was expected in YPC-treated animals, which should then be detected using theCYTBDNA assay.
Faecal calprotectin (CALP) levels have previously been used as a marker of gut inflammation in pigs (Lallès and Fagerhol,2005). As previously mentioned, studies in humans have assessed human DNA content in faeces as a marker of bowel inflammation (Vincent, et al., 2015). Since gut turnover might be influenced by gut inflammation, we also assessed the CALP levels in pig faeces along with any relationships between faecal CALP,CYTB DNA and animal performance, particularly feed conversion ratio (FCR).
Material and methods
Animals
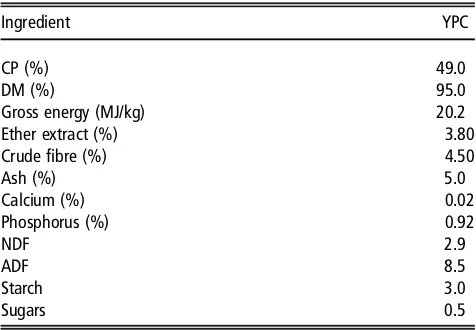
these samples were then pooled for the pen. The pooled sample was approximately 40 g in weight. Weighing of the pigs was typically carried out at midday. The YPC product is a maize-based protein concentrate with a high content (30%) of inactive yeast from the bioethanol production industry. Its nutritional value is shown in Table2.
DNA extraction
Genomic DNA was extracted from pig faeces using a modi-fied phenol chloroform extraction method, followed by ethanol precipitation. All centrifugation steps were at 16 000×g and room temperature. Faeces were not dried prior to weighing. Briefly, 30 mg of frozen faeces was homoge-nised in 600 μl Nuclei Lysis Solution (Promega) using a hand-held homogeniser, the solution centrifuged for 2 min and the resulting supernatant used for a standard phenol : chloroform : isoamyl alcohol (25 : 24 : 1) (Sigma) extraction
followed by an overnight precipitation with 3 M sodium acetate (0.1×sample volume) and 100% (v/v) ethanol (2.5× (sam-ple + sodium acetate)). The DNA was re-suspended in 100 μl of water (DNase and RNase free). Following re-suspension, 25μl of DNA was incubated with 0.5μl of RNase A (Promega) at 37°C for 15 min to remove RNA contaminants. After incubation, 200μl of water (DNase and RNase free) was added to increase the volume and a further two-step phenol : chloro-form : isoamyl alcohol (25 : 24 : 1) (Sigma) clean-up was carried out with a final overnight precipitation with 3 M sodium acetate (0.1 × sample volume) and 100% (v/v) ethanol (2.5 ×(sample + sodium acetate)). Full method is presented in Supplementary Material S1. The DNA was re-suspended in a final volume of 10μl. Deoxyribonucleic acid concentration (ng/μl) and DNA purity (260 nm/280 nm) were measured using the NanoDrop™2000 (Thermo Scientific) spectrophotometer. DNA yield was calculated as nanogram per milligram of faecal
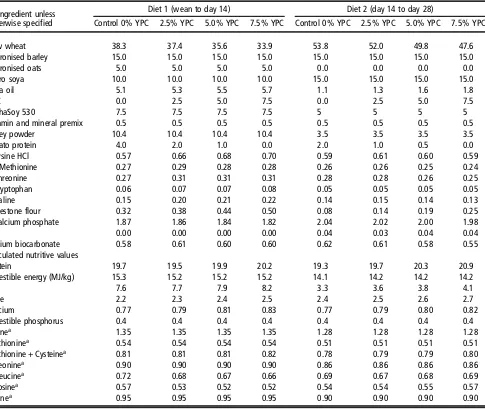
Table 1 Composition of pig diets
% Ingredient unless otherwise specified
Diet 1 (wean to day 14) Diet 2 (day 14 to day 28)
Control 0% YPC 2.5% YPC 5.0% YPC 7.5% YPC Control 0% YPC 2.5% YPC 5.0% YPC 7.5% YPC
Raw wheat 38.3 37.4 35.6 33.9 53.8 52.0 49.8 47.6
Micronised barley 15.0 15.0 15.0 15.0 15.0 15.0 15.0 15.0
Micronised oats 5.0 5.0 5.0 5.0 0.0 0.0 0.0 0.0
HiPro soya 10.0 10.0 10.0 10.0 15.0 15.0 15.0 15.0
Soya oil 5.1 5.3 5.5 5.7 1.1 1.3 1.6 1.8
YPC 0.0 2.5 5.0 7.5 0.0 2.5 5.0 7.5
AlphaSoy 530 7.5 7.5 7.5 7.5 5 5 5 5
Vitamin and mineral premix 0.5 0.5 0.5 0.5 0.5 0.5 0.5 0.5
Whey powder 10.4 10.4 10.4 10.4 3.5 3.5 3.5 3.5
Potato protein 4.0 2.0 1.0 0.0 2.0 1.0 0.5 0.0
L-Lysine HCl 0.57 0.66 0.68 0.70 0.59 0.61 0.60 0.59
DL-Methionine 0.27 0.29 0.28 0.28 0.26 0.26 0.25 0.24
L-Threonine 0.27 0.31 0.31 0.31 0.28 0.28 0.26 0.25
L-Tryptophan 0.06 0.07 0.07 0.08 0.05 0.05 0.05 0.05
L-Valine 0.15 0.20 0.21 0.22 0.14 0.15 0.14 0.13
Limestone flour 0.32 0.38 0.44 0.50 0.08 0.14 0.19 0.25
Dicalcium phosphate 1.87 1.86 1.84 1.82 2.04 2.02 2.00 1.98
Salt 0.00 0.00 0.00 0.00 0.04 0.03 0.04 0.04
Sodium biocarbonate 0.58 0.61 0.60 0.60 0.62 0.61 0.58 0.55
Calculated nutritive values
Protein 19.7 19.5 19.9 20.2 19.3 19.7 20.3 20.9
Digestible energy (MJ/kg) 15.3 15.2 15.2 15.2 14.1 14.2 14.2 14.2
Oil 7.6 7.7 7.9 8.2 3.3 3.6 3.8 4.1
Fibre 2.2 2.3 2.4 2.5 2.4 2.5 2.6 2.7
Calcium 0.77 0.79 0.81 0.83 0.77 0.79 0.80 0.82
Digestible phosphorus 0.4 0.4 0.4 0.4 0.4 0.4 0.4 0.4
Lysinea 1.35 1.35 1.35 1.35 1.28 1.28 1.28 1.28
Methioninea 0.54 0.54 0.54 0.54 0.51 0.51 0.51 0.51
Methionine + Cysteinea 0.81 0.81 0.81 0.82 0.78 0.79 0.79 0.80
Threoninea 0.90 0.90 0.90 0.90 0.86 0.86 0.86 0.86
Isoleucinea 0.72 0.68 0.67 0.66 0.69 0.67 0.68 0.69
Tyrosinea 0.57 0.53 0.52 0.52 0.54 0.54 0.55 0.57
Valinea 0.95 0.95 0.95 0.95 0.90 0.90 0.90 0.90
YPC=yeast-enriched protein concentrate.
material. Extracted DNA samples were stored at–20˚C prior to analysis.
Quantitative PCR
To assess the DNA composition, SYBR Green (Roche) quantitative PCR methodology was used. Primers for detecting host (pig) DNA were designed specifically to the pig CYTB gene (Accession no. AY920909.1) [forward primer 50-TTCATAGGCTACGTCCTGCC-30and reverse primer 50-TCGTGTGAGGGTTGCTTTGT-30], with a predicted ampli-con length of 150 bp. For the detection of bacterial16SDNA, published universal16Sprimers (Mieszkinet al.,2009) were used with a predicted amplicon length of 142 bp. Polymerase chain reaction was performed on 384-well plates using a LightCycler® 480 (Roche) instrument. Each well contained
7.5 μl of SYBR Green (Roche) Mastermix, 1.6 μl of water (DNase and RNase free), 0.45 μl of each primer (10 μM, Forward and Reverse), and 5μl of either the PCR standard, sample, or water (DNase and RNase free) as a negative control. The PCR protocol used was as follows: pre-incuba-tion at 95˚C for 5 min, followed by 45 amplification cycles (95˚C for 10 s, 60˚C for 15 s, 72˚C for 15 s), a single melt cycle (95˚C for 5 s followed by 65˚C for 1 min) and then a cooling cycle of 40˚C for 10 s. A melt cycle was carried out to confirm a single product was produced in the PCR reaction. A pool of extracted faecal DNA samples diluted to 10 ng/μl was used in a fourfold dilution series to create standard curves for both CYTBand bacterial16SDNA. Individual pig faecal DNA sam-ples were then diluted 1 in 8 and tested in triplicate against the standard curve. Negative template controls (DNase and RNase free water) were also tested in triplicate at two points on the plate. Intra-assay CV for CYTB DNA assay, which takes into account the DNA extraction, is 0.66%. Intra-assay CV for the bacterial16SDNA assay is 0.93%. The assays are carried out on the same day with all samples analysed on the same plate and therefore there is no reported inter-assay CV. Polymerase chain reaction products were verified by Sanger Sequencing (BioScience, Nottingham, UK).
Pig Calprotectin ELISA
Calprotectin content in faeces was assessed using the Pig Calprotectin (CALP) ELISA kit (Cusabio, China) according to manufacturer’s instructions, using a FLUOstar® Omega
platereader (BMG LABTECH Ltd, UK) to measure absorbance at 450 nm. Intra-assay CV is <8% and inter-assay CV is <10%. The protocol was optimised for use with faecal sam-ples, whereby samples were diluted 1 : 5 with sample diluent rather than the suggested 1 : 500 for plasma or serum sam-ples. Pig faecal samples were tested in duplicate, requiring two plates, and each plate contained a standard curve also in duplicate. The standard curve was created by generating a four-parameter logistic (4-PL) curve-fit using online software (elisaanalysis.com). The standard curve was then used to calculate CALP concentration values in the faecal samples and the resulting value was multiplied by the dilution factor (x5) to give a final faecal CALP concentration, as per the manufacturer’s instructions.
Statistical analysis of results
All data were analysed using Genstat Statistical Software (17th edition), with significance at P<0.05. One-way ANOVA was used to assess the effects of diet on animal performance (BW, daily feed intake, daily live weight gain and FCR). Two-way (factors: diet × day of trial, blocking for pen) ANOVA were used to assess whether there were any effects on the resulting DNA concentration (ng/μl), DNA qual-ity (260 nm/280 nm), DNA yield (ng/mg faecal material) and DNA contents (CYTB,16SandCYTB:16Sratio). Three-way ANOVA (factors: diet×day of trial×plate, blocking for pen) was used to analyse the faecal pig CALP levels. Where significant differences were observed, post hoc Bonferroni tests were then performed. The relationships between pig faecal CYTB DNA content and FCR and pig faecal CALP and FCR were assessed by Pearson’s correlation for both time points separately.
Results
Effects of Yeast Protein Concentrate on pig performance There were no observable health issues to report and there were no significant treatment differences in daily intake or growth rate (Table3). Pigs fed diets containing 2.5%, 5% or 7.5% YPC had significantly reduced FCR recorded from wean to day 14 (P<0.001) and over the entire 28-day trial (wean-day 28,P=0.019) for 5% and 7.5% YPC inclusion compared to animals on the control diet (Table 3). However, there was no effect (P=0.220) of YPC on FCR from day 14 to day 28 (Table3).
DNA extraction
DNA yield (ng/mg faecal material) was significantly (P=0.016) higher at day 14 compared with day 28 (Figure 1a). However, there was no effect of dietary treatment (P=0.551), nor any interaction (P=0.739) between day and dietary treatment (Figure1a). When analysing DNA
Table 2 Nutrient composition of YPC fed to the pigs
Ingredient YPC
CP (%) 49.0
DM (%) 95.0
Gross energy (MJ/kg) 20.2
Ether extract (%) 3.80
Crude fibre (%) 4.50
Ash (%) 5.0
Calcium (%) 0.02
Phosphorus (%) 0.92
NDF 2.9
ADF 8.5
Starch 3.0
Sugars 0.5
YPC=yeast-enriched protein concentrate.
quality (260 nm/280 nm) there were no significant (P>0.05) interactions or effects of either diet or day of the trial (Figure1b).
Effects of Yeast Protein Concentrate on faecal host and bacterial DNA composition and calprotectin concentration There was no day×YPC interaction (P=0.222) nor any effect of day (P=0.997) on pigCYTBDNA in the faeces, but there was a significant (P=0.008) effect of YPC diet (Figure2a). Bonferroni post hoc analysis showed that faeces from animals on the control diet (0% YPC) contained significantly (P<0.01) more pigCYTBDNA than those on the 2.5% YPC diet (Figure2a and Table4). Interestingly, even though there was no day×YPC interaction, all three YPC diets appeared to reduce faecal pigCYTB DNA contents at day 14, but only 2.5% YPC did so at day 28 (Figure2a).
In contrast, there were no significant effects of diet (P=0.348), day (P=0.205) nor an interaction (P=0.602) on bacterial16SDNA content in the faeces (Figure2b). As there were no differences in bacterial16SDNA, bacterial DNA was used to normalise the pig CYTB DNA content (Figure 2c). There was still a significant (P=0.045) effect of YPC diet
observed when CYTB DNA was normalised for bacterial 16S DNA content, with animals on the control diet (0% YPC) having significantly (P<0.05) more CYTB/16SDNA in their faeces compared to those on the 2.5% YPC diet (Figure 2c and Table 4), with no effect of day (P=0.368) nor a day×diet interaction (P=0.206).
Pig faecal CALP is a marker of inflammation and the levels were significantly higher at day 14 compared to day 28 (P=0.009), indicating more intestinal inflammation closer to weaning (Figure 2d). However, there was no significant (P=0.709) effect of diet nor a day×diet interac-tion (P=0.391).
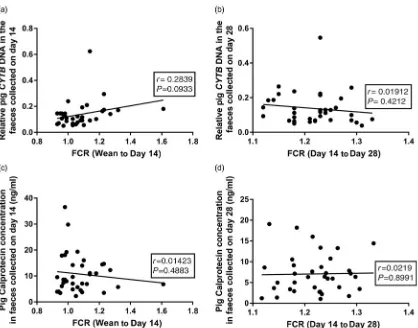
Relationship between host DNA, calprotectin and feed conversion ratio
Pearson correlations were used to investigate relationships between the faecal DNA or CALP contents and feed efficiency. There was a trend for a correlation (r=0.2839, P=0.093) between the faecal pig CYTB DNA content (at day 14) and the recorded FCR (wean to day 14) over the early stages, where a significant effect of diet on FCR was observed (Figure3a and Table3). However, there was
Table 3 The effect of dietary YPC on pig performance
Animal performance
YPC inclusion level (%)
SED P-value
0 2.5 5.0 7.0
Average BW at weaning (kg) 8.38 8.33 8.38 8.37 0.025 0.175
Average BW at day 14 (kg) 12.30 12.91 13.03 12.79 0.291 0.081
Average BW at day 28 (kg) 21.95 21.66 22.68 21.84 0.666 0.457
DFI wean to day 14 (g/pig per day) (diet 1) 340 339 338 317 19.0 0.561
DFI day 14 to day 28 (g/pig per day) (diet 2) 830 776 823 791 41.0 0.542
DFI wean to day 28 (g/pig per day) (treatment diets) 580 557 580 554 27.0 0.585
DLWG wean to day 14 (g/pig per day) (diet 1) 280 327 332 316 21.1 0.076
DLWG day 14 to day 28 (g/pig per day) (diet 2) 687 625 689 646 36.4 0.240
DLWG wean to day 28 (g/pig per day) (treatment diets) 483 476 511 481 24.6 0.510
FCR wean to day 14 (diet 1) 1.24a 1.04b 1.02b 1.01b 0.048 <0.001
FCR day 14 to day 28 (diet 2) 1.21 1.25 1.20 1.23 0.025 0.220
FCR wean to day 28 (treatment diets) 1.21a 1.17ab 1.14b 1.15b 0.023 0.019
DFI=daily feed intake; DLWG=daily live weight gain; FCR=feed conversion ratio (feed intake/weight gain); YPC=yeast-enriched protein concentrate; SED=standard error of the differences of the means.
Means with different superscript letters in the same row differ significantly.
no correlation (P=0.393) at the later phase (day 14 to day 28; Figure3b), where no effect of diet on FCR was observed (Table 3). Likewise, there were no significant correlations between faecal CALP concentrations and recorded FCR at either day 14 (Figure3c,P=0.4883) or day 28 (Figure3d, P=0.9667).
Discussion
To the best of our knowledge, this is the first (pilot) study to measure host DNA in faeces as a non-invasive marker of gut cell losses, which contribute to feed efficiency in production animals. A yeast-inclusion diet was used to test the hypoth-esis as a previous study had shown that dietary yeast influenced gut morphology and animal performance
(Muthusamy et al., 2011). The current study shows that host CYTBDNA content in faeces may be a novel, simple, non-invasive marker for assessing gut cell losses. DNA yield was significantly greater in samples extracted from day 14 compared to samples extracted on day 28. The reason for this is unclear but it may be due to there being a greater level of feed digestion at day 28 as there being a more mature gut. Faecal DM was not measured and while it is unlikely to impact upon PCR, as measurements are performed on a constant DNA basis, this may account for the difference in DNA yield, although this is purely speculation. The DNA quality was unaffected by either diet or day of the trial the samples were collected. Polymerase chain reaction of both pig CYTB DNA and bacterial 16S DNA was successful, as verified by Sanger Sequencing, illustrating that a modified phe-nol–chloroform extraction method was suitable for extracting Figure 2 The effect of an YPC-inclusion diet and when the faeces were collected on faecal (a) pig CYTB DNA content, (b) bacterial16SDNA content, (c) pig CYTB DNA normalised to bacterial16SDNA content and (d) pig CALP concentrations (ng/ml). Mean values + SEM,n=9 for all groups. SEDs for YPC×day interaction=: (a) 0.045, (b) 0.018, (c) 0.445 and (d) 0.600. There were significant effects of diet on both CYTB DNA content (P=0.008) and CYTB normalised to
16SDNA (P=0.045), but not16SDNA content and no significant diet×day interactions or effects of day (P>0.05). See Table4for post hoc Bonferroni analyses for effects of diet on CYTB DNA content and CYTB normalised to16SDNA. Pig CALP concentration was greater at day 14 compared with day 28 (P=0.009). YPC=yeast-enriched protein concentrate; CYTB=cytochrome b; SED=standard error of the differences of the means; CALP=calprotectin.
Table 4 The effect of diet on mean faecal host DNA content in pig faecal samples collected on days 14 and 28 combined
Faecal DNA component
Mean faecal DNA content in dietary group
SED
P-value for effect of diet (ANOVA) Control (0% YPC) 2.5% YPC 5% YPC 7.5% YPC
CYTBDNA 0.188A 0.091B 0.135AB 0.136AB 0.0259 0.008
CYTBDNA normalised for16SDNA 1.77a 0.96b 1.20ab 1.24ab 0.278 0.045
CYTB=cytochrome b; YPC=yeast-enriched protein concentrate; SED=standard error of the differences of the means.
a,bSamples differing in lowercase letters indicate significant statistical differences atP<0.05. A,BSamples differing in uppercase letters indicate significant statistical differences atP<0.01.
sufficient DNA of a suitable quality from pig faeces. In order for a PCR-based methodology to be used for the evaluation of gut cell losses in faeces, the host gene target needs to be present in sufficient quantities in the faeces to be measurable, as faeces are a heterogeneous material. As pigCYTBwas successfully amplified and measured using quantitative PCR, it appears to be suitable as a gene target for the assessment of host DNA in faeces.
The average growth performance of the pigs was as expected for the unit and no undesirable side effects of the treatment were noted. The YPC product contains a maize-derived protein, which is expected to provide a valuable source of amino acids within the diet. However, the product also con-tains around 30% inactive yeast, from the bioethanol process. This yeast component is expected to provide a functional ben-efit beyond the protein value. Halderet al.(2011) investigated a low level of inclusion of a similar product in the diets of heat-stressed broilers and found a significant improvement in feed efficiency. Yeast contains substantial amounts of mannan and glucan in the cell wall. These components have been suggested to exert a ‘pre-biotic-like’ mechanism, with varied perfor-mance-enhancing effects such as inhibition of pathogenic invasion, modulation of the host immune response and enhancing the host gut morphology, thereby limiting the num-ber of pathogens in the gut lumen (Rotoet al.,2015). The main
mechanism by which this occurs is thought to involve the mannan and glucan from the yeast cell wall binding to patho-genic bacteria, preventing their attachment to the intestinal epithelia and therefore enabling the host to reserve energy for growth, rather than repair and replenishment of epithelial cells (Rotoet al.,2015).
component exerted a protective effect on the gut epithelium as previously described. As these animals are newly weaned pigs, the results suggest that inclusion of YPC in the diet helps the animal cope better with the problems observed when animals are transitioning to solid feed (Fairbrother et al.,2005).
Gut cell losses contribute to overall feed efficiency of the animal due to the high nutrient demand for replenishing the cells lining the small intestine (Bregendahlet al.,2004). There was a trend for a relationship between FCR measured over the first 14 days of the trial and the pigCYTBDNA content in the faeces at day 14, but not at the later phase (day 14 to day 28). In the first 14 days of the study, significant differences in FCR between dietary treatments were observed, and equally no significant differences in FCR were observed at the later phase. These results suggest that the levels of host DNA content in faeces may be a useful method for assessing gut cell losses and their impact on feed efficiency. However, this relies on the assumption that host DNA in faeces originates only from cell sloughing in the gastrointestinal tract, which is yet to be confirmed.
Faecal CALP levels are a recognised measure of intestinal inflammation and have been widely studied in humans (Fagerberget al.,2005). However, fewer studies have been carried out in animals. Lallès and Fagerhol (2005) determined reference values for faecal CALP levels in pigs of different ages and lactation stage but the present study has assessed dietary intervention of newly weaned piglets. Pig faecal CALP was significantly higher at day 14 of the trial compared with day 28, with no influence of the YPC diet. Previous studies have shown that dietary inclusion of chitosan can reduce faecal CALP and therefore intestinal inflammation in pigs (Xiao,et al.,2014), but the YPC had no effect in the present study. The only differences in pig faecal CALP concentration (ng/ml) were caused by the age of the animal (day 14>day 28), whereas differences in pigCYTBDNA were caused by diet. This shows that the pigCYTBDNA content is unrelated to the levels of CALP in the faeces, which is a marker of inflammation. Conversely, Varelaet al.(2009) found a signifi-cant, but weak, correlation between human faecal DNA content and CALP content and hypothesised the weak rela-tionship was due to the different origins of the markers.
In conclusion, dietary YPC positively influenced FCR in newly weaned piglets and reduced faecalCYTBDNA content, suggesting that faecal CYTBDNA content may be a novel non-invasive measure of gut cell losses. However, further work is required to elucidate the origin of the faecal host DNA and determine how sensitive the faecal DNA assay is. These experiments will form the basis for validation studies where the DNA assay will be compared with established methodologies.
Acknowledgements
This work was supported by a PhD studentship for KRS funded by AB Vista and the University of Nottingham and
funding from AB Agri Limited and AB Vista. Preliminary results have been published in an abstract form (Slinger et al.,2018).
K. R. Slinger, 0000-0002-7417-165X
A. H. Stewart. https://orcid.org/0000-0003-0309-5343 T. Parr, 0000-0003-2490-9457
J. M. Brameld, 0000-0003-4942-080X
Declaration of interest
There is no conflict of interest.
Ethics statement
Experimental protocol was approved by the Harper Adams University Research Ethics Committee. Ethical approval number: 00583940-STAFF-1-201607.
Software and data repository resources
None of the data were deposited in an official repository.
Supplementary material
To view supplementary material for this article, please visit
https://doi.org/10.1017/S1751731119000818.
References
Ariefdjohan MW, Savaiano DA and Nakatsu CH 2010. Comparison of DNA extraction kits for PCR-DGGE analysis of human intestinal microbial commun-ities from fecal specimens. Nutrition Journal 9, 23. doi: 10.1186/1475-2891-9-23.
Baskin KK and Taegtmeyer H 2011. Taking pressure off the heart: the ins and outs of atrophic remodelling. Cardiovascular Research 90, 243–250. Boonseub S, Johnston G and Linacre A 2012. Identification of protected avian species using a single feather barb. Journal of Forensic Sciences 57, 1574–1577. Bregendahl K, Liu L, Cant JP, Bayley HS, McBride BW, Milligan LP, Yen J-T and Fan MZ 2004. Fractional protein synthesis rates measured by an intraperitoneal injection of a flooding dose of L-[ring-2H5]phenylalanine in pigs. The Journal of Nutrition 134, 2722–2728.
Buttery PJ 1981. Protein turnover in animals. Tropical Animal Production 6, 204–213.
Caldwell JM, Patment P and Villemur R 2011. Mitochondrial DNA as source tracking markers of fecal contamination. In Microbial source tracking: methods, applications, and case studies (ed. C Hagedorn, AR Blanch and VJ Harwood), pp. 229–250. Springer, New York City, NY, USA.
Creamer B, Shorter RG and Bamforth J 1961. The turnover and shedding of epithelial cells. Gut 2, 110–116.
Fagerberg UL, Lööf L, Myrdal U, Hansson L-O and Finkel Y 2005. Colorectal inflammation is well predicted by fecal calprotectin in children with gastrointes-tinal symptoms. Journal of Pediatric Gastroenterology and Nutrition 40, 450–455.
Fairbrother JM, Nadeau É and Gyles CL 2005.Escherichia coliin postweaning diarrhea in pigs: an update on bacterial types, pathogenesis, and prevention strategies. Animal Health Research Reviews 6, 17–39.
Gasier HG, Fluckey JD and Previs SF 2010. The application of2H
2O to measure
skeletal muscle protein synthesis. Nutrition & Metabolism 7, 31. doi:10.1186/
1743-7075-7-31.
Gill M, Smith P and Wilkinson JM 2010. Mitigating climate change: the role of domestic livestock. Animal 4, 323–333.
Halder S, Ghosh TK, Toshiwati and Bedford MR 2011. Effects of yeast (Saccharomyces cerevisiae) and yeast protein concentrate on production of broiler chickens exposed to heat stress and challenged withSalmonella enter-itidis. Animal Feed Science and Technology 168, 61–71.
Lallès J-P and Fagerhol MK 2005. Faecal calprotectin: a non invasive marker of inflammation in pigs? ISAH 1, 405–408.
Loretz B, Föger F, Werle M and Bernkop-schnürch A 2006. Oral gene delivery: strategies to improve stability of pDNA towards intestinal digestion. Journal of Drug Targeting 14, 311–319.
Martellini A, Payment P and Villemur R 2005. Use of eukaryotic mitochondrial DNA to differentiate human, bovine, porcine and ovine sources in fecally contaminated surface water. Water Research 39, 541–548.
McOrist AL, Jackson M and Bird AR 2002. A comparison of five methods for extraction of bacterial DNA from human faecal samples. Journal of Microbiological Methods 50, 131–139.
Mieszkin S, Furet J-P, Corthier G and Gourmelon M 2009. Estimation of pig fecal contamination in a river catchment by real-time PCR using two pig-specific
Bacteroidales 16S rRNA genetic markers. Applied and Environmental Microbiology 75, 3045–3054.
Muthusamy S, Haldar S, Ghosh TK and Bedford MR 2011. Effects of hydrolysed
Saccharomyces cerevisiaeyeast and yeast cell wall components on live perfor-mance, intestinal histo-morphology and humoral immune response of broilers. British Poultry Science 52, 694–703.
Ram ´on-Laca A, Soriano L, Gleeson D and Godoy JA 2015. A simple and effective method for obtaining mammal DNA from faeces. Wildlife Biology 21, 195–203.
Roperch J-P, Benzekri K, Mansour H and Incitti R 2015. Improved amplification efficiency on stool samples by addition of spermidine and its use for non-invasive detection of colorectal cancer. BMC Biotechnology 15, 41. doi: 10.1186/s12896-015-0148-6.
Roto SM, Rubinelli PM and Ricke SC 2015. An introduction to the avian gut micro-biota and the effects of yeast-based prebiotic-type compounds as potential feed additives. Frontiers in Veterinary Science 2, 28. doi:10.3389/fvets.2015.00028. Slinger KR, Stewart AH, Hall H, Masey O’Neill HV, Bedford MR, Brameld JM and Parr T 2018. The effects of exogenous yeast enriched protein concentrate from the bio-ethanol industry (YPC) on pig cytochrome b (CYTB) genomic DNA content in faeces. Advances in Animal Biosciences 9, 37.
Varela E, Antolín M, Guarner F, Verges R, Giralt J and Malagelada J-R 2009. Faecal DNA and calprotectin as biomarkers of acute intestinal toxicity in patients undergoing pelvic radiotherapy. Alimentary Pharmacology and Therapeutics 30, 175–185.
Vincent C, Mehrotra S, Loo VG, Dewar K and Manges AR 2015. Excretion of host DNA in feces is associated with risk ofClostridium difficileinfection. Journal of Immunology Research 2015, 246203. doi:10.1155/2015/246203.