Vol.9 (2019) No. 3
ISSN: 2088-5334
Detection of Scratches on Cars by Means of CNN and R-CNN
Cesar G. Pachón-Suescún
#1, Javier O. Pinzón-Arenas
#2, Robinson Jiménez-Moreno
#3 #Department of Mechatronics Engineering, Nueva Granada Military University, Bogotá D.C, 110111, Colombia E-mail: 1cgpachon23@gmail.com; 2u3900231@unimilitar.edu.co; 3robinson.jimenez@unimilitar.edu.co
Abstract
—
Failure detection systems have become important not only in production processes, but nowadays there is a need for their implementation in various daily areas, for example, for the detection of physical damages that a car may present in a parking lot, in order to provide to the client with the assurance that their personal property will not be affected inside the lot. This paper presents an algorithm based on convolutional neural networks and a variant of these using regions (CNN and R-CNN), which allows to detect scratches in a car. In the first instance, the capture of one of the sides of a conventional car is done, an R-CNN is designed to extract only the region of the image where the car is located. After this procedure, the extracted region is divided into multiple sections, and each of the sections is evaluated in a CNN to detect in which parts of the vehicle the scratches are located. With the test images, a precision percentage of 98.3% is obtained in the R-CNN, and 96.89% in the CNN, demonstrating in this way the robustness of the Deep Learning techniques implemented in the detection of car scratches. The processing times of each one of the algorithm stages corresponding to the R-CNN and the classification of the sections in the CNN were 1.6563 and 1.264 seconds respectively.Keywords— convolutional neuronal network; RoI; scratch detection; quality control.
I. INTRODUCTION
The development of autonomous quality inspection systems of different types of products and the detection of damage to them have become important in the applied research of machine intelligence systems. A system comparison is presented to evaluate the quality of fruits and vegetables based on machine vision, such as hyper and multi-spectral analysis, where results are obtained with 90 and 86% accuracy respectively, highlighting that the use of hyperspectral systems is not viable for real-time implementations [1]. On the other hand, in another study, machine vision techniques are presented that, with the help of a system based on artificial neural networks, allow the identification of up to four types of typical physical damage that occur in the production of thermal fuses [2].
A system to identify marks in tires is implemented, obtaining precision percentages of up to 90% using ground clearance techniques, highlighting the importance of the implementation of automatic inspection systems based on machine vision to reduce the times compared to what could take a person [3]. Another study found a system to detect minor damages on the surface of vehicles achieved by implementing a network of adaptive sensors with which they can get to detect scratches on vehicles, based on an estimate of vibrations, highlighting the implementation of vehicle damage detection systems in applications such as renting
cars to verify the integrity of the vehicle once a customer returns it [4].
Since 2012, systems for detection and identification by machine vision have become important with the implementation of artificial intelligence techniques, specifically with Deep Learning techniques, where one of these are the convolutional neural networks (CNNs) which allow the automatic extraction of characteristics in the images. It should be noted that CNNs are not a new method; in 1989, one of their first applications is presented oriented to the identification of written numbers [5]. But it was until 2012 that they became important, where a CNN called Alexnet [6] was presented, which in the ImageNet competition obtained a 15.3% error in the classification of 1000 categories, considerably exceeding the percentage obtained by classical machine vision techniques.
R-CNN
CNN
a
b
c
d
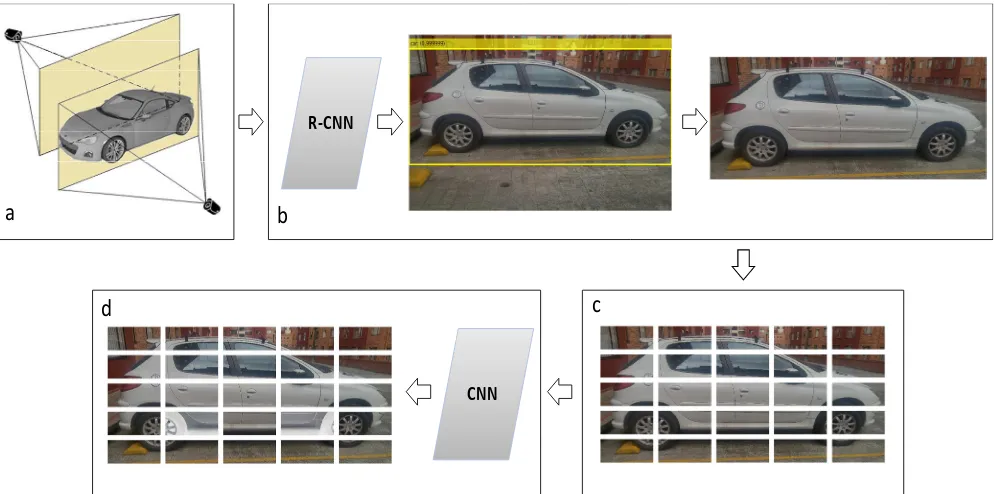
Fig. 1 Process of the scratch detection algorithm in a car. the extraction of traffic signals in order to subsequently
perform a processing to highlight their characteristics and to have a database with which to train the CNN [14].
This article seeks to evaluate the accuracy of CNN for the task of detecting scratches in cars, which may have applications in the automotive industry or video surveillance of vehicles. In the first instance, implementing an R-CNN, the region of interest (RoI) is detected, in this case, it is the car. Then the vehicle is extracted from the image; later this
of the car in the image, to extract the car and avoid analyzing areas such as the ground or part of the background in later processes, which are not of interest for the case study (see Fig. 1b). Once the vehicle is taken from the image, it is divided into multiple sections (see Fig. 1c), these are entered into a CNN, and it performs the classification into the corresponding categories "section with a scratch" and "section without a scratch" (see Fig. 1d).
A. R-CNN Database
The database for this stage is made up of 380 images of cars with a resolution of 2340x4160 pixels, of which 84.21% will be used for training (320 images) and 15.79% for tests (60 images). To perform the training of the R-CNN, the images are resized at a resolution of 126x224 pixels, this
B. Architecture and Training Options of the R-CNN
The R-CNN is composed of two main stages. In the first one, a region proposal algorithm based on that developed in [15] called Edge Boxes is applied to the input image. This algorithm generates bounding boxes in the image, comparing the number of edges that are inside it with those of the labeled region, to find proposed regions that contain the object that is being searched. Based on the minimum size of
the labels in the training images, the proposed region found is resized to a size of 64x128 pixels in RGB color scale, to be entered into the second stage corresponding to CNN. The architecture of CNN has five layers of convolution, three of Maxpooling, two of Fully-Connected, and as a last layer, a Softmax type normalization function is set, that allows to show in the percentage of the membership values obtained in the membership functions (see Fig. 3).
In this case, the R-CNN is used only to detect the vehicle and have its location in the image, which is why the output categories in the network correspond to the car and the background. In [16], the operation of each of the layers of a CNN is shown, where deconvnet techniques are implemented to visualize the behavior in the layers.
In the training options of the R-CNN, a Learning Rate of 0.0001 is set, the batch size is set to 32, in this way there are 10 iterations per epoch, where each batch corresponding to 10% of the total size of the training database. Based on training tests, 200 epochs are established, being sufficient to obtain adequate learning in the network, obtaining high accuracy in the recognition and location of vehicles.
C. R-CNN Training
In Fig. 4, the training of the R-CNN is shown, in the upper graph, the Y-axis corresponds to the percentage of accuracy of the test images and the X-axis to each of the epochs. In the lower graph, the Y-axis corresponds to the losses in each batch and the X axis to the training epochs. In the last epoch with the training images, 100% accuracy was achieved with a loss cost of 0.034.
To check the correct functioning of the R-CNN, the 60 images of the test database are evaluated. In Fig. 5, the confusion matrix corresponding to the test images is presented, in its diagonal are the images correctly classified and outside it those that were confused with the background. Only one of the 60 images were classified one incorrectly, obtaining a 98.3% accuracy in the test.
a
b
Fig. 2 Sample of the database for the R-CNN.
Fig. 3 Architecture of the R-CNN, where S refers to the Stride.
In Fig. 6a, it can be seen the bounding box and the degree of membership obtained in one of the training images. To extract only the car from the original image, the dimensions of the box are divided by a factor of 0.054, this value being initially used to reduce the images. In Fig. 6b the box delimiting the car is shown in the original image. Once the RoI is in the original image, this section of the image is extracted (see Fig. 6c).
D. CNN Database
In the previous stage with the R-CNN, it is possible to extract from the captured image only the car (RoI). It is decided to divide the RoI into multiple sections (see Fig. 7a), since, if a CNN were trained with the complete vehicle,
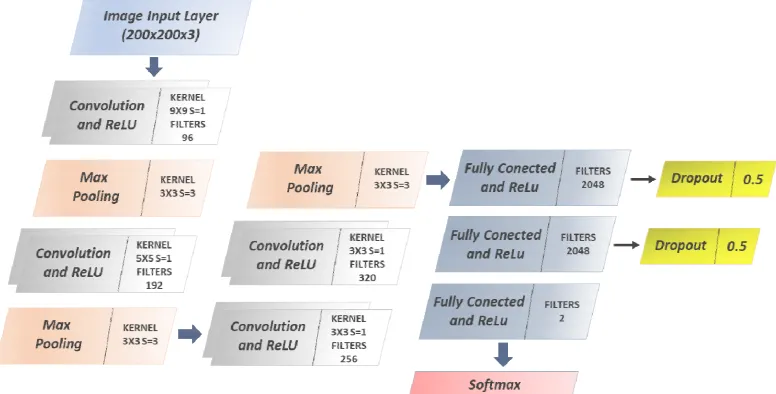
E. CNN Architecture and Training Options
In Fig. 8, the architecture designed for CNN is shown, where a size of 200x200 pixel with three channels (RGB) is set as input, this input size is selected based on the dimensions of each of the vehicle sections. The architecture consists of 4 convolutional layers, 3 of Maxpooling and 3 Fully-Connected, for the normalization of the values obtained from the membership functions, just like the R-CNN, a Softmax type function is implemented. An important part in the design of architectures is the generalization of the characteristics, i.e. CNN does not memorize the images to avoid over-training in the network, why a Dropout layer is used in the first two Fully-Connected at with a 50% of disconnection, in this way, half of the neurons are disconnected and a better generalization of the CNN is performed.
Fig. 7 Sample of the CNN database built. Fig. 5 Confusion matrix of the R-CNN, where 0 = background / 1 = car.
In the training options of CNN, the Learning Rate is set to 0.0001. The size of the batch is set to 11, to reduce the load on the GPU and have better results in the optimization of the stochastic gradient descent as mentioned in [17], where it is advisable to keep values between 2 to 32 for the sizes of the batch. Based on training tests, 150 epochs are set, being enough to obtain results with a high accuracy percentage.
III.RESULTS AND DISCUSSIONS
A. CNN Training
In Fig. 9, the training of CNN is shown. In the upper graph, it is presented the accuracy in the classification of the training images in each of the periods. In blue color the checks of the training images are presented and the black points are of the validations. 100% accuracy was obtained in the last epoch with the training images and 98.19% with the validation images. The lower graph shows the losses by epoch, in orange the losses are with the training images and the black points correspond to the validations, where losses of 0.0381 and 0.0498 are gotten in the last period, respectively.
To check the correct classification made by CNN trained, 1551 images of vehicle sections are classified, of which 619 contain scratches and 932 no. Based on the results obtained in the classification, a confusion matrix is implemented for the clear visualization of the results, as shown in Fig. 10. In its blue diagonal are the images that were correctly classified and, outside of this diagonal, which were confused with the other category. 95.48% of the images with scratches were classified in their category and 98.31% of those that did not contain scratches were classified correctly, based on the above, an average accuracy percentage of 96.89% was obtained for CNN.
B. Positive and Negative Classifications
In the confusion matrix of the test images, it is observed that 28 images of the category of sections with scratches and 12 of sections without scratches were misclassified. In Fig. 11, some of the cases in which the classification done by the CNN was correct or incorrect are shown. In the sections that have scratches and were classified incorrectly, the most common cases occur when the scratches are confused by their color with part of the vehicle. In the sections without scratches classified in the wrong category, most cases occur in the sections where the bottom and part of the vehicle are seen, or because of reflection in the sides or windows. Fig. 8 Architecture of CNN, where S refers to the Stride.
Fig. 9 CNN training.
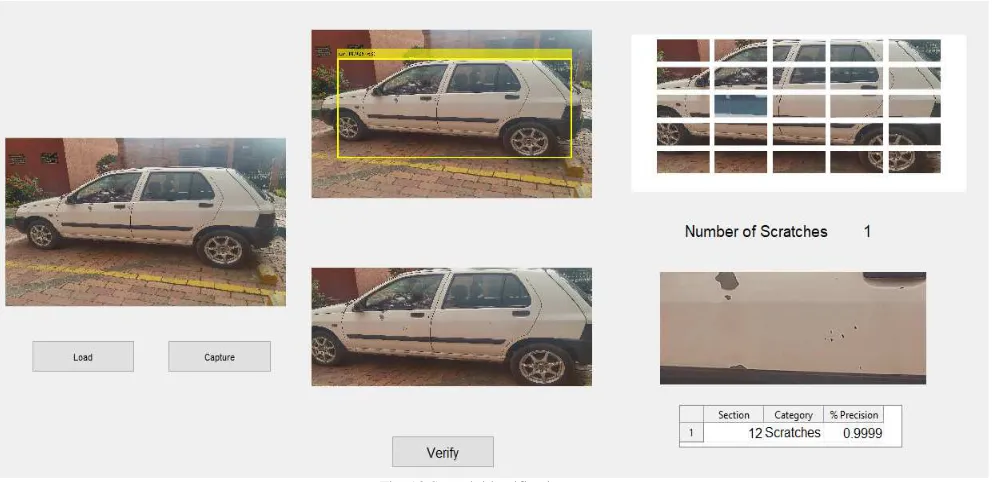
Fig. 12 Graphic user interface.
C. Graphics User Interface
A graphic user interface is designed, which allows concatenating the process of identification of scratches in cars (see Fig. 12). In section a, it can be loaded an image of a car database or capture it directly from the camera, to be later shown in this section. In section b in the upper part, the RoI detected by the R-CNN is shown in the image and, in the lower part, there is the extracted region. Section c shows the region divided into multiple sections, highlighting the areas that CNN identified as having scratches and showing the total number of affected sections in the vehicle. Finally,
by clicking on one of the sections of the vehicle, in section d, it can make a better visualization of the selected part, and the table shows the selected section, the category to which it belongs and the percentage of accuracy obtained in that category.
In Fig. 13, another test case is presented in the graphic user interface, the car is divided, but in this case, the region of interest generated is not precise enough and when the vehicle is removed part of the frontal area is lost. A scratch is detected which, when selected, presents an accuracy of 99.99% in its category.
Without Scratch Without Scratch
D. Processing Times
Table 1 shows the processing times of the algorithm in each of the stages. In the stage of detection of the RoI and extraction of this, an average time of 1.6563 seconds is presented, the stage of sectioning of the vehicle and classification of the 25 sections of the car in the CNN presents a time of 1.264 seconds.
TABLEI PROCESSING TIMES
R-CNN CNN Total Execution Time Time (s) 1.6563 1.2640 2.9203
IV.CONCLUSIONS
The design and implementation of an R-CNN avoid the analysis of areas that are not of interest in the image, obtaining in this stage accuracy of 98.3% in the identification of the vehicle. Also, combined with the division of the region of interest and the use of a CNN, when performing the analysis of sections of the vehicle facilitates the identification and detection of the characteristics of the scratches, obtaining a 96.89% accuracy in the test performed.
When making the classification of the sections in their respective category, there were a few error cases, representing only 3.11%. For the most part, the error cases were due to the reflection that some cars had in the windows or lateral zones, so a possible way to mitigate the errors in these cases is to expand the database with more images of cars that present similar characteristics. Another of the most common cases of error, occurs when the scratches by their color are confused with the surface and are not detected. A possible solution is a preprocessing to highlight the characteristics of the rayon or implement a CNN with DAG structure that allows increasing the depth of the network to
learn a greater number of characteristics without highly compromising the processing times.
The average execution time of the algorithm in the graphic user interface was 2.9203 seconds, in case of an implementation in real environments such as parking to ensure the customer the integrity of your vehicle, times are reasonable. But in the case of implementation in an automotive industry for quality management, it may be necessary in the first stage to implement a Faster R-CNN architecture instead of an R-CNN, giving a reduction in processing times.
ACKNOWLEDGMENT
The authors are grateful to the Nueva Granada Military University, which, through its Vice chancellor for research, finances the present project with code IMP-ING-2290 (being in force 2017-2018) and titled "Prototype of robot assistance for surgery", from which the present work is derived.
REFERENCES
[1] B. Zhang, W. Huang, J. Li, C. Zhao, S. Fan, J. Wu and C. Liu, “Principles, developments and applications of computer vision for external quality inspection of fruits and vegetables: A review,” Food
Research International, vol. 62, pp. 326-343, 2014. doi:
10.1016/j.foodres.2014.03.012.
[2] T. Sun, F. Tien, F.Chih and R. Kuo, “Automated thermal fuse inspection using machine vision and artificial neural networks,”
Journal of Intelligent Manufacturing, vol. 27, no. 3,pp. 639-651,
2016. doi: 10.1007/s10845-014-0902-y.
[3] A. Dias, M. Silva, N. Lima and R. Guedes, “Identification of marks on tires using artificial vision for quality control,” International
Journal for Quality Research, vol. 9, no. 1, pp. 27-36, 2015.
[4] S.Gontscharov, H. Baumgärtel, A. Kneifel and K. Krieger, “Algorithm Development for Minor Damage Identification in Vehicle Bodies Using Adaptive Sensor Data Processing,” Procedia
Technology, vol. 15, pp. 586-594, 2014. doi:
10.1016/j.protcy.2014.09.019.
3, pp. 690-703, 2017. doi: 10.1109/TNNLS.2016.2522428.
[9] R. Qian, Q. Liu, Y. Yue, F. Coenen and B. Zhang, “Road surface traffic sign detection with hybrid region proposal and fast R-CNN,” in 2016 12th International Conference on Natural Computation,
Fuzzy Systems and Knowledge Discovery (ICNC-FSKD), 2016, pp.
555-559. doi: 10.1109/FSKD.2016.7603233.
[10] B. Huynh, H. Li and M. Giger, “Digital mammographic tumor classification using transfer learning from deep convolutional neural networks,” J. of Medical Imaging, vol. 3, no. 3, p.034501, 2016. doi: 10.1117/1.JMI.3.3.034501.
[11] S. Arnold and K. Yamazaki, “Real-time scene parsing by means of a convolutional neural network for mobile robots in disaster
604-613, 2018. doi: 10.1007/978-3-319-75420-8_57.
[15] C. L. Zitnick and P. Dollár, “Edge boxes: Locating object proposals from edges”, in European Conference on Computer Vision, Springer, Cham, 2014, pp. 391-405. doi: 10.1007/978-3-319-10602-1_26. [16] M. Zeiler and R. Fergus, “Visualizing and Understanding
Convolutional Networks,” in European conference on computer
vision, Springer, Cham, 2014, pp. 818-833. doi:
10.1007/978-3-319-10590-1_53.