TOURISM IN THE CROATIAN ADRIATIC
Hrvoje CARIĆ, MSc* Review article**
Institute for Tourism, Zagreb JEL: Q5
hrvoje.caric@iztzg.hr UDC: 574.3
Abstract
Cruise tourism is one of the fastest growing sectors of the tourism industry and one that has significant environmental, economic and social impacts on target destinations. Yet, tourism decision makers, developers and managers rarely incorporate or estimate environmental impacts in their tourism development planning. Indeed, the analysis of the resulting resource exploitation is rarely undertaken until carrying capacity is breached and attractiveness diminished. In this article an assessment is offered that determines, qu-antifies and financially estimates emissions and waste streams so they can be compared with the direct income generated to the local economy by cruising tourism. It is applied to the Croatian part of the Adriatic and financially evaluates environmental impacts, ar-guing that they are negative externalities due to inappropriate internalization and mana-gement. The purpose of the assessment is to give a “snapshot” of the situation, and also to create the groundwork for a model that will assist decision makers and stakeholders, at different levels and of different interests, to prevent and reduce the ecological, health and economic risks associated with dead-end tourism development.
Key words: valuation of environmental effects, environment and development, tourism, pollution control adoption costs, externalities
* The author would like to thank two anonymous referees for their useful comments and suggestions. Also thanks to colleagues from: Institute for Tourism, Ruđer Bošković Institute, Institute of Oceanography and Fisheries, Faculty of Economics of Split University, Blue World Institute of Marine Research and Conservation.
1 Introduction
The development of infrastructure, consumption of local resources and the creation of waste are all obvious signs of the environmental effect of tourism (Butler, 1991). The environment of tourism destinations is generally considered to be an open-access system, where multiple users gain advantage from the use of resources and may affect the envi-ronment without being held responsible. Sustainable tourism (ST) is a term that has emer-ged as a reaction to negative effects of tourism on the environment and local communities; it now dominates the discourse of tourism development (Hunter and Green, 1995). Given that the term emerged from the concept of sustainable development (SD), it has inherited its vague, superficial and diverse interpretations. This has resulted in diverse uses of the term in practice and in understanding, evident from its use in various planning, scientific and other policy documents (Hunter, 2002). Sustainable tourism is generally interpreted as a balance between tourist industry development and environmental protection, satis-fying the needs of both tourists and local people. However, in practice it remains unclear how to identify the level of environmental degradation that will compromise this balance. The model presented in the article aims to contribute to the clarification of this threshold level by allocating environmental indicators and related direct costs.
Cruising tourism has been promoted in the Croatian media as a possible vehicle for the development of more sustainable tourism in destinations. Although cruising has not been considered as having a major environmental effect, it does bring an additional form of tourism into the coastal zone. Questions remain over the extractive element of touri-sm, and the subsequent loss of environmental amenity values (Briassoulis, 2002; Ostrom et al., 1999). Although a single user may have little effect on the resource, cumulative use may significantly degrade it. This leads to the issue of admitted responsibility by users, a significant dilemma for addressing a problem that requires collective action (Hardin, 1968). In multiple-use tourism this may be exacerbated, particularly since some groups will be in conflict with and may not communicate with others. In this case it is impor-tant to identify and quantify the environmental effects of all forms of tourism. However, answering the question “what is the limit to the growth of tourism at a destination?” can prove to be very challenging for multiple users in complex arrangements. Yet it is possi-ble to examine them individually in a system with clear boundaries, inputs and outputs, such as cruising tourism.
The sudden growth of cruising tourism in the eastern Adriatic has created many dif-ferent perceptions of its economic effect. The dominant business logic is that cruise ships are a potential market for existing destinations. They present new tourism opportunities, especially beyond the peaks of the tourist season of July and August. This business logic makes sense in itself, but when integrated into the basic three dimensions of SD: econo-mic, social and environmental, it becomes obvious that this “business only” one-dimen-sional approach generates a huge burden for the environment and yields related negative externalities1 (Mowforth and Munt, 2003). In the fields of tourism and there marine
envi-1 Negative externality is defined by Črnjar as any “...impact on any economic activity of producers, consumers or
ronment there is very little or no available literature or information on negative externali-ties. Accordingly, this paper offers the calculation of direct pollution costs as the first rea-sonable step in the direction of the understanding of negative impacts and a possible indi-cation of related externalities, therefore providing a contribution to the emerging field.
2 Methodology
The assessment presented in this paper will review selected environmental impacts and related direct pollution costs (DPC) of cruising tourism in the Croatian context thro-ugh the following steps:
• determination of pollution aspects and externalities • estimation of pollution quantities and direct pollution costs
• comparing direct pollution costs with direct income from cruise tourism.
The first stage determines environmental impacts2 using available research (scientific and expert literature) and discusses the existing environmental protection mechanisms in the Croatian context to identify their efficiency. The second stage uses official statistics on total tourism activity to calculate the cumulative values of total pollution for a given region in a given time-frame. A monetary evaluation is then conducted by multiplying the total pollution figures with existing calculations of market prices for environmental ma-nagement services available in the Croatian and EU markets. Finally, the DPC are com-pared with the previously calculated direct income (Institute for Tourism, 2006) accruing to the local economy from cruising tourism.
Therefore, the purpose of this model is to help prevent Hardin’s tragedy of the com-mons through a DPC assessment that aids decision making or development scoping pro-cesses. It complements the following methodologies, concepts, practices and principles: • Cost Benefit Analysis in Environmental Impact Assessment (MZOPU, 2000:
Ar-ticle 5; UNEP, 2002:272; Hundloe, 1990).
• An “engineering approach” that measures pollution control legislation implementa-tion costs, US Environmental Protecimplementa-tion Agency (in Goodstein, 2003:149-152). • Environmental management strategies and systems3 and a life cycle assessment
approach that calculate mass flows and allocate pollution costs in a production pro-cess.
• Carrying capacity in tourism “...the maximum number of people that may visit a to-urist destination at the same time, without causing destruction of the physical, eco-nomic and socio-cultural environment and an unacceptable decrease in the quality of visitors’ satisfaction” (PAP-RAC, 1997).
2 Literature used in this article that analyzes environmental impacts of “cruise ship” generally refers to those
vessels with 1,500 to 3,000 guest capacities and crew capacities of 400-1,200 persons.
3 This is directly related to a variety of concepts/approaches: Environmental Engineering and Technology,
• Precautionary principle: “When an activity raises threats of harm to human health or the environment, precautionary measures should be taken even if some cause-and-effect relationships are not fully established scientifically” (Hayes, 2005)4.
3 The assessment
3.1 Determination of pollution aspects and negative externalities
The available literature describes the intensity of cruise ship pollution as signifi-cant (Clark, 1986), and potentially damaging to the attractiveness of the target destinati-on (Klein, 2008). Although the public reactidestinati-on to cruisers is not the subject of this paper, there is growing evidence of opposition to cruisers (Bluewater, 2000). The opposition is based on the premise that cruise ship tourism is neither environmentally sound nor res-ponsible, the fear being that once the environmental quality and attractiveness of a desti-nation is degraded, cruisers can simply move on to the next port. This flexibility and the lack of long-term commitment make cruise tourism a new and unique phenomenon in both tourism and environmental management. The environmental management perspec-tive analyzed here will show that cruisers do represent a new aspect of environmental im-pact. Pollution aspects analyzed in this section are: solid waste, air pollution, waste wa-ters, and hazardous waste.
Each environmental impact is discussed to clarify and quantify an indicator that will be applied to the Croatian context.
3.1.1 Solid waste
Solid waste consists of around 75-85% inorganic waste and 15-25% organic waste. The content of the solid waste generated from the cruisers is similar to that found in hou-sehold and communal waste, i.e. paper, plastic, glass, food, and kitchen waste. Estimates vary on the amount of daily waste produced per passenger. The US Environmental Pro-tection Agency (US EPA) reports two figures, the first from cruise companies that claim production to be 0.3 to 0.8 kg/person/day. The second from independent sources suggest a higher figure of 2.6 to 3.5 kg/person/day (US EPA, 2008). Yet the Carnival Corporati-on published the much higher figures of 13.4 to 16 kg/persCorporati-on/day (Carnival CorporatiCorporati-on, 2007). Generally average figures suggest an estimate of 2.4 to 4 kg/person/day (Herz and Davis,2002; Klein, 2003; Commoy et al., 2005; Cohen, 2008). Taking these figures, a week long cruise generates over 50 tonnes of solid waste (Nowlan and Kvan, 2001).
In international waters, ships dispose of the organic portion of solid waste by grin-ding it and throwing it overboard. Shipping in general produces approximately one milli-on tmilli-onnes of organic waste per year, 24% of which originates from cruisers (NRC, 1995). There is evidence that this practice also involves other inorganic waste. In new
generati-4 The principle is the basis for European Environmental Law (EC, 2000), Rio Declaration (Principle 15),
on cruisers inorganic waste is incinerated and the ash disposed at sea, whilst in older ships inorganic solid waste is landed ashore (Copeland, 2008).
In general waste management in Croatia is in a transitional phase. Currently activi-ties and policies focus on the removal of illegal land-fills and the establishment of a sy-stem that will eventually recycle and treat most household and communal waste (CRO EPA – Croatian Environmental Protection Agency, 2007). Although the current waste management system invoices its users, cruisers included, the application of the “pollu-ter pays” principle does not provide sound environmental protection, therefore is a nega-tive externality.
3.1.2 Air pollution
Generally air pollution has a direct and serious effect on human health (Energy Fo-undation, 2001). Growing research shows increased risk from lung cancer and asth-ma among children due to transport emissions (Nafstad et al., 2003; Lee et al., 2006; Vineis et al., 2006). In addition, air pollution may have a local smog effect, a regional effect on acid rain, and a global effect with climate change. Air pollution effects such as acid rain, acidification of lakes and seas, and climate change have triggered an array of research and analysis that has identified transport as one of the most significant causes (Hunter and Shaw, 2006).
Air emissions from cruisers vary significantly in intensity and composition, depen-ding on the quality of fuel used, engine quality, speed, manoeuvring, and electricity pro-duction. Most cruisers use cheap fuels rich in sulphur which is up to 1,000 times “dirtier” than the fuel used in road transport (TRT – Trasporti e Territorio Srl, 2007). Ship emissi-ons cemissi-onsist of mainly NOx, SOx, and COx gases, and suspended particles. A study of re-gional air pollution showed that ship emissions create cancer risks of more than 100 in 1 million for the Los Angeles and Long Beach port areas (South Coast AQMD, 2008). An analysis conducted for shipping transport in Vancouver harbour concluded that ship tran-sportation emissions contribute 58% of greenhouse gases, and 95% of sulphur emissions of the region (Klein, 2003). A Santa Barbara study showed that in their region shipping emits 37% of total nitrogen oxide, and that this will increase to 61% by 2015 (Copeland, 2008). The Carnival Corporation report that on average there is a release of 637kg of CO2 per cruise ship kilometre or 0.35 kg CO2 per passenger kilometre (Carnival Corporation, 2007). On average the number of passengers on a Carnival ship is 1,776, which produ-ces an emission calculation of 401g of CO2 per passenger per kilometre (Starmer-Smith, 2008). An overview of other emission quantities is presented below.
List of emission factors of medium-speed marine engines (Bennis, 2000).
Pollutant emission factor kg pollutant/ton fuel
Nitrogen oxides (NOx) 57.0
Particulate matter (PM) 1.2
Hydrocarbons (HC) 2.4
Carbon monoxide (CO) 7.4
Air pollution from cruisers also comes from the incineration of solid wastes. Although there is very limited information on this, it is clear that the new generation of cruisers will rely on this method as a priority waste management option thereby creating a new set of problems. The incineration of plastics has the potential for the release of toxic emissions such as dioxins and other dangerous particles (Carnival Corporation, 2007; RCI – Royal Caribbean International, 2009; Klein, 2003). Furthermore, in order to produce the ener-gy required for incineration, cruiser engines and generators will have to work more and produce more exhaust fumes. The global merchant shipping fleet is expected to triple in size by 2020 and the EU estimates that “emissions of SO2 and NOx from ships are a seri-ous concern, as they are expected to exceed those of all land-based sources in the EU by 2020” (EC, 2005, paragraph 4.2.2.3. Shipping). The cruising industry is expected to fo-llow the same trend with an emphasis on the construction of large cruisers increasing the problems of air pollution (Cruisepage, 2009).
At the moment neither international nor local law enforces any “polluter pays” princi-ple for ship air emissions, despite enforcement on land-based air polluting industries and transport. The dominant international legislative tool is Annex VI of the MARPOL Con-vention entitled “Regulations for the preCon-vention of air pollution from ships”. This con-vention has, however, been heavily criticised by environmental groups and experts due to low requirements and lack of effective mechanisms to guarantee significant improve-ments (Acidrain, 2008; Friedrich et al., 2007). Croatian legislation does not impose any restrictions or charges for cruiser air emissions, and therefore air pollution from cruisers can also be deemed a negative externality.
3.1.3 Waste waters
Ship waste waters pose a potential danger for both ecosystems and the humans that depend on them (British Columbia, 2001). Cruise ships recognize three types of waste water: black water – sewage from toilets; gray water – wastewater from sinks, showers, baths, washers, ship deck cleaning, swimming pools, saunas, etc.; and bilge water.
Each passenger produces between 20 to 40 litres of black water (Commoy et al., 2005; Cohen, 2008) and 120 to 451 litres of gray water daily (US EPA, 2008; Commoy et al., 2005; Klein, 2003). The release of organic nitrates and phosphates from gray or black waters may lead to eutrophication in enclosed seas, ports or bays leading to wide-spread floral and faunal die-off. Their contents may also include bacteria, pathogenic or-ganisms, heavy metals, and other materials (Kay, 1989; Rawlings, 1999; San Francisco Estuary Project, 2009). Generally only a few newer ships have onboard water treatment equipment and, according to inspections in Alaska, they are of questionable quality and efficiency. Gray water was found to have a high content of faecal coliform bacteria (FCB) and total suspended solids (TSS), and black water did not meet the US federal standards on either FCB or TSS (ADEC, 2001). Furthermore, residue from water treatment left in filters is usually a solid or sludgy residue and regarded as hazardous substance to be tre-ated accordingly.
appropriate port-side facilities in Croatia, most waste waters are unaccounted for and sho-uld be regarded as an externality.
The bilge is the part of the ship where oil, lubricants, cleaning chemicals and metal and glass shards collect. In order to maintain ship stability and eliminate potential hazardous conditions from oil vapours, bilge water must be periodically pumped out. Before pum-ping it is processed through an oily-water separator capable of producing an effluent with an oil content of less than 15ppm (ADEC, 2000). Estimates place the production of bilge water to be between 3.3 and 10 litres per person per day, dependent on the ship (Klein, 2003; ADEC, 2000). In addition to variations in quantities of bilge water produced, there are even more significant variations in bilge water toxicity concentration and content.
Although Croatia has official inspectorates responsible for this matter there is no pu-blished information on their procedures or findings. Due to the lack of information and abi-lity to estimate the risks the bilge water issue will be considered a negative externaabi-lity.
3.1.4 Hazardous waste
Hazardous waste on cruisers is a by-product of photo processing, laundry and dry cleaning, photocopying, general maintenance, medical services, and household chemi-cals, among other things. It is diverse, ranging from heavy metals such as lead and mer-cury, to hydrocarbons, chlorinated hydrocarbons, benzene, toluene and other hazardous materials (Commoy, 2005). Handling of hazardous waste should be done only by licen-sed shore facilities.
There is very limited information on the amounts of the hazardous waste produced on cruisers (US EPA, 2008). In their annual environmental report the Carnival Corporation state that average production is between 0.13 and 0.16 kg/person/day (Carnival Corpora-tion, 2007). This corresponds with other available figures of 0.098 litre/person/day (Co-mmoy, 2005). Other hazardous wastes that are often neglected are residues from waste water treatment and incineration. Invariably these are of a hazardous nature due to the con-centration of impurities from handling huge quantities of sewage or solid waste. There is little recorded information on the disposal of filter residue from cruiser waste water trea-tment plants. Furthermore, there is no information on the quality of the maintenance and control of the incineration and water purification equipment, although some reports claim mismanagement (Nowlan and Kwan, 2001).
There are companies in Croatia that deal with the disposal of hazardous waste. Yet the national system as a whole is at best inefficient; research suggests that only 42% of all hazardous waste is officially reported in Croatia (Kučar Dragičević et al., 2006). In absence of an effective system there is clear potential for the illegal disposal of us wastes without incurring costs by cruisers. It can therefore be concluded that hazardo-us waste is also a negative externality.
3.1.5 Environmental management practices
communicate care for the environment and a commitment to comply with environmental regulations. This claim is not, however, sufficient to determine the probability of unsound environmental behavior. In the 2003 the Californian EPA stated that “it would be impo-ssible for inspectors to track the disposal path of all onboard generated hazardous waste without cooperation of the cruise line” (EPA, 2008:4-6). The following section seeks to disclose the willingness of the cruise industry to follow rules, regulations and codes of conduct, regarding intentional pollution and illegally dumped waste.
In the period between 1993 and 1998 the US General Accounting Office recorded 104 cases of intentional illegal dumping of wastes from cruisers (General Accounting Office, 2000). In total the cruise industry was fined 30 million US dollars in this period (Nowlan and Kwan, 2001:5). In the ten year period from 1996 to 2006 the US government sued and fined cruisers in the amount of 100 million US dollars (Klein, 2003; Cohen, 2008). This suggests that there is an increasing trend to imposed fines on cruisers, which may in-dicate an increasing willingness on the part of ships to pollute intentionally and risk being fined. In this regard the following cases illustrate the illegal and intentional environmen-tal misconduct of global cruising companies (Cruise Junkie, 2006; Cohen,2008; Dobson and Gill, 2006), some of which visit the Adriatic:
• Royal Caribbean was charged in 1999 on 21 counts of tampering with log books, illegal dumping and the obstruction of justice.
• Norwegian Sun admitted dumping 60,000 litres of sewage in the straits of Juan de Fuca.
• Carnival Cruise Lines was convicted of dumping oily sludge and tampering with a log book in 2002.
• Holland America’s Westdam cruiser was caught dumping black/gray waters, then later dumping 76,000 litres of wastewater sludge in Juneau harbor in 2001. • Cristal Cruisers broke a local agreement by discharging 136,000 litres of
wastewa-ters in the Monterey Bay protected area in 2003.
• Close to Miami Norwegian Cruisers dumped hundreds of litres of oily sludge that consisted of toxic and carcinogenic substances. They subsequently paid a one mi-llion US dollar fine in 2003.
This is significant because if cruisers are willing to take risks in US waters, which are considered to be one of the most effectively monitored maritime systems, then it does not bode well for cruiser practices in lesser controlled regions, such as the Croatian Adriatic. As yet there has been no public information of similar pollution practices in the Adriatic, and no prosecutions for illegal waste dumping. However the monitoring and enforcement of the Croatian Coast Guard has not been fully operational.
3.2 Estimation of pollution quantities and direct pollution costs
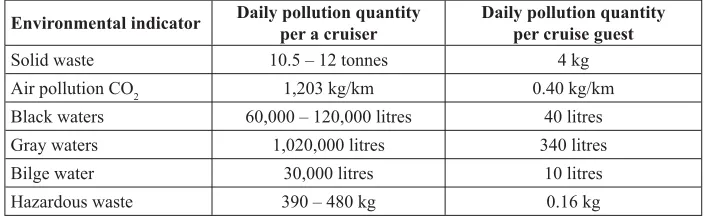
Table 1: Review of environmental indicators, daily pollution quantities for a cruiser of 3,000 guest capacity
Environmental indicator Daily pollution quantity per a cruiser
Daily pollution quantity per cruise guest
Solid waste 10.5 – 12 tonnes 4 kg
Air pollution CO2 1,203 kg/km 0.40 kg/km
Black waters 60,000 – 120,000 litres 40 litres
Gray waters 1,020,000 litres 340 litres
Bilge water 30,000 litres 10 litres
Hazardous waste 390 – 480 kg 0.16 kg
Source: Author’s calculation.
Direct pollution cost calculation
Based on the above indicators, this section will propose calculations of direct pollu-tion cost (DPC). Cost estimapollu-tions are generated from available government reports (see calculations of air pollution in TRT, 2007) and price lists of companies providing related waste management services in the European Union and Republic of Croatia. This finan-cially weighted DPC is then calculated into the actual cruising tourism activity so it can be compared with the direct revenues of cruising tourism.
Figures of cruising tourism activity in Croatia in 2007 (CBS, 2008) are: 1) 694,104 cruise guests entered Croatia;
2) Average stay was 1.6 days;
3) 1,110,566 guest days in the year calculated by multiplying 1 and 2; 4) There was a 16.1% increase of cruise activity from 2006 to 2007.
3.2.1 Solid waste management costs
In Croatia waste management charges vary, but a typical coastal town charges 0.408 HRK/kg (0.057 Eur/kg5) (Komunalni servis d.o.o., 2008). This figure is then multiplied with 4 kg/day production of waste (Table 1) and 1.1 million guest days in a year, giving a Croatian waste DPC of 253.7 thousand euro.
EU waste management charges also vary significantly. For the purpose of this study the costs from neighbouring Italy were used. The price is 0.15 Eur/kg (Hogg, 2002), and using the formula above, the EU waste DPC would be significantly higher at 666.3 tho-usand euro.
According to the official statistics, cruisers visiting Croatia in 2006 were charged 118.4 thousand euro for waste management (Institute for Tourism, 2006). Given the 16% growth in cruise activity from 2006 to 2007, this charge for 2007 would be approxima-tely 137.3 thousand euro. Comparing this figure with the above Croatian waste DPC of
253.7 thousand the difference is 116.4 thousand euro, almost 50%. This also serves as an indication that much of the waste produced is not treated within Croatian waste manage-ment systems as estimated by CRO EPA (CRO EPA, 2007).
3.2.2 Air pollution costs
The European Parliament Committee on Transport and Tourism issued the report “External Costs of Maritime Transport”6 that calculates the damage caused by air emi-ssion from passenger and cruise ships to be 0.2413 euro (1.74 HRK) per person per km. (TRT, 2007:12, Table 8). The vast majority of cruisers visit destinations in Croatia as part of their voyages to Venice. This indicates that most cruisers travel the full length of the Adriatic to the north and back, totaling approximately 1,600 km7.
The Croatian air DPC is estimated to be: 694,104 cruise guests x 1,600 km x 0.24 euro = 266.5 mill euro.
3.2.3 Black and gray wastewater treatment cost
The cost of processing drinking water and treating wastewater in Croatia is approxi-mately 0.0189 HRK/litre (0.00265 euro) (MZOPU, 2008). The cost of similar services within the EU varies according to the available infrastructure, national legislation and other requirements. Generally, costs range from 180 to 800 euro per capita per year (EEA, 2005). Taking an average value of 490 euro per annum and breaking into a daily rate, the average cost is 1.34 euro/day (9.65 HRK) and divided by the average daily consumpti-on of water in EU of 150 lit/day8 gives 0.00893 euro/litre. The average daily production of gray and black waters according to the data from Table 1 is 380 litres per cruise guest; when this is applied to 1.1 million guest days per year; it gives a total wastewater (gray and black) of 422 million litres emitted in 2007.
The Croatian DPC cost is total wastewater of 422 million litres multiplied with 0.00265 euro = 1.1 million euro. The EU wastewater DPC is total wastewater of 1.1 mi-llion guest days multiplied with 1.34 euro/day = 1.5 mill euro.
3.2.4 Bilge water treatment cost
Bilge water from engine rooms is considered hazardous liquid waste and is produced in the amount of 10 litres a day per guest. The cost of treatment of oily water in Croatia is 1.55 HRK/litre (0.22 euro/litre) (HWMA, 2008).
The Croatian bilge DPC is 1.1 million guest days multiplied by 10 litres per guest per year multiplied by 0.22 euro/litre = 2.4 million euro. EU prices for this service were not available; hence it is assumed that they would be the equivalent to the Croatian prices.
6 Methodology used is Impact Pathway that calculates impacts of each subject (i.e. ships in different
catego-ries) and produces monetary valuation for impact factors: greenhouse gas, air quality, discharges at seas, waste and resource consumption.
7 Average length of Croatian Adriatic is 783 km and width is 170 km.
3.2.5 Hazardous waste management cost
The cost of treatment of hazardous waste in Croatia is 24 HRK/kg (3.36 euro/kg) (HWMA, 2008). Cruisers produce 0.16 kg per cruise guest a day9.
The Croatian hazardous waste DPC is 1.1 million guest days in a year multiplied by 0.16kg = 177.7 million kg/year x 3.36 euro/kg = 597 thousand euro.
EU hazardous waste management costs vary from 0.22 to 2.28 euro/kg (Hogg, 2002). For this calculation the mean value of 1.53 euro/kg yields a EU DPC cost of 271.9 tho-usandeuro.
3.3. Cost-benefit analysis
Cost-benefit analysis (CBA) is the highlight in processes such as environmental im-pact assessment because it aims to assist a decision maker to grasp the effects of an acti-vity, a plan or a policy (Hundloe, 1990). For this purpose CBA is limited to a simple com-parison of direct pollution costs with direct revenue from cruising tourism.
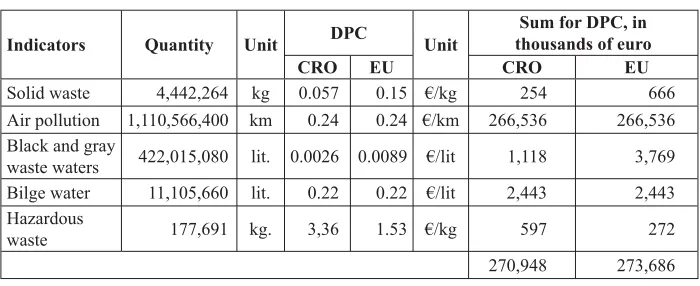
The findings of the negative externality calculations for the five selected indicators are presented in Table 2. In total, pollution costs are estimated to be around 272 million euro. The largest proportion of the DPC is from air emissions, approximately 98%.
Table 2: Estimated quantities and direct pollution costs of negative externalities for Croatian cruising tourism in 2007 based on Croatian and EU prices of environmental management charges
Indicators Quantity Unit DPC Unit
Sum for DPC, in thousands of euro
CRO EU CRO EU
Solid waste 4,442,264 kg 0.057 0.15 €/kg 254 666
Air pollution 1,110,566,400 km 0.24 0.24 €/km 266,536 266,536
Black and gray
waste waters 422,015,080 lit. 0.0026 0.0089 €/lit 1,118 3,769
Bilge water 11,105,660 lit. 0.22 0.22 €/lit 2,443 2,443
Hazardous
waste 177,691 kg. 3,36 1.53 €/kg 597 272
270,948 273,686
Source: Author’s calculation.
The Institute for Tourism conducted a survey that analyzed the expenditures of cruise ship visitors in Croatia in 2006 (Institute for Tourism, 2006). Based on the findings of that report, and subsequent work presented in a study on cruising tourism in Croatia (Institute for tourism, 2007:74.), it was possible to calculate that the direct income for the Croatian economy from cruising tourism in 2006 was 29 to 32 millioneuro. Since the base year in
this study is 2007, this figure should be increased according to the growth in cruise tour-ism of 16% from 2006 to 2007. This would give an economic benefit of 33.7 to 37.2 mi-llioneuro for the Croatian economy in 2007. Hence, the CBA equation of DPC minus di-rect income produces a negative balance of approximately 238 million euro.
4 Discussion
The environment is tourism’s most important resource. At a tourism destination, to-urists compete for the same resources, among each other and with the local communi-ty. Often the effect on the environment is overlooked, and only when tourists complain of overcrowding or loss of amenity values is carrying capacity considered. Apportioning blame for environmental decline is difficult without clear environmental protection cost calculations that can be presented to tourism managers and the industry as a whole. The analysis shows that cruisers can create large negative externalities due to the lack of appro-priate systems to manage environmental protection. There are however other general shi-pping environmental impacts that have not been considered or quantified.
Antifouling paints emit bio-toxic metals in marine environments and pose a direct threat to both living marine organisms and humans through bio-accumulation processes. Ballast waters are recognized to have transported numerous organisms world-wide, in-troducing them to new locations where they become invasive and sometime dangerous for humans. Of particular concern is the spread of Caulerpa spp. which places the futu-re of the sea grass meadows and the ecosystems they support in jeopardy. Cruisers may also physically disturb an environment; inappropriate anchoring may disturb biodiversi-ty hotspots (Rogers et al., 1988) such as Posedonia oceanica meadows. Noise is often neglected as a pollutant, whilst in reality it is very significant due to the increase of mari-ne traffic, and the fact that noise is amplified in seawater. This can have a significant ef-fect on both fish and marine mammal populations (Kizzia, 2006). Marine litter, particu-larly plastic waste on the surface of oceans, has become a global environmental problem. It is estimated that up to 13,000 pieces of plastic are afloat in every km2 of open ocean (Jeftic et al., 2005; Marks and Howden, 2008). Another potential environmental indica-tor not analyzed here is the impact of the journey that the cruise tourist takes to and from the cruise ship, before and after the cruise takes place. Hence, there are many other envi-ronmental aspects to be considered, with possible significant and unrevealed effects on the environment and human health.
This paper does not address the multiplier effect of cruise tourism economy10, but only the direct contribution made to the local economy based on the survey (Institute for Tourism, 2006). Why? As was explained, there are immeasurable multiplying “domino” effects in damage that occur when the environment is polluted. This damage is most li-kely transferred to human systems in the form of reduced economic opportunity and he-alth risks. Although there are different attempts by scientists to assess ecosystem values, the ecological damages and related multiplier effects of that damage are rarely discussed in the literature. At best, in very rare occasions such as large oil spills, they are
conside-10 The multiplier effect in economy was introduced by Keynes and refers to the idea that an initial spending leads
red an opportunity cost. Therefore, only direct and measurable effects were considered, for both the environment and the economy.
5 Conclusion
The sustainable development concept has significant difficulties finding its way in practice. Even new forms of mass tourism such as cruising tourism in Adriatic are wel-comed and rarely viewed together with their environmental, economic and social susta-inability impacts.
The model presented here focused on the environmental field of sustainability, defi-ning solid waste, air pollution, waste waters (black, gray, bilge), and hazardous waste as measurable indicators for which an estimation of mass (pollution quantities) and related costs was conducted. The outcome of the calculation for the Croatian cruising tour ism ac-tivity in 2007 is that the total cost of the negative externalities is seven times larger than the benefits to local economy.
This is a typical “intervention failure” where one industry is preferred by decision-makers over the other sectors (Garrod, 1995), or “information failure” where government, as a result of not possessing and not having gathered the information, does not interve-ne to protect the resource (Stiglitz, 2000:83). Since the environment is a finite resource, as the above evidence shows, the Adriatic exhibits the characteristic problems of com-mon pool resources: overuse and a lack of incentive to invest in maintaining or impro-ving them (Healy, 1994).
Although cruising corporations are not to be blamed for the lack of domestic or in-ternational regulations, they take advantage of an imperfect system to utilize common re-sources they do not own nor maintain. The absence of effective polluter-pays regulations and other control mechanisms in the cruising industry leads to a situation where the ma-jority of users are free-riding. In the absence of clear rules of management and enforce-ment of environenforce-mental legislation this style of marine manageenforce-ment could lead to a trage-dy of the commons of global proportions.
eco-system, state of national and/or municipal environmental management eco-system, and deve-lopment and societal interests of local community.
LITERATURE
ACIDRAIN – The Swedish NGO Secretariat on Acid Rain, 2008. “Agreement by
IMO to curb shipping emissions” [online]. Acid News, (2), 3-4. Available from: [http:// www.airclim.org/acidnews/2008/AN2-08.php#IMO_MEPC].
ADEC, 2000. Alaska Cruise Ship Initiative. Part 1.
ADEC, 2001. Alaska Cruise Ship Initiative. Part 2. Juneau: Alaska Department of
Environmental Conservation, Division of Statewide Public Services.
Bennis J., 2000. The Environmental Effects of the Cruise Line Industry. Maryland:
School of Public Policy, University of Maryland.
Bluewater Network, 2000.Petition to EPA [online]. Available from: [http://eii.org/ csaw/Gen_Cruise_web_docs/Bluewater_Network_EPA_Petition_2000.doc].
Briassoulis, H., 2002. “Sustainable Tourism and the Question of the Commons”.
Annals of Tourism Research, 29 (4), 1065–1085.
British Columbia Near-shore Habitat Loss Work Group, 2001. A Strategy to
Pre-vent Coastal Habitat Loss and Degradation in the Georgia Basin. Victoria: Government of British Columbia.
Carić H. and Marković I., 2010. “Nosivi kapacitet turističke destinacije ‘sunca i
mora’–Carrying capacity of ‘sun and sea’ tourism destinations”. ICITE 2010 Internati-onal conference on tourism and environment Proceedings. Sarajevo: InternatiInternati-onal uni-versity “Philip Noel-Baker”, 431-436.
Carić H., 2010. “Nosivi kapacitet i zaštita okoliša – Carrying capacity and envi-ronmental protection”. Proceedings. National park Plitvica lakes science conference, Oc-tober 15 and 16, 2009. Plitvička jezera: National park Plitvica lakes.
Carnival Corporation, 2007.Environmental Management Report Fiscal Year 2007
[online]. Miami: Carnival Corporation. Available form: [http://www.fs.fed.us/sustaina-bleoperations/documents/fy2007-environmental-footprint.pdf].
CBS – Croatian Bureau of Statistics, 2008. “Kružna putovanja stranih brodova u
Republici Hrvatskoj u 2007”. Priopćenja, Turizam, br. 4.4.9/8., 4.2. 2008. Zagreb: Cro-atian Bureau of Statistics.
Clark, R. B., 1986. Marine Pollution. Oxford: Clarendon Press, UK.
Cohen, G., 2008.Overview of Cruise Ship Facts, Threats to Environment, Criminal
History [online]. Available from: [www.eii.org/csaw/Gen_Cruise_web_docs/Cruise_In-dustry_Overview_2008.pdf].
Commoy, J. et al., 2005. “The Environmental Impact of Cruise Ships”. American
Society of Civil Engineers. Proceedings: World Water and Environmental Resources Con-gress 2005. Anchorage, Alaska, USA.
Črnjar, M., 2002. Ekonomika i politika zaštite okoliša. Rijeka: Ekonomski fakul-tet.
CRO EPA – Croatian Environmental Protection Agency, 2007. Republic of
Croa-tia State of Environment Report. Zagreb: CroaCroa-tian Environmental Protection Agency and Ministry of Environmental Protection, Physical Planning and Construction.
Cruise Junkie, 2006. Pollution and Environmental Violations and Fines, 1992-2005 [online]. Available from: [www.cruisejunkie.com/envirofines.html].
Cruisepage, 2009. Cruise Travel - New Ships [online]. Available from:
[www.crui-seserver.net/travelpage/other/new_build.asp].
Dobson, S. and Gill, A., 2006. “Environmental Policy Challenges for the Cruise In-dustry: Case Studies from Australia and USA” in: Dowling, R. K., ed. Cruise Ship Tou-rism. Wallingford: CAB International, 338-349.
EEA, 2005. Effectiveness of urban wastewater treatment policies in selected coun-tries: an EEA pilot study, Report No 2/2005. Copenhagen: European Environment Agen-cy.
Energy Foundation, 2001. Bellagio Memorandum on Motor Vehicle Policy.
Prin-ciples for Vehicles and Fuels in Response to Global Environmental and Health Impera-tives. Consensus Document: 19-21 June, 2001, Bellagio, Italy. San Francisco: The Ener-gy Foundation.
European Commission, 2000.Communication from the Commission on the
preca-utionary principle [online]. European Commision. Brussels 02.02.2000. Available from: [http://ec.europa.eu/dgs/health_consumer/library/pub/pub07_en.pdf].
European Commission, 2005.The Communication on Thematic Strategy on Air
Po-llution. Section 4.2.2.3. Shipping. [online]. European Commision. Brussels, 21.9.2005, Available from: [http://eur-lex.europa.eu/smartapi/cgi/sga_doc?smartapi!celexplus!prod !DocNumber&lg=en&type_doc=COMfinal&an_doc=2005&nu_doc=446].
Friedrich, A. et al., 2007. Air Pollution and Greenhouse Gas Emissions from Ocean-going Ships: Impacts, Mitigation Options and Opportunities for Managing Growt [on-line]. Washington: The International Council on Clean Transportation. Available from: [http://pre2010.theicct.org/documents/MarineES_Final_Web.pdf].
Garrod, B. and Whitmarsh, D., 1995. “The Economics of Marine Pollution
Con-troll”. Marine Pollution Bulletin, 30 (6), 365-371.
General Accounting Office, 2000. Report to Congressional Requesters. Marine
Po-llution: Progress Made to Reduce Marine Pollution by Cruise Ships, but Important Issues Remain. United States General Accounting Office Washington, Resources, Community, and Economic Development Division, D.C. 20548, USA.
Goodstein, E. S., 2003. Ekonomika i okoliš. Zagreb: MATE.
Gossling S. et al., 2002. “Ecological footprint analysis as a tool to assess tourism su-stainability”. Ecological Economics, 43, 199-211.
Hardin, G., 1968. “The Tragedy of the Commons”. Science, 162 (3859),
Hayes, A. W., 2005. “The Precautionary Principle”. Arhiv za higijenu rada i toksi-kologiju, 56, 161-166.
Healy, R. G., 1994. “The ‘common pool’ problem in tourism landscapes.”. Annals
of Tourism Research, 21 (3), 596-611.
Herz, M. and Davis, J., 2002. Cruise Control. Washington: The Ocean
Conservan-cy.
Hogg, D., 2002. Cost of municipal waste management in the EU. Final Report to DG Environment EC. Bristol: Eunomia research and consulting.
Hundloe, T. et al., 1990. “Cost-Benefit Analysis and Environmental Impact
Asses-sment”. Environmental Impact Assessment Review, 10, 55-68.
Hunter, C. and Green, H., 1995. Tourism and the Environment. A Sustainable
Re-lationship. London: Routledge.
Hunter, C. and Shaw, J., 2006. “Applying ecological footprint to ecotoursim sce-narios”. Environmental Conservation, 32 (4), 294-304.
Hunter, C., 2002. “Sustainable Tourism and the Touristic Ecological Footprint”. En-vironment, Development and Sustainability, 4, 7-20.
HWMA – Croatian Hazardous Waste Management Agency, 2008. Price list of
oily water treatment. Email correspondence with Hazardous Waste Management Agen-cy, 28th June 2008.
Institute for Tourism, 2006. Survey on attitudes and expenditures of cruise ship vi-sitors in Croatia in 2006. Zagreb: Institute for Tourism.
Institute for Tourism, 2007. Study of Sustainable Development of Cruising Touri-sm in Croatia. Zagreb: Institute for TouriTouri-sm.
Jeftic Lj., Hagerhall, B. and Anianson, B., 2005. Marine Litter. United Nations En-vironmental Protection Programme.
Kay, B. H., 1989. A State of the Environment Report: Pollutants in British Columbia’s Marine Environment: A status report. Ottawa: Environment Canada.
Kizzia, T., 2006. “Whale carcass docks in Seward”. Anchorage Daily News,
20.8.2006.
Klein, R. A., 2003. Cruising – Out of Control: The Cruise Industry, The Environment, Workers, and the Maritimes. Halifax: Canadian Centre for Policy Alternatives – Nova Scotia.
Klein, R. A., 2008. Paradise lost at sea, rethinking cruise vacations. Halifax: Fer-nwood Publishing.
Komunalni servis, 2008. Price List of Rovinj waste management company. Email
correspondence 13th June 2008.
Kucar Dragicevic, S. et al., 2006. “Waste management in Croatia”. Arh Hig Rada
Lee, S. L., Wong, W. H. S. and Lau, Y. L., 2006. “Association between air pollu-tion and asthma admission among children in Hong Kong”. Clinical and Experimental Allergy, 36, 1138-1146.
Mackelworth, P.C. and Carić, H., 2009. “Gatekeepers of Island Communities –
Exploring the Pillars of (Un)Sustainable Development” [online]. Environment, Develo-pment and Sustainability, Wednesday, August 19, 2009. Available from: [http://www. springerlink.com/content/t846616r15n36rk2/].
Marks, K. and Howden, D., 2008. “The world’s rubbish dump: a garbage tip that
stretches from Hawaii to Japan” [online]. The Independent, Tuesday, 5th February 2008.
Available from: [www.independent.co.uk/environment/the-worlds-rubbish-dump-a-gar-bage-tip-that-stretches-from-hawaii-to-japan-778016.html].
Mowforth, M. and Munt, I., 2003. Tourism and Sustainability: Development and
New Tourism in the Third World. London: Routledge.
MZOPU, 2000. Pravilnik o procjeni utjecaja na okoliš, NN 59/00. Zagreb:
Narod-ne noviNarod-ne.
MZOPU,2008. Pregled cijena komunalnih usluga za pitku vodu, odvodnju i prijevoz
putnika - ožujak 2008 [online]. Zagreb: Ministarstvo zaštite okoliša i prostornog uređenja. Available from: [www.mzopu.hr/doc/Cijene_komunalnih_usluga.pdf].
Nafstad, P. et al., 2003. “Lung cancer and air pollution: a 27 year follow up of 16,209 Norwegian men”. Thorax, 58, 1071-1076.
Nowlan, L. and Kwan, I., 2001. Cruise Control – Regulating Cruise Ship Pollution in the Pacific Coast of Canada. Vancouver: West Coast Environmental Law.
NRC – National Research Council, 1995. Clean Ships, Clean Ports, Clean
Oce-ans: Controlling Garbage and Plastic Wastes at Sea. Washington, D.C.: National Aca-demy Press.
Ostrom, E. et al., 1999. “Revisiting the Commons: Local Lessons, Global
Challen-ges”. Science, 284, 278-282.
PAP-RAC – Priority Action Program - Regional Activity Center, 1997.
Guide-lines for Carrying Capacity Assessment for Tourism in Mediterranean Coastal Areas. Split: PAP-RAC.
Rawlings, T. et al., 1999. “Ecology and ballast mediated Transfer of Vibrio Chole-rae 01 and 0139”. Conference Paper: 1st National Conference on Marine Bioinvasions January 1999. Cambridge: MIT Press.
RCI – Royal Caribbean International, 2009. Royal Caribbean and the Environment,
Waste Stream Operational Controls chart [online]. Available from: [www.royalcaribbe-an.com/ourCompany/environment/rcAndEnvironment.doc].
Rogers, C. S., McLain L. and Zulo, E., 1988. “Damage to Coral Reefs in Virgin
Islands National Park and Biosphere Reserve from Recreational Activities”. Coral Reefs, 2, 405-410.
San Francisco Estuary Project, 2009. “How Boat Sewage Discharges Affect the
California Department of Boating and Waterways. Oakland CA, USA. Available from: [http://sfep.abag.ca.gov/sewage.html].
South Coast Air Quality Management District, 2008. Multiple Air Toxic
Exposu-re in the South Coast Air Basin. Diamon Bar: South Coast AQMD.
Starmer-Smith, C., 2008. “Flying three times greener than cruising” [online]. Ava-ilable from: [www.telegraph.co.uk/travel/739287/Flying-three-times-greener-than-crui-sing.html].
Stiglitz, J. E., 2000.Economics of the Public Sector.London; New York: W. W.
Norton & Company.
TRT – Trasporti e Territorio Srl, 2007. External Costs of Maritime Transport. Eu-ropean Union. Directorate General Internal Policies of the Union. EuEu-ropean Parliament’s Committee on Transport and Tourism.
UNEP, 2002. Environmental Impact Assessment Training Resource Manual [online]. Available from: [http://www.unep.ch/etu/publications/EIAMan_2edition_toc.htm].
US EPA – United States environmental Protection Agency, 2008. Cruise Ship
Discharge Assessment Report. US EPA Oceans and Coastal Protection Division. Was-hington. EPA 842-R-07-005.