www.adv-radio-sci.net/11/37/2013/ doi:10.5194/ars-11-37-2013
© Author(s) 2013. CC Attribution 3.0 License.
Radio Science
Near-field radiation pattern distortion of antenna attached to wall in
through-the-wall radar imaging
B. Cetin, H.-R. Benedickter, and P. Leuchtmann
Institute for Electromagnetic Fields and Microwave Electronics, ETH Zurich, Switzerland
Correspondence to: B. Cetin ([email protected])
1 Introduction
Through-the-wall radar imaging (TWRI) has become subject of growing interest in the recent decade. It is supposed to be used for law-enforcement purposes during surveillance, re-connaissance and rescue missions (Ferris et al., 1999; Bara-noski, 2008; Amin, 2011). Radar systems in general are based on the detection of reflected waves caused by scat-tering objects. According to shape and amplitude of the re-flection, the measurement data are processed into a tomo-graphic image. When the signal is propagating through-the-wall (TTW), the reflected signal’s original shape and ampli-tude are altered. For the reconstitution of the reflection of in-terest (Thajudeen et al., 2011), the distortion causing signal path needs to be known regarding to its structure and elec-tromagnetic material properties. Otherwise the image will be degraded and defocused (Li et al., 2010; Chang et al., 2010). In many studies the properties of different kinds of con-struction material have been investigated (Muqaibel, 2003; Stavrou et al., 2003). Due to the natural origin of some mate-rials (e.g. wood and brick), natural conditions (e.g. moisture) and not standardized material mixtures (e.g. concrete), pub-lished material values can differ significantly. To overcome this uncertainty in material parameters, on-site material ex-traction methods have been proposed (Ahmad et al., 2007; Jia et al., 2011). These methods are based on the single layer homogeneous wall model and have a limitation in accuracy. In a realistic inhomogeneous multilayer wall, however, mul-tipath propagation and anisotropic wall characteristics influ-ence the detected value of material properties.
Reduction of clutter caused by ceiling, floor and the back wall can be achieved by placement of the antenna close or even directly on the walls themselves (Jia et al., 2011). At the same time the wall penetrating electromagnetic wave’s power density will be higher, resulting in a more sensitive sensing of reflections (Farwell et al., 2008). In addition,
an-other uncertainty in the system gets omitted: the distance be-tween wall and antenna (Wang et al., 2006). By the place-ment of the antenna directly on the wall and the decrease of the distance between antenna and target into the near field distance jointly with the use of large imaging apertures, the resolution of the imaging system can be optimized (Sheen et al., 2007).
This work analyzed the distortion of the radiation pattern when the antenna is placed on wall. Sensitivity analysis were made to investigate the impact of imprecise knowledge of material parameters on the radiation pattern. The principle setup is explained in Sect. 2. The used components includ-ing antenna and the examined walls are presented in Sect. 3. In Sect. 4 the simulation techniques are explained, whereas Sect. 5 shows the measurement setup. The results are pre-sented and discussed in Sect. 6, followed by the conclusions in Sect. 7.
2 Principle setup
Antenna
under test
Field
monitoring
Wall
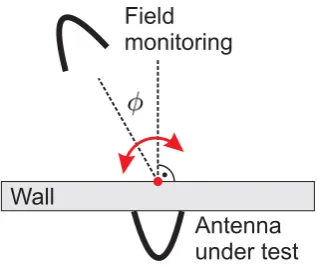
Fig. 1. Principle of obtaining the radiation pattern in simulations and measurements. It is based on the relative rotationφbetween the antenna under test (AUT) and the monitoring system (field moni-tor in simulations, probe antenna in measurements). Here, the setup shows the antenna put directly on a wall.
wall. The method was chosen in dependence of the circum-stances as described in Sect. 5.
Two datasets for each the simulations and the measure-ments are required for determining the influence of a wall on an antenna’s radiation pattern: the first dataset is for de-termining the non-distorted radiation pattern of the AUT in free-space. The second one is for the distorted radiation pat-tern that results from the placement of the antenna directly on the wall. By comparison of both datasets, the distortion of the radiation pattern and the damping through-the-wall (TTW) 1s21caused by the wall can be quantified
1s21=s21,withwall−s21,freespace [dB]. (1)
3 Components
The distortion of an antenna’s radiation pattern is being an-alyzed when the antenna is placed directly on a wall. The investigations include simulations and measurements in the frequency range 0.7–10.0 GHz as proposed for TWRI.
3.1 Antenna
The used antenna is the ETS-Lindgren 3164-08, a non-resonant ultra-wideband (UWB) antenna based on the quad-ridged horn design. It is dual-polarization capable and oper-ational in the frequency range of interest. This antenna’s re-active part within the near-field (NF) region is situated in the coupling region between the coaxial input and the ridges. As it vanishes within one wavelength, no reactive NF is present at the antenna’s mouth and therefore only very limited mu-tual coupling between antenna and wall is possible (Seybold, 2005).
Table 1. Material parameters atf=1.75 GHz derived from rectan-gular waveguide measurements and used for the simulations. The sensitivity analysis was carried out at 2.0 GHz.
Material εr tanδ
Wood 1.81 0.077
Sensitivity analysis 1.6 1.7 1.8 0.06 0.07 0.08
Brick 3.49 0.005
Sensitivity analysis Spacing between bricksg: 1 cm 2 cm
Sand lime brick 5.02 0.035
Insulating foam ≈1 ≈0
3.2 Wall materials
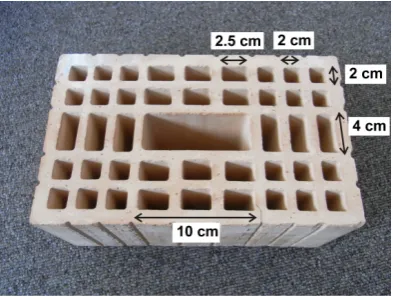
The first class of material investigated is the homogeneous dielectric slab. Representatively for this class of material, glued laminated timber made of wood with the size of Thick-ness (T) 4.0 cm×Length (L) 200 cm×Width (W) 60 cm is chosen. Putting three specimens together yield in a 180 cm wide wooden slab. The second class of material is inhomo-geneous brick. The size of the used bricks is L 29.0 cm×W 17.5 cm×Height (H) 19.0 cm (Swiss Modul 030419, Fig. 2). The third wall is a typical Swiss multilayer inhomogeneous exterior wall with a total thickness of 60 cm. It consists of three layers, namely sand lime brick (Creabeton 510604, L 25.0 cm × W 14.5 cm × H 19.0 cm), insulating foam (T 15.0 cm) and brick (Swissbrick, L 29 cm×W 17.5 cm×H 19 cm). A comparison of Fig. 2 and Fig. 3 shows that the internal structure of the used bricks are almost identical. Be-fore measuring the material parameters atf =1.75 GHz as listed in Table 1, the stones and bricks were dehumidified in an oven. In dependence of the permittivityεr, the wavelength
of the electromagnetic wave reduces to
λ=√λ0
εr,eff =√λ0
εr
s Vtotal
Vmaterial
(2)
when propagating through material. The effective permittiv-ity of an inhomogeneous material distribution can be calcu-lated by the material’s permittivity and the ratio of the ma-terial volume to total volume (see Fig. 2), provided that the cavities are much smaller than the wavelength.
4 Simulation technique
Fig. 2. Cross-section of the brick used in these investigations. Ge-ometry is almost identical to brick used in the multilayer wall (see Fig. 3). The cavities cause the decrease of the effective permittivity.
Frequency Structure Simulator). For this, the antenna’s ge-ometry and the different kinds of wall were implemented in the programme. The use of the FEBI (Finite Element Boundary Integration) boundary condition helped reducing the computational volume (Edgar, 2011) for the simulation of the single antenna. For overcoming memory shortcomings for the simulation of the whole structure including antenna and wall, the FEBI and Datalink (a technique for separat-ing the computational space into parts) functions were used jointly, facilitating the computational separation of antenna and wall and retaining the distance between them close to zero at the same time.
Sensitivity analysis
To evaluate the effects of differing material parameters in the case of wooden slab, a sensitivity analysis was carried out at f =2.0 GHz with three different values for the permittivity εrand three different values for the loss tangent tanδ,
respec-tively (see Table 1). For this, the damping1s21 TTW
de-fined in Eq. (1) was determined for all nine material proper-ties combinations and compared with the reference (εr=1.7,
tanδ=0.07). In the case of brick wall, a sensitivity analy-sis was performed on the horizontal and vertical spacingsg between the bricks. Two different values (see Table 1) have been used to evaluate the impact of brick spacing on the ra-diation pattern.
5 Measurement setup
The radiation pattern of the AUT was measured in differ-ent antenna configurations. These are described in this sec-tion and the specific setup parameters are summarized in Ta-ble 2. The probe antenna for recording the electromagnetic field strength on a circle around the AUT in azimuth plane is of the same model as the AUT itself (Sect. 3.1). All
radia-Fig. 3. Cross-section of the multilayer wall on the open-air test site Witaumatte (Thun, CH). The used materials are sand lime brick (left), brick (right) and insulating foam in between (not visible in this picture).
tion patterns were recorded in the four possible polarization directions (co-polarizations HH and VV, cross-polarizations HV and VH; the letters denote the polarization of the AUT and probe antenna, respectively).
The measurements were carried out in the frequency do-main, using an Agilent 8510C Vector Network Analyzer (VNA). The calibration was applied to the connection inter-face between coaxial cable and antenna. Therefore, the mea-surements include all effects due to frequency dependency of the antennas. However, they are cancelled by the subtraction of both datasets as described in Sect. 2.
5.1 Free-standing antenna in anechoic chamber
The radiation pattern of the AUT in free-space configuration was recorded in the anechoic chamber. It serves as a ref-erence for evaluating the distorted radiation patterns of the AUT when put directly on different kinds of wall. The rel-ative rotation between the AUT and the probe antenna was achieved by rotating the AUT around its own axis in azimuth plane. Due to the use of a robotic device, the adjusted az-imuth angleφis very precise.
5.2 Antenna on homogeneous wooden slab and inhomogeneous brick wall in anechoic chamber
Table 2. Geometrical setup parameters for both the simulations and the measurements. The simulations provide data for all required distances and forφ=
−180◦,180◦
with1φ=1◦.
Antenna Distance AUT Recorded azimuth Increment in Recorded frequency
configuration ↔probe antenna angle intervalφ azimuth angle1φ spectrumf
Free-standing d1=1.50 m −178◦,180◦ 2◦ 0.7−10.0 GHz
(indoor) d2=2.70 m
−178◦,180◦ 2◦ 0.7−10.0 GHz
d3=4.14 m 0◦ – 0.7−10.0 GHz
On wooden slab d1=1.50 m
0◦,70◦ 5◦ 0.7−10.0 GHz
(indoor) d2=2.70 m −35◦,70◦ 5◦ 0.7−10.0 GHz
On brick wall d1=1.50 m
−25◦,60◦ 5◦ 0.7−10.0 GHz
(indoor, Fig.4)
On multilayer wall d1=1.50 m
−60◦,60◦ 10◦ 0.7−4.3 GHz
(outdoor, Fig.6) d4=3.00 m 0◦ – 0.7−4.3 GHz
Fig. 4. Measurement setup of antenna placed on brick wall in po-sition A (see Fig. 5). The structure comprising of wall and AUT is being rotated around its axis and the radiation pattern is recorded with the probe antenna. Measurements were carried out inside an anechoic chamber. The setup for the wooden slab is accordant.
Fig. 5. Measurement positions for AUT on the brick wall. Two rows are omitted at the bottom and one row at the top.
Fig. 6. Measurement setup of antenna on multilayer wall on the open-air test site Witaumatte (Thun, CH). The AUT is being placed directly on the wall. The radiation pattern is recorded with a probe antenna that is moved on a circle around the wall (distance keeping cord).
walls were erected on a table standing on a turntable inside the anechoic chamber. The AUT was fixed on the walls. By rotating this structure around its own axis, the distorted radi-ation pattern was recorded with the probe antenna being on a fixed spot. The use of an angle metre in connection with the special construction of the table helped keeping the step sizes 1φ very precise. Due to a mistake in the referenceφoffset,
5.3 Antenna on inhomogeneous multilayer wall at open-air test site
In the case of the inhomogeneous multilayer wall at the open-air test site in Thun (CH), the probe antenna was moved cir-cularly around the AUT as shown in Fig. 6. Even though the same angle metre was used here as well, a less precise adjust-ment of the azimuth angleφis being expected. A deviation of a few degrees for each position is realistic. Due to being in a realistic environment, parasitic effects and disturbance sources can interfere with the measurements. An attenuator was used for suppressing these interferences (and parasiti-cally the signal). A 10-Watt amplifier was used to raise the signal. This limited the frequency range to 0.7−4.3 GHz.
6 Results and discussion
For the calculation of the net damping1s21 caused by the
multilayer wall, free-space measurements and measurements on the wall at corresponding distances and the same VNA setting were executed. In this case the only change in the configuration is the presence of the wall and 1s21 can be
calculated by subtracting the results of both measurements from each other as shown in Eq. (1).
6.1 Homogeneous wooden slab
In contrary to the perfectly symmetrical simulational setup, inaccuracies lead to an offset azimuth angle φoffset in the
measurement setup. This offset was quantified by the iden-tification of the symmetry centre of the radiation pattern recorded at the distanced2=2.70 m. Its value isφoffset≈2◦,
and the results were corrected accordingly. Simulated and measured damping1s21 in the azimuth plane is plotted in
Fig. 7 forf =1.0 GHz and the distanced2=2.70 m between
AUT and observation point. Due to the perfect symmetry in the field simulator, the simulation results for both polariza-tions are symmetric. In the case of an infinite slab, perpen-dicular (VV) and parallel (HH) polarization directions within the plane of incidence fall together at normal incidence and show the same transmission characteristics. As the simula-tion results intercept atφ=0◦, the effects of the slab edges are negligible at this angle. In contrary, for the measurements there is a difference of≈0.15 dB between both polarizations at normal incidence, resulting from positioning imprecise-nesses like inclination of the slab, adjustment and torsion of the antenna. For these reasons the recorded radiation pat-tern is affected irreversibly. With increasing azimuth angle both simulation and measurement data for the VV polariza-tion show corrugapolariza-tion behaviour, in contrast to the HH po-larization data that stays smooth. This results from the an-tenna’s radiation pattern that is broader in the cut perpen-dicular to the excitation (ETS-Lindgren, 2010): as the data was recorded in azimuth plane, this complies with the VV data. Due to broader main lobe, the propagating wave
inter-acts with the edges of the slab, causing wave interference in the observation point. The damping is almost constant for φ <40◦. The wave propagating TTW gets attenuated only in the normal direction of the slab. Therefore, the longer propa-gation path of the electromagnetic wave described by Snell’s law does not lead to bigger damping values1s21.
Simula-tions and measurements are in good agreement forφ <45◦. If the angle increases further, disturbing effects caused by the slab’s edges dominate the results. Minimizing these effects are only possible by using a bigger wooden slab in simula-tions and measurements.
The results of the accomplished sensitivity analysis are plotted in Fig. 8. The deviation in damping1s21 is shown
in dependence ofεr(x axis) and tanδ (coloured bars). The
valuesεr=1.7 and tanδ=0.07 are considered as reference.
The maximum deviation for the values under study is ap-proximately 0.25 dB, this means the relative uncertainty is about 3 %. If the assumedεris correct, the maximum
devi-ation caused by a wrong tanδ is about 0.2 dB (relative un-certainty 2 %), in case the tanδis known andεris unknown,
the maximum deviation is about 0.1 dB (relative uncertainty 1 %). The deviation due to an overestimatedεrgets partially
compensated with an underestimated tanδ, and vice versa ac-cordingly. In this case the deviation is limited to 0.1 dB (rel-ative uncertainty 1 %).
As a recapitulation it can be said that the distortion of the antenna’s radiation pattern is limited to damping 1s21 for
measurement anglesφ <45◦. Due to the symmetry and ho-mogeneous character of the material, this does not only ap-ply to the azimuth plane but also to the inclination plane: HH simulations and measurements in the azimuth plane can also be interpreted as VV in the inclination plane. The good agreement of simulations and measurement show that trans-mission through a homogeneous slab is predictable. The sen-sitivity analysis shows that the quantified deviations in the result are smaller than the deviation in the material param-eter. While the relative uncertainty of the permittivityεris
about 6 % and that of the loss tangent tanδ is about 14 %, the combined maximum consequence in1s21 is just 3 %. If
one of the two material parameters (εrand tanδ) is
overesti-mated and the other one is underestioveresti-mated, this leads to a par-tial compensation. At the same time the deviations are quite small and do not affect the radiation pattern dramatically. If the importance of the signal amplitude is of minor interest, the deviation due to wrong material parameters within the range of this investigation can be neglected.
6.2 Inhomogeneous brick wall
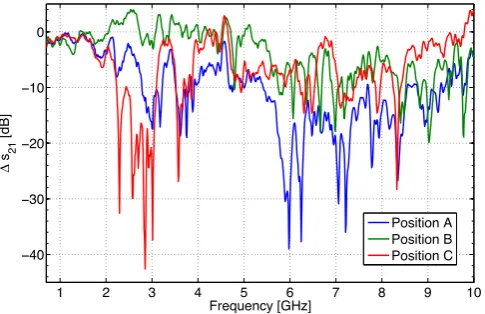
In the first step, the measured data at all three positions on the wall as shown in Fig. 5 were compared regarding to the main radiation directionφ=0◦. The damping1s21over the
−60 −40 −20 0 20 40 60 −5
−4 −3 −2 −1 0 1 2
Azimuth angle φ [deg]
Δ
s21
[dB]
VV−Polarization, Simulation VV−Polarization, Measurement HH−Polarization, Simulation HH−Polarization, Measurement
Fig. 7. Damping1s21caused by the wooden slab atf =1 GHz and the distanced2=2.70 m between slab and observing point. Com-parison of simulations and measurements in VV and HH polariza-tion.
frequency the curves start deviating from each other. At this frequency, the free-space wavelength λ0 is in the range of
30 cm. During its propagation through the material it reduces to approximately 23 cm due to Eq. (2). At the same time the brick’s biggest cavity has a diagonal length of≈11 cm: this length is in the same range as the wavelength in the mate-rial. Thereby the cavity is now visible to the wave, causing electromagnetic interaction and causing scattering. The dif-ferences between the curves show the sensitivity of the trans-mission TTW regarding the positioning of the antenna on the wall. The results for the three positions differ among each other. Atf =2.5 GHz, transmission TTW at antenna posi-tion B increases tos21,B≈ +4 dB, whereas the transmission
at position C decreases drastically s21,C≈ −30 dB. These
deviations are due to the interference of wave fractions re-flected on the cavities: at the observed point the total electric field is measured and therefore the in-phase sum of all waves might sum up to almost zero. By changing the position of the antenna, the distances to the cavities change accordingly and with them the phases of the partial waves. As the conse-quence, the transmission shows different results for different antenna positions. In the case of antenna position B and C, 1s21can reach values greater than zero. So even focusing
ef-fects at certain positions and certain frequencies are possible. It can also be observed that one of the curves always has an amplitude1s21>−10 dB. This is a hint that many antenna
positions can complement each other and the probability of higher1s21 increases with the growing number of used
an-tennas. As the transmission is very much dominated by other effects,φoffsetis negligible.
In the second step, measured data are compared at one sin-gle frequencyf =2 GHz in dependence of the azimuth an-gleφ. Both simulation and measurement data are shown in Fig. 10. As stated in Table 1, simulations were carried out for
1.6 1.7 1.8
−0.3 −0.2 −0.1 0 0.1 0.2 0.3
Permittivity εr
Deviation of
Δ
s21
[dB]
Fig. 8. Simulation of the transmission through the wooden slab with different material parameters (Table 1). Comparison of the deviation in damping1s21 atφ=0◦,θ=0◦with the reference deviation
εr=1.7, tanδ=0.07. The bars represent tanδ=0.06, 0.07, 0.08 (blue, red and green respectively).
two different spacing values between the bricks (g=1 cm and 2 cm). The curves are normalized in such a way that straight radiation loss is coded in theφ=0◦ value of each curve. Big differences between the simulation and measure-ment curves can be observed. In the simulations, against pre-diction, transmission for the bigger gap between the bricks g=2 cm lead to bigger damping1s21, even though the
an-tenna is directly in front of the gap. Assumptions based on Fig. 9 and the highly sensitive transmission depending on ge-ometry and frequency would require the radiation pattern to be similarly turbulent. As the simulations were carried out for a dense angular step1φ=1◦, the smoothness of the curves are truthful. This is a result of the perfect periodicity and geometry of the simulation setup. In contrast, the measure-ments were recorded in sparse angular steps1φ=10◦. The smoothness of the curves here can be a result of numerical in-terpolation, hiding local drops in field strength. In spite, the main radiation beam of the antenna is preserved.
1 2 3 4 5 6 7 8 9 10 −40
−30 −20 −10 0
Frequency [GHz]
Δ
s21
[dB]
Position A Position B Position C
Fig. 9. Damping through brick wall at three different measurement points A, B, C (Fig. 5) with rotation angleφ=0◦for the frequency spectrum 0.7−10.0 GHz in VV polarization.
of scatterers. In the worst case the radar system will be blind to several spots and will not be able detecting anything lo-cated there. Together with ultra-wideband (UWB) systems, multi-view approaches are most suitable for solving the prob-lem of incalculable transmission: as the antennas are placed or shifted at different locations, diversities in signal strength get balanced through statistical variation. In the later image fusion process, superposition of the multiple view data will lead to a balance for all scatterers inside the room. The mea-surements have shown that the unreliable transmission at the different measurement positions is compensated by the in-creasing probability that one of the measurement positions will cause sufficient transmission. Here with three different measurement positions, there is always one1s21>−10 dB.
With an increasing number of used antennas it is being ex-pected that the probability of higher signal strength TTW in-creases as well.
6.3 Inhomogeneous multilayer wall
The result of the damping measurement through the inho-mogeneous multilayer wall over the frequency 0.7−4.3 GHz in VV polarization is shown in Fig. 11. For the calcula-tion of the net damping1s21, free-space measurements in
the anechoic chamber were used as the reference rather than those in the open test site. As free-space measurements in the anechoic chamber at the required distanced4=3.00 m were
not available, a quadratic interpolation between the avail-able data for the distances 1.47 m, 2.67 m and 4.14 m was executed. The mistake committed with this procedure is be-low 1 dB, which is insignificant to the result. The blue graph represents the measured net loss, the red graph is a linear fit. It indicates that the loss increases approximately with 16 dB/GHz. For frequenciesf >3.35 GHz the signal falls below the noise level and data are not usable anymore.
−60 −40 −20 0 20 40 60
−20
−15
−10
−5
0
Azimuth angle φ [deg]
Normalized s21 [dB]
Meas Pos A Meas Pos B Meas Pos C Sim Pos A g=1cm Sim Pos A g=2cm
Fig. 10. Radiation pattern of brick wall forf=2 GHz in VV po-larization: comparison of measurement results in positions A, B, C and simulation results for different H and V brick spacingsg.
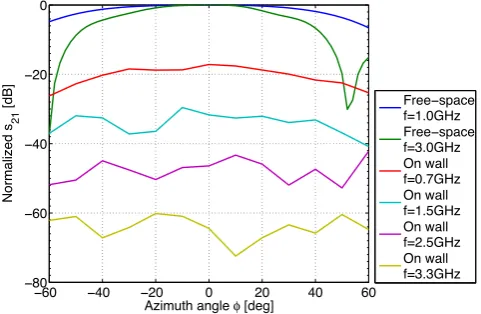
The radiation patterns in VV polarization for different frequencies up to a maximum of f =3.3 GHz are shown in Fig. 12. For comparison, measurement data of the free-standing antenna are shown as well. To demonstrate the rel-ative amplitude difference in dependence of the frequency, the curves are normalized equally as in Figure 10: the central radiation direction φ=0◦ indicates the net loss 1s21 due
to the wall’s presence. In the case of the free-standing an-tenna, net loss is 0 dB. In theory, these values for the damping should agree with the data presented in Fig. 11. Practically, the discrepancies show that the recorded transmission at two different distances (d4=3.00 m andd1=1.50 m) can be
dif-ferent, an indication that wave interference plays an impor-tant role. The radiation patterns of the antenna in free-space configuration and the antenna on the wall at 0.7 GHz show symmetry. The curves for the antenna on wall at higher fre-quencies do not show symmetry anymore. The transmission values seem to be randomly distributed within specific tol-erances that increase with higher frequency, forming an ap-proximately 12 dB band in the case off =3.3 GHz. Prefer-ence in radiation direction as shown for the antenna on brick wall vanishes. This and higher sensitivity with increasing fre-quency show that wave interference of the diffracted waves on the cavities dominates transmission TTW. In addition, the high damping1s21of the walls codetermine the transmission
as visible from the amplitude distances between the individ-ual curves.
1 1.5 2 2.5 3 3.5 4
−100
−80
−60
−40
−20
0
Frequency [GHz]
Δ
s21
[dB]
Measurement data Linear fit
Fig. 11. Damping through multilayer wall in VV polarization for frequency spectrum 0.7−4.3 GHz. The linear fit indicates that1s21 increases with 16 dB/GHz. Measurement in anechoic chamber used as reference. Distance between antennasd4=3.00 m.
damping value of the wall also plays a very important role. As the signal needs to travel back and forth, high dynamic range of the imaging system is required.
7 Conclusions
In this work, simulations and measurements for the determi-nation of near-field radiation patterns and their distortion by three different kinds of wall have been presented.
It has been shown that simulations and measurements are in very good agreement in case of the homogeneous wooden slab, making transmission through a homogeneous slab pre-dictable. Sensitivity analysis for different material properties have shown that the error range due to imprecise material knowledge is much smaller than the error range of the mate-rial properties taken as a basis in this work. Additionally they are within measurement inaccuracies and therefore could be neglected. This shows that simulations are reliable and can be used in the prediction of transmission TTW. In the case of the inhomogeneous brick wall, three different measument positions lead to different near-field patterns. The re-sults for the TTW transmission in normal incidence show the sensitivity of the brick wall both on the positioning of the AUT and on frequency: depending on these variables it is possible that the potential TWRI system is blind to certain spots. This is caused by interference of waves scattered at the cavities. Nevertheless, the main lobe of the radiation pattern is conserved qualitatively. This does not apply for the inho-mogeneous multilayer wall: wave interference caused by the cavities garbles the radiation pattern in such a way that field distribution seems to be randomly distributed within certain aberrations, even destructing the symmetry of the radiation pattern. In addition, transmission is dominated by the high damping values. The field strength measured behind walls
−60 −40 −20 0 20 40 60
−80
−60
−40
−20
0
Azimuth angle φ [deg]
Normalized s
21
[dB] Free−space
f=1.0GHz
Free−space
f=3.0GHz On wall f=0.7GHz On wall f=1.5GHz On wall f=2.5GHz On wall f=3.3GHz
Fig. 12. Distorted radiation pattern of antenna on inhomogeneous multilayer wall in comparison to radiation pattern of free-standing antenna at different frequencies in VV polarization. Distance be-tween antennasd1=1.50 m.
made of inhomogeneous material depends on many variables like frequency, position of the AUT, direction of radiation and the position of investigation. Simulations are not reliable because the determination of the whole wall is essential. As similar characteristics were reported for reinforced concrete walls (Dalke et al., 2000; Antonini et al., 2003), this problem spans the vast majority of wall structures.
The appearances of unpredictable signal nulls in the fre-quency spectrum make the use of narrowband single-view systems inadequate. Multi-view approaches (e.g. multi-static radar, MIMO, SAR) based on UWB architecture can solve the problem of unreliable transmission by statistically bal-ancing the field distribution behind the wall.
Acknowledgements. This work was supported under grant number
Aramis 041-19 by Armasuisse W+T, administrational agency of the Swiss Federal Department of Defense, Civil Protection and Sports.
References
Ahmad, F., Amin, M. G., and Mandapati, G.: Autofocusing of Through-the-Wall Radar Imagery Under Unknown Wall Characteristics, IEEE T. Image. Process., 16, 1785–1795, doi:10.1109/TIP.2007.899030, 2007.
Amin, M. G.: Through-the-Wall Radar Imaging, CRC Press, Boca Raton (FL), USA, 2011.
Antonini, G., Orlandi, A., and D’elia, S.: Shielding Effects of Re-inforced Concrete Structures to Electromagnetic Fields due to GSM and UMTS Systems, IEEE T. Magn. , 39, 1582–1585, doi:10.1109/TMAG.2003.810327, 2003.
Balanis, C. A.: Antenna theory: analysis and design, 3 Edn, John Wiley & Sons, Hoboken (NJ), USA, 2005.
Chang, P. C., Burkholder, R. J., and Volakis, J. L.: Adap-tive CLEAN With Target Refocusing for Through-Wall Im-age Improvement, IEEE T. Antenn. Propag., 58, 155–162, doi:10.1109/TAP.2009.2036131, 2010.
Dalke, R. A., Holloway, C. L., McKenna, P., Johansson, M., and Ali, A. S.: Effects of Reinforced Concrete Structures on RF Communications, IEEE T. Electromagn. C., 42, 486–496, doi:10.1109/15.902318, 2000.
Edgar, D.: HFSS 13: Hybrid FE-BI for Efficient Simulation of Ra-diation and Scattering, Ansys. Inc., 2011.
ETS-Lindgren: Model 3164 Series – Open Boundary Quad-Ridged Horns – User Manual, 2010.
Farwell, M., Ross, J., Luttrell, R., Cohen, D., Chin, W., and Dog-aru, T.: Sense through the wall system development and design considerations, J. Frankl. Inst., 345, 570–591, ISSN 0016-0032, doi10.1016/j.jfranklin.2008.01.004, 2008.
Ferris Jr, D. D. and Currie, N. C.: Survey of current technologies for through-the-wall surveillance (TWS), P. SPIE., 3577, 62–72, 1999.
Honcharenko, W. and Bertoni, H.: Transmission and Reflection Characteristics at Concrete Block Walls in the UHF Band Pro-posed for Future PCS, IEEE T. Antenn. Propag., 42, 232–239, 1994.
Jia, Y., Kong, L., and Yang, X.: A novel approach to target localiza-tion through unknown walls for through-the-wall radar imaging, Progr. Electromagn. Res., 119, 107–132, 2011.
Li, L., Zhang, W., and Li, F.: A Novel Autofocusing Ap-proach for Real-Time Through-Wall Imaging Under Unknown Wall Characteristics, IEEE T. Geosci. Remote, 48, 423–431, doi:10.1109/TGRS.2009.2024686, 2010.
Muqaibel, A. H.: Characterization of Ultra Wideband Communi-cation Channels, Ph.D. thesis, Virginia Polytechnic Institute and State University, Blacksburg (VA), USA, 2003.
Seybold, J. S.: Introduction to RF Propagation, John Wiley & Sons, Hoboken (NJ), USA, 2005.
Sheen, D. M., McMakin, D. L., and Hall, T. E.: Near Field Imag-ing at Microwave and Millimeter Wave Frequencies, IEEE/MTT-S International Microwave IEEE/MTT-Symposium, Honolulu (HI), UIEEE/MTT-SA, 3-8 June 2007, 693–1696, doi:10.1109/MWSYM.2007.380033, 2007.
Stavrou, S. and Saunders, S. R.: Review of constitutive parameters of building materials, in: Proceedings of the 12th International Conference on Antennas and Propagation ICAP, Exeter, UK, 31 March – 3 April 2003, 1, 211–215, doi:10.1049/cp:20030052, 2003.
Thajudeen, C., Hoorfar, A., Ahmad, F., and Dogaru, T.: Measured complex permittivity of walls with different hydration levels and the effect on power estimation of twri target returns, Prog. Elec-tromagn. Res. B, 30, 177–199, doi:10.2528/PIERB10091004, 2011.