O R I G I N A L R E S E A R C H
Open Access
The power of FDG-PET to detect treatment
effects is increased by glucose correction using a
Michaelis constant
Simon-Peter Williams
1*, Judith E Flores-Mercado
1, Andreas R Baudy
1, Ruediger E Port
2and Thomas Bengtsson
3Abstract
Background:We recently showed improved between-subject variability in our [18F]fluorodeoxyglucose positron emission tomography (FDG-PET) experiments using a Michaelis-Menten transport model to calculate the metabolic tumor glucose uptake rate extrapolated to the hypothetical condition of glucose saturation: MRglucmax¼Ki
KMþ½ glc
ð Þ, whereKiis the image-derived FDG uptake rate constant,KMis the half-saturation Michaelis constant, and [glc] is the blood glucose concentration. Compared to measurements ofKialone, or calculations of the
scan-time metabolic glucose uptake rate (MRgluc=Ki* [glc]) or the glucose-normalized uptake rate (MRgluc=Ki*[glc]/
(100 mg/dL), we suggested that MRglucmaxcould offer increased statistical power in treatment studies; here, we confirm this in theory and practice.
Methods:We comparedKi, MRgluc(both with and without glucose normalization), and MRglucmaxas FDG-PET measures of treatment-induced changes in tumor glucose uptake independent of any systemic changes in blood glucose caused either by natural variation or by side effects of drug action. Data from three xenograft models with independent evidence of altered tumor cell glucose uptake were studied and generalized with statistical
simulations and mathematical derivations. To obtain representative simulation parameters, we studied the distributions ofKifrom FDG-PET scans and blood [glucose] values in 66 cohorts of mice (665 individual mice). Treatment effects were simulated by varying MRglucmaxand back-calculating the meanKiunder the Michaelis-Menten model withKM= 130 mg/dL. This was repeated to represent cases of low, average, and high variability inKi(at a given glucose level) observed among the 66 PET cohorts.
Results:There was excellent agreement between derivations, simulations, and experiments. Even modestly different (20%) blood glucose levels causedKiand especially MRglucto become unreliable through false positive
results while MRglucmaxremained unbiased. The greatest benefit occurred whenKimeasurements (at a given glucose level) had low variability. Even when the power benefit was negligible, the use of MRglucmaxcarried no statistical penalty. Congruent with theory and simulations, MRglucmaxshowed in our experiments an average 21% statistical power improvement with respect to MRglucand 10% with respect toKi(approximately 20% savings in sample size).
The results were robust in the face of imprecise blood glucose measurements andKMvalues.
Conclusions:When evaluating the direct effects of treatment on tumor tissue with FDG-PET, employing a Michaelis-Menten glucose correction factor gives the most statistically powerful results. The well-known alternative ‘correction’, multiplyingKiby blood glucose (or normalized blood glucose), appears to be counter-productive in this setting and should be avoided.
Keywords:FDG-PET, Glucose correction, Michaelis-Menten, Response to treatment, Glucose bias
* Correspondence:williams.simon@gene.com 1
Department of Biomedical Imaging, Genentech, Inc., 1 DNA Way, South San Francisco, CA, 94080, USA
Full list of author information is available at the end of the article
Background
Quantitative [18F]fluorodeoxyglucose positron emission tomography (FDG-PET) is increasingly relied upon to measure pharmacodynamic responses in controlled trials, bringing a greater need for accurate and reprodu-cible scans to minimize the number of subjects needed for a successful trial. Glucose levels have long been recognized as a factor modulating FDG uptake [1-8]; but even so, there has been some debate regarding how best to compensate for changing glucose levels when com-paring scans. Some investigators have eschewed glucose corrections altogether after observing increased rather than decreased statistical noise in ‘corrected’ PET mea-surements, attributing this, perhaps, to error in the glu-cose measurement itself [9,10]. However, avoiding glucose correction poses a conundrum of interpretation when a treatment may induce a systematic change in blood glucose levels. Such treatments are known, and FDG-PET may be used to assess their impact; they in-clude some potentially important new drugs still under clinical investigation, such as certain Akt and PI3K inhi-bitors [11,12].
The seminal work of Sokoloff et al. [13] described the Michaelis-Menten kinetics of glucose and tracer trans-port and showed how the radioactive tracer uptake rate constant (Ki) could be used to estimate the tissue glu-cose uptake in physiological units, i.e., the metabolic rate of glucose (MRgluc=Ki*[glc]/LC μmol glucose per 100 g tissue per min). Under steady-state conditions, the half-saturation Michaelis constants (KM) and the maximal velocities (Vmax) for tracer and glucose are factored into the lumped constant (LC) which summarizes the differ-ential properties of tracer and glucose. Scans obtained under different blood glucose levels will almost inevit-ably indicate different metabolic rates of glucose, and one must decide how to detect changes in tumor glucose metabolism that are not merely due to changes in blood glucose.
We recently demonstrated [14] that in untreated ani-mals, both tumor Ki values and MRgluc values were, on the average, strongly correlated with blood glucose, showing that an appropriate form of blood glucose correction might facilitate the identification of treat-ment effects under changing glucose conditions. We sought to understand this glucose effect so that an ap-propriate compensating correction could be made, expecting that this would improve the power to detect treatment effects.
The Michaelis-Menten relationship between glucose concentration and transport [13-19] was used as the basis of the proposed correction. With it, we showed that, on the average, there was less variability in un-treated animals when estimating the hypothetical glucose-saturated limit to the tumor metabolic rate of
glucose MRmax gluc
rather than the tracer rate constant
(Ki) or the actual scan-time metabolic rate of glucose (MRgluc). MRmax
gluc is the asymptotic limit to the plot of
uptake rate versus [glucose]. KM is a half-saturation Michaelis constant such that MRmax
gluc ¼KiðKMþ½ glcÞ.
To demonstrate a true drug-induced treatment effect on glucose uptake in the tumor tissue independ-ent of any changes in blood glucose (see Table 1 and Additional files 1 and Additional file 2), we selected dynamic FDG-PET scans from 60 mice treated with inhibitors of the cell-signaling MEK and RAF tyrosine kinases [20,21]. These have previously been reported as modulating FDG-PET in preclinical and clinical set-tings [22-24], and we have observed drug-induced reductions in FDG uptake both in solid tumors and in cell culture. A plausible mechanism for this reduction was demonstrated through GLUT-1 immunofluores-cence. We analyzed data before and after 7 days of treatment, a compromise between early read-out and being certain that the treatment had had time to take effect.
Because limited experimental studies alone were inad-equate to explore with any certainty the power relation-ships in (relatively noisy) FDG-PET data, we have supplemented these experiments with statistical simula-tions and with analytical derivasimula-tions that are presented in Additional file 3.
Methods
The experimental setting
Our laboratory experiments employed dynamic FDG-PET to measure the tumor uptake rate constant for FDG,Ki, as a function of tumor treatment with tyrosine kinase inhibitor drugs. The experiments contained two or more groups of animals: one control group adminis-tered vehicle alone, and at least one treatment group administered an active drug in the same dosing vehicle. We analyzed data before and after 7 days of treatment, expecting that there would be no difference between the groups before treatment and that some treatment effect would be evident after 7 days. We comparedKiwith two alternative PET metrics that account for blood glucose in some way, MRgluc and MRglucmax, to study the relative
Table 1 Treatment studies, cell lines, and drug substances
Study Cell line Tissue Type Drug substance Mice
A A375 Melanoma GDC-0879 (BRAF) 18
B A2058 Melanoma G-00033054 (MEK) 18
C HCT116 Colorectal GDC-0973 (MEK) 24
merits of each metric at detecting a true tumor treat-ment effect as seen in the two-sample two-sided t-test. This is also the scenario the simulations (below) and power calculations (Additional file 3) are designed to represent.
False positives
We considered that a true treatment effect altering tumor glucose uptake was one based on a physiological change in the tumor tissue per se. Thus, for our purposes, changes in tumor glucose uptake caused merely by altera-tions in blood glucose were not true treatment effects but fall into our definition of false positive results.
Laboratory experiments
Animal handling and imaging
Experimental details were as described previously [14,25]. All animals were fasted overnight with access to waterad libitum. Mice were induced and maintained under light anesthesia using isoflurane in air (GDC-0879 study) or sevoflurane in air (G00033054 and GDC-0973 studies). Body temperature was maintained at 37°C with warm air flows while the eyes were pro-tected from dehydration with ophthalmic ointment. All studies were conducted under the approval of Genente-ch's AAALAC-accredited Institutional Animal Care and Use Committee. All animals underwent 30-min dy-namic FDG-PET scans with X-ray computed tomog-raphy (CT)-based attenuation correction just prior to starting their treatment regimen. FDG doses were infused via the lateral tail vein over a 1-min period in a volume of 100μL.
Blood glucose measurements
At every scan, blood glucose measurements were taken twice: once approximately 5 min before and once shortly after the PET/CT scan approximately 35 min later. The glucose value used in subsequent calculations is the mean of the pre- and post-scan measurements. Data were collected with the commercially available Contour glucometer (Bayer Healthcare, Tarrytown, NY, USA) using blood freshly obtained by pricking the saphenous vein. Test-retest reproducibility measurements using this instrument in our hands showed a coefficient of vari-ation of 3.7% [14].
Prior use of the experimental data
The 665 mice in 66 studies (Table 2) used here to inform the simulation parameters are mostly the same as those 585 mice described in our analysis of variability [14], refined slightly by adding in data from newly available cohorts of A375, HCT116, and MEL-537 mice and re-moving a small number of animals for which post-treatment scans were unavailable (H596, A2058).
Tumor treatment models with established drug effects on tumor glucose uptake
Table 1 describes the subset of studies from Table 2 in which there was additional non-imaging evidence of a true treatment effect on tumor glucose uptake independ-ent of blood glucose levels. Athymic nude mice were implanted in the right flank with a Matrigel/Hanks Balanced Salts medium containing 10 million melanoma (A375, A2058) or 5 million colorectal (HCT116) cancer cells. Tumors reached a group median volume of at least 250 mm3 prior to beginning the study. The blood glu-cose and FDG-PET data (Ki, MRgluc, MRmax
gluc) are pre-sented for these studies in Additional file 1. Cell culture experiments were used to show direct drug effects on FDG uptake, and immunofluorescence was used to show an apparent loss of GLUT-1 at the cell membrane both in cells and tumor tissue (see Additional file 2 for descriptions of and results for those experiments).
Statistical power in experimental data: p-values as a function of sample size
Two-sample two-sidedt-testp-values were calculated in these three true treatment studies: A, B, and C described in Table 1. This was repeated using, MRglucmax, MRgluc, and
Ki. We examined thep-values at baseline, where the null hypothesis should be accepted, and on treatment at day 7, where the null hypothesis should indeed be rejected based on our knowledge of drug action on tumor cell and tissue glucose handling (Additional file 2).
A preliminary analysis confirmed that our A375 (n= 9), A2058 (n= 9), and HCT116 (n= 12 per group)
Table 2 Animal models and number of mice
Model Cell line/strain Number of cohorts
Number of mice
Control Treatment Control Treated
1 BT474 in SCID
Nude Beige
2 2 22 22
2 HCT116 in Nu/Nu 5 8 54 86
3 PC3 in Nu/Nu 2 2 24 24
4 FaDu in CB17 SCID 1 1 10 10
5 H292 in CB17 SCID 1 1 10 10
6 H596 in huHGF
transgenic
1 3 11 33
7 537-Mel in Nu/Nu 2 4 17 31
8 A2058 in Nu/Nu 4 10 39 99
9 A375 in Nu/Nu 4 7 35 64
10 Colo205 in Nu/Nu 1 1 12 12
11 H2122 in Nu/Nu 1 3 10 30
Subtotal 24 42 244 421
tumor studies were powered with sufficient numbers of animals to detect large treatment effect sizes using any FDG-PET metric: Ki, MRgluc, or MRglucmax. To examine how studies with less power might perform, we under-took the simulations described below and supplemented those with a meta-analysis of smaller groups obtained by sampling within our experimental data. We considered the full cohort of animals prepared for a given study to be the ‘universe’ of animals from which the smaller groups were drawn randomly using sampling without re-placement. We calculated results (presented in Figure 1) for every possible combination of individuals as long as the number of combinations totaled less than 4,000;
when more combinations were possible, we randomly sampled 4,000 cases to generate our results.
False positive rates in experimental data: relation to sample size
Mice were randomized into nominal control and treat-ment groups, each containingn= 6 to 12 mice (Table 2), allowing 42 comparisons of two-sample two-sidedt-tests to be performed on FDG-PET data collected before any treatment was administered. At this timepoint, a sta-tistically significant result was considered to represent a false positive result. A particular study was flagged as having a high rate of false positives whenever the
A
B
C
Sample size
p
v
alue
1e 04 0.001 0.01
0.050.1
1
5 6 7 8 9 10 11 12
Ki
MRgluc
MRglucmax
HCT116 colon cancer treated with MEK Inhibitor (GDC 0973)
Sample size
p
v
alue
1e 04 0.001 0.01
0.050.1
1
5 6 7 8 9
Ki
MRgluc
MRgluc max
A2058 melanoma treated with MEK Inhibitor (G00033054)
Sample size
p
va
lu
e
1e 04 0.001 0.01
0.050.1
1
5 6 7 8 9
Ki
MRgluc
MRgluc max
A375 melanoma treated with BRAF Inhibitor (GDC 0879)
t-tests rejected the null hypothesis (p<0.05) more often than the theoretical false positive rate (α) of 5%, measured across all the combinations of individuals tested. Meta-analysis of progressively smaller subsets as described above was used to assess how the false positive error rate would behave in smaller, less powerful, studies. This was repeated using MRglucmax, MRgluc, and Ki.
Pharmaceuticals
GDC-0879 is a B-RAF [20] selective kinase inhibitor [26,27] that has been demonstrated to be effective against cancers carrying the V600 mutation [28]. MEK is one of the three enzymes of the mitogen-activated pro-tein kinase (MAPK) cascade involved with RAS/RAF sig-naling [21]. G00033054 and GDC-0973 are potent and selective MEK inhibitors that have been efficacious in treating KRAS and RAF mutant cells [29].
All drug substances were dosed daily in 100μL of ex-cipient. GDC-0879, GDC-0973, and G00033054 were dosed for 7 days at 100 mg/kg, 10 mg/kg, and 25 mg/kg, respectively. All animals were dosed through oral gavage (per os). Control groups were subjected to the same regi-men but received no active drug in their dosing solution.
Derivations, statistics, and simulations
We studied the properties of the two-sample two-sided
t-test comparing sample means of Ki and MRglucmax be-tween control and treatment groups, respectively, in analytical derivations (presented as Additional file 3) and in simulations which are described below. Data were simulated assuming either no treatment effect or assum-ing a treatment effect of 10% to 50% change in the glucose-saturated limit to the tumor glucose uptake rate, MRmax
gluc, specified in each simulation. As a function of the involved parameters, our study evaluated the test statistics under both the null and alternative hypotheses by estimation of false positives (including significant test results caused merely by changes in blood glucose) and the power to detect true differences in the tumor glu-cose uptake rate limit. Simulations were run in the stat-istical programming language R [30].
We assumed that the relationship between the FDG rate constant Ki and glucose [glc] followed the Michaelis-Menten (MM) form [14-19] and that obser-vations of the rate constant were corrupted by noise. That is, the observed rate constant was given by
Ki¼MRglucmax=ðKMþ½ glcÞ þE, whereE is the zero-mean Gaussian with varianceσ2
E, here denoted asEN 0;σ2E
.
Let KCi;KTi represent the sample average FDG uptake rates acrossnobservations in the control and treatment groups, respectively, and let MR maxgluc;C and MR maxgluc;T be
the sample averages of the quantityKi* (KM + [glc]) in the two groups. Under these assumptions, we compared the statistical properties of thet-test comparing KCi and
KiTwith thet-test comparingMR glucmax;CandMR maxgluc;T. The analytical derivation of the power functions re-lating to Ki and MRglucmax follows standard develop-ments based on the Gaussian distribution [31] and is presented for the interested reader in Additional file 3. To illustrate the validity of the derivation and to de-lineate when MRmax
gluc provides significantly improved statistical properties vis-à-vis Ki, we simulated obser-vations from the joint process (Ki, [glc]) as follows. Given the parameters MRmax
gluc;KM;μg;σ2g;σ2E
n o
, a single
draw of (Ki, [glc]) was obtained by first sampling glc
½ N μg;σ2
g
andEN 0;σ2 E
, and then by evaluat-ing Ki¼MRglucmax=ðKMþ½ glcÞ þE. For each simulation iteration, the preceding was repeated n times each in the control and treatment groups, respectively, and two-sided t-tests were used to test for equality of means at
α= 0.05 level of significance. A total of 4,000 simulation iterations were used in each setting.
To get representative simulations, we chose parameter values based on output from fitting the MM model to FDG-PET data from each of the 66 (as-yet-untreated) experimental cohorts of mice described in Table 2. For these studies, with the half-rate Michaelis constant set at
KM= 130 mg/dL [14], the scatter plot in Figure 2 shows estimates of MRmax
gluc versus σE. For MRglucmax, the sample mean and standard deviation were 47.9 and 12.7, re-spectively (range = 31.0 to 92.0), and for σE, they were 0.048 and 0.018, respectively (range = 0.022 to 0.113). Based on these values, the first simulation setting (‘S1’, noted on the face of Figure 2) represents an ‘average’ case with MRglucmax and σEset at their sample mean values of 48 and 0.048. The second (‘S2’) and third (‘S3’) set-tings (likewise noted on the face of Figure 2) represent cases with strong and weak signal-to-noise ratios, where MRglucmax and σEare set to (55, 0.028) and (38, 0.057), re-spectively. In each simulation, glucose was sampled according to [glc] ~N(90, 252), the approximate marginal distribution of glucose across the sample data, and KM remained fixed at 130 mg/dL.
For simulations under the null hypothesis, the max-imal uptake rate MRmax
gluc was set the same in the control and treatment groups, and we evaluated the effect on the false positive rate (i.e., concluding that there is a treatment effect when in fact there is none) caused merely by a change in mean blood glucose. Mean blood glucose changes of 10%, 20%, and 30% were assessed.
corresponding to an approximate 20% to 30% reduction in the tumor glucose uptake rate limit MRglucmax while keeping the glucose distribution the same. Sample sizes were chosen betweenn =6 andn =12.
The robustness of MRglucmax to errors in [glucose] and
KM was also investigated by simulations. For errors in the measurement of blood glucose, we replaced the quantity Ki (KM+ [glc]) by Ki (KM+ [glc]*), where [glc]* = [glc] +N(0, 42). That is, the Ki values were gener-ated using the correct (uncorrupted) glucose values [glc], while MRglucmax was estimated using observed (corrupted) glucose [glc]*. A similar process of substitution was used withKM,using scenarios (KM= 100 mg/dL,KM* = 130 mg/ dL) and (KM= 130 mg/dL,KM* = 100 mg/dL).
Results and discussion
Results
Statistical and blood glucose-induced false-positive error rates
In the absence of any glucose bias between the control and treatment groups, the t-tests based on Ki, MRglucmax, and MRgluc all have simulated false positive rates which are consistent with the nominal statistical type I false positive error rate of α= 0.05. However, as seen in Table 3, for the first simulation setting with n= 12
observations per group, only the test based on MRglucmax preserves the correct false positive error rate in the pres-ence of a glucose bias, while the tests based on Ki and MRgluc both perform increasingly poorly as the magni-tude of the bias grows. The increase in the false positive rate can be understood by noting that any glucose bias induces a shift in Ki that is false with regard to effects intrinsic to the tumor. Specifically, under the Michaelis-Menten model, a shift in mean glucose between the control and treatment groups byδgunits translates into an approximate (first-order) MRmax
gluc=ðKMþμgÞ
2δ
g
change in the mean level of Ki (see Additional file 3). For instance, in the first simulation setting S1, a 30% average increase in mean glucose from μg= 90 in the control to 117 mg/dL in the treatment group induces a false, average change inKiof−0.0268 per second or ap-proximately−11.0%. Substituting forδKiin the analytical power equation (see Equation 1 in Additional file 3)
Table 3 False positive error rates (%)
Glucose bias −30% −20% −10% 0% 10% 20% 30%
Ki 25.7 13.1 6.5 4.8 6.5 12.5 18.4
MRmaxgluc 5.0 4.9 5.4 4.9 4.9 5.0 4.5
MRgluc 41.8 18.2 8.6 5.1 6.8 14.2 23.6
0.02 0.04 0.06 0.08 0.10
30
40
50
60
70
80
90
std.dev
MR
gluc
max
Estimates of Stand.Dev.( ) vs. MRglucmax
S1
S2
S3
yields an estimated false positive error rate of 19.3%, in close agreement with the simulated value of 18.4% (see Table 3). The same strong effect on the false positive error rate due to a glucose shift was observed for the second and the third simulation settings, S2 and S3 (results not shown).
The error rates are expressed as percentages for a two-sided t-test at level α= 0.05 based on Ki;MRglucmax, and MRgluc as a function of glucose bias. Glucose bias is defined as the percent change in mean glucose between the control and treatment groups. Here, MRglucmax¼ 48;σE¼0:048;n¼12.
As predicted by the derivations, all three metrics (Ki, MRgluc, and MRmax
gluc) correctly accepted the null hy-pothesis at baseline in the 42 comparisons of the con-trol with treatment groups in the full experimental data (Table 2). Also as expected, false-positive results began to appear as the data were resampled at smaller sample sizes. At sample sizen= 8, for example, only one com-parison showed high false positive rates by Ki and MRmax
gluc, at which point MRglucgave false positives in 6 out of the 42 studies (14%).
Elimination of MRglucfrom further consideration
Because results based on MRglucwere highly influenced by relatively modest levels of glucose bias (Table 3), results that we considered to be false in terms of treat-ment response, we judged that the most suitable
alternative to MRglucmax was the (uncorrected) Ki. We henceforth simplify the presentation of simulation results and analytical derivations by restricting them only to Ki and MRglucmax. The performance of MRgluc in the experimental data is, however, shown alongside
Ki and MRglucmax (Additional file 1 and Figure 1).
Statistical power in theory and in simulation
As shown in the analytical power derivations presented in Additional file 3, an improvement in power for MRmax
gluc , Pm, relative to the power for Ki, Pk, occurs whenever the coefficient of variation (CV) in Ki evalu-ated at the mean glucose level is less than 1. That is, with Pk, Pm the power curves for a test of means of Ki and MRmax
gluc , respectively, then, whenever CV = σE/Ki(μg) <1, where Ki μg ¼MRglucmax= KMþμg
, we have
Pm> Pk. Moreover, through manipulation of Equations 1 and 2 in Additional file 3, we see that the difference
Pm−Pkis monotonic, increasing with decreasing CV. Fur-ther, the differencePm−Pkgrows asσ2g increases (holding CV constant). We now detail these facts by simulation.
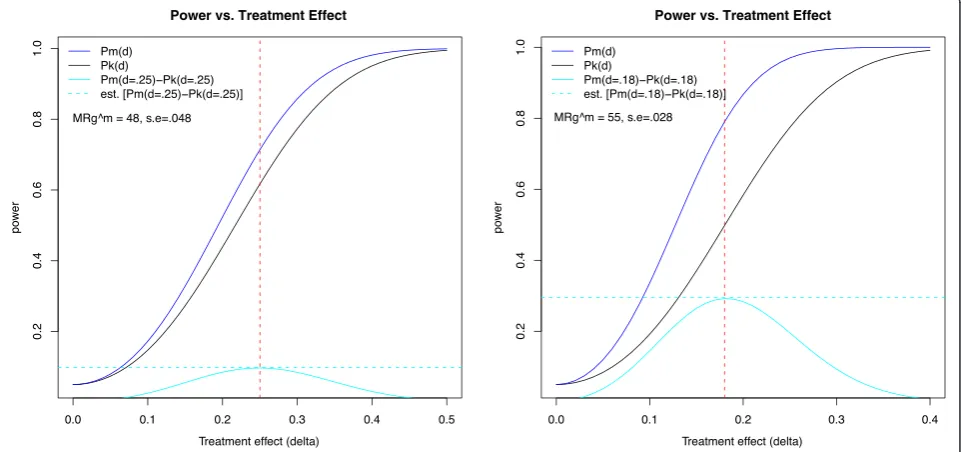
Figure 3 shows the theoretical power curves Pk (blue solid line) andPm(black) for the first and second simu-lation settings, S1 (left panel) and S2 (right panel). The first case, S1, represents an average study with para-meters MRmax
gluc and σE set at the mean levels and with
n =10; a potential improvement of approximately 10%
Power vs. Treatment Effect Power vs. Treatment Effect
Figure 3Power curves as a function of the treatment effect (δ).Simulation settings S1 and S2 are as shown in Figure 2. In S1 (left), MRmax
gluc ¼48;σE¼0:048;n¼10, and in S2 (right), MRglucmax¼55;σE¼0:028;n¼6. The solid blue and black lines represent the theoretical power curves for MRmax
occurs at a treatment effect of δ= 0.25 (cyan solid line), with a corresponding simulated improvement of 9.8%. The second case, S2, exemplifies a study with a particu-larly good signal-to-noise ratio, i.e., lowσE. Here, an im-provement of approximately 29.2% occurs for δ= 0.18, with a simulated improvement of 29.9%.
The third simulation case, S3, representing very noisy data where MRglucmax¼38;σE¼0:057;n¼10 , has a
max-imum improvement in power of 2.2%, occurring for
δ= 0.55 (plot not shown). This indicates that with low signal-to-noise ratios in the Ki measurement, there is no meaningful improvement in power from using MRglucmax. However, cases with high coefficient of variation inevitably have low power and require either very large treatment effects or very large sample sizes to detect a difference in means. Indeed, for case S3, we would require n= 40 for 80% power to detect a treatment effect ofδ= 0.25.
For the case n= 8, δ= 0.3, the left panel of Figure 4 shows the power improvement as a function of the coef-ficient of variation across the 66 cohorts considered (Table 2). The right panel of Figure 4 offers an alterna-tive perspecalterna-tive on this power improvement, being the sample size required to perform a well-powered study (80% chance of correctly rejecting the null hypothesis). An average study that requires 10 animals per group using Ki is equivalently powered using 8 animals per group with MRmax
gluc. In addition, the MRglucmaxmeasurements resist false positive results in the event of glucose bias.
Congruent with the main result outlined in the deri-vations presented in Additional file 3, the improvement in power is strongly dependent on the coefficient of variation in Ki, with the largest power improvement reaching approximately 25%. Moreover, the greater the coefficient of variation for Ki, the less we can discern the effects due to glucose; however, as noted, no test performs well with excessively noisy data.
Statistical power in experimental data
On the average and in agreement with the simulations, MRglucmax gave greater power than Ki or MRgluc in detecting the known direct on-tumor drug effects in all three tumor treatment models studied (Table 1 and Figure 1). As expected, all metrics progressively lost power as the sample size decreased. For example, in Figure 1A at eight mice per group, MRglucmax was able to reject the null hypothesis in 93% of the 4,000 combina-tions of control vs. treatment groups, while Ki did so in only 52% of the sample combinations. In Figure 1B, MRgluccompletely misses the treatment effect at all sam-ple sizes, butKiand MRglucmax correctly identified it. Lastly, in Figure 1C, looking at six mice per group, we observe that MRmax
gluc detected a statistically significant difference between the groups, 89% of all the sample combinations, while MRgluc did so in only 62% of the cases. However, caution must be exercised in drawing fully general
0.10 0.15 0.20 0.25 0.30 0.35 0.40
0.00
0.05
0.10
0.15
0.20
0.25
CV
P
o
w
er impro
v
ement
S1 S2
S3
n=8, delta=.2
Coef. Variation vs. Power Improvement
0.10 0.15 0.20 0.25 0.30 0.35 0.40
0
5
10
15
20
25
30
35
CV
Sample Siz
e
Required sample size for 80% power at delta=0.3
K_i MRg^max
S1
S2
S3
Figure 4Power improvement.Left panel: power improvement in using MRmax
conclusions from these limited and somewhat noisy ex-perimental data alone.
Discussion
Application of MRgluc
The original intent behind the multiplication of Ki by [glucose] was to estimate the metabolic rate of glucose (MRgluc) in tissue under given blood glucose levels based on rate constants derived from monitoring a radioactive glucose-like tracer in blood and tissue [13,32]. The esti-mation implies the assumption that MRgluc depends on substrate concentration, i.e., [glucose] in blood. It fol-lows that MRglucis unsuitable for our particular task of quantitatively compensating for changing glucose levels when comparing scans collected under different glucose conditions. Our results show that even seemingly small differences in blood glucose, such as the natural varia-tions within a group of similar individuals, are sufficient to warrant careful attention to glucose correction when making quantitative comparisons.
The lumped constant
Measurement of the lumped constant (LC) is not trivial, and thus, the (ideal) per-patient or per-lesion values are rarely measured and reported with FDG-PET treatment studies. Instead, a common constant value of LC is ap-plied to all scans. This approach was employed in this study too with an assumed LC value of 1, and as previ-ously noted [14], the chosen value of LC simply behaves as a scaling factor common to every data point and thus makes no difference to calculated group statistics such as the coefficient of variation,t-testp-values, or correla-tions with blood glucose levels. The statistical results presented remain equally valid at all (non-zero) values of LC.
Glucose bias and false positive test results
All three metrics performed correctly in terms of the false positive rate in the absence of any systematic glu-cose difference between the treatment groups. The fact that the t-tests based on Ki and MRgluc suffer an increased false positive error rate under a glucose shift (Table 3) renders these tests admissible and useful only if one is certain that a treatment can have no systematic effect on glucose. Since blood glucose levels may vary, we suggest that MRglucmax makes a more robust and useful default metric for FDG-PET data.
Statistical power in the absence of any glucose bias
Figure 4 (left hand side) shows the simulated improve-ment in power for a modest treatimprove-ment effect of 20% and a sample size of n= 8. As can be seen, the power im-provement can be as large as 25% and is highly
dependent on CV. As predicted by the analytical deriva-tions, the benefit of using MRglucmax is most pronounced at low CV. Conversely, for values of CV greater than 35%, the power benefit is negligible even though the benefit of reduced glucose bias remains. However, for data that is very variable (relative to the mean), larger treatment effects or sample sizes are always required for adequate power, a fact that is detailed in the right hand plot of Figure 4.
Figure 4 (right hand side) shows the required sample size forKiand MRglucmax as a function of the coefficient of variation in order for a study to have 80% power with a treatment effect size of 30% (δ= 0.3). As expected, for both Ki and MRglucmax, the required sample size is an in-creasing function of the CV value. We see that a CV of 22% (the average in our experiments) requires a sample size of n= 10 per group for Ki and n= 8 per group for MRglucmax. To further describe the results, we can assume a fixed sample size and consider what proportion of our 66 experimental cohorts represented adequately pow-ered groups for a treatment study: For the sample size of
n= 8, we see that 48% were adequately powered using MRmax
gluc, whereas only 26% were adequately powered with
Ki. For a sample size ofn= 12 there are more adequately powered groups, of course, but still a benefit to using MRmax
gluc: 76% using MRglucmax and 59% usingKi. Independ-ent of CV, the sample size savings achieved through the use ofMRmax
gluc in this simulation setting is approximately
two mice; in (relatively rare) situations where a CV as low as 10% can be anticipated, we see that studies can be adequately powered with only a handful of animals per group.
Understanding this behavior has practical value in designing appropriately powered preclinical FDG-PET experiments and, perhaps, in permitting a futility ana-lysis to be conducted after beginning a study with base-line scans and before expending further significant effort in drug dosing and repeated scanning.
Glucose‘normalization’and errors in the measurement of blood glucose
Glucose sampling errors have been postulated as a source of variability experienced [9,10] when applying the common [glucose]/constant normalization method [33] which is analogous to estimating MRgluc at the population mean glucose measurement (the value of the constant), typically given as 5 mM or 100 mg/dL.
Simulations showed that MRglucmax results were robust even with relatively large 10% errors in the glucose mea-surements (full results not shown). This can be intuited by noticing that theKMterm is on the order of the [glu-cose] term, making the glucose measurement error, Eglc, a small part of the total correction factor, KM + [glc] + Eglc. We also note that the algebraic form of this correc-tion factor, i.e., [glucose] + constant, appears as a solu-tion in analytical derivasolu-tions that simply start with the very general assumption that Ki is negatively correlated with [glucose] over a limited range of glucose values. This is presented in Additional file 3 for the interested reader.
Optimal group comparisons with linear regression
We note that MRglucmax is optimally estimated by regres-sing Ki on the quantity 1/(KM+ [glc]) under the Michaelis-Menten model assumptions specified, with the noise process E following the Gaussian distribution and with a fixed value for KM. Here, we condition on the glucose measurements and set the intercept to zero. Given our setup, in the regression framework, the t-test of equality of the maximal uptake rates MRglucmax;C and MRglucmax;T is a likelihood ratio test and the uniformly most powerful unbiased test [34]. Moreover, statistically speaking, the regression estimator is best linear unbiased under non-Gaussian assumptions [35]. We also note that the variance of the regression esti-mator and that of the sample average MR maxgluc are close provided that the spread in the term (KM + [glc]) is low relative to its mean. In our setting, since
σg= KMþμg
0:1, the linear regression and sample average solutions are very close to each other, and ei-ther may be used when testing for a treatment effect. Thus we expect that the familiar and straightforward use of sample means (averaging data from multiple individuals) will be satisfactory when using MRglucmax in practice, just as it is for Ki.
Conclusions
Quantitative comparisons of FDG-PET scans across time or between animals are subject to an elevated risk of erroneous results when they ignore blood glu-cose levels. Multiplying PET data by blood gluglu-cose levels or ‘normalizing’ the blood glucose to a common reference value (100 mg/dL, for example) offers no protection; in fact, it is frequently counterproductive. However, by calculating the hypothetical value of the maximum glucose uptake rate under saturating glucose conditions, MRglucmax, we see reduced problems of glu-cose bias and gain increased statistical power to detect treatment effects. Based on the average properties
observed across 66 preclinical cohorts, the power im-provement for MRglucmax was equivalent to reducing the sample size by 20% compared to the next best option, which was using the uncorrected Ki data.
These benefits were realized in our preclinical studies of tyrosine kinase inhibitors by computing MRglucmax ¼
KiðKMþ½ glcÞ using a KM of 130 mg/dL. The analyt-ical derivations and simulation methods described in this work should facilitate the exploration and assessment of our method in other settings. Because it is superior to making no glucose correction and its benefits are easily obtained and come with no penalty, we highly recom-mend the use of (KM+ [glc]) rather than [glucose] or [glucose]/(100 mg/dL) as the glucose correction factor in quantitative FDG-PET studies.
Additional files
Additional file 1:Title: FDG-PET datain vivofor the three true treatment studies.Description: Summary results for tumor FDG-PET in three exemplary xenograft models.
Additional file 2:Title: FDGin vitroand GLUT-1.Description: Evidence of drug action on cellular glucose uptakein vitroandin vivofor the same three models presented in Additional file 1.
Additional file 3:Title: Analytical derivations of the power functions.Description: Statistical power calculations: analytical derivation.
Competing interests
The authors declare that they have no competing interests.
Authors’contributions
SPW initiated and directed the work and wrote the manuscript. JEF helped with the PET experiments and image analysis, and undertook the data curation and mining, statistical analysis, and figure preparation, AB undertook the treatment validation work presented in Additional file 2. RP critically reviewed the data analysis, figures, and manuscript. TB oversaw the statistical analysis, ran the simulations, and prepared the mathematical analysis of Additional file 3. All authors read and approved the final manuscript.
Acknowledgment
The authors would like to acknowledge the contributions of Annie Ogasawara, Alex Vanderbilt, Karisssa Peth, Leanne McFarland, Darlene DeLa Cruz, Jeff Tinianow, and Herman Gill for their help in executing the PET studies analyzed here.
Author details
1Department of Biomedical Imaging, Genentech, Inc., 1 DNA Way, South San
Francisco, CA, 94080, USA.2Department of Pharmacokinetics and
Pharmacodynamics, Genentech, Inc., South San Francisco, CA, 94080, USA.
3Department of Biostatistics, Genentech, Inc., South San Francisco, CA, 94080,
USA.
Received: 14 May 2012 Accepted: 15 June 2012 Published: 27 June 2012
References
1. Wahl RL, Henry CA, Ethier SP:Serum glucose: effects on tumor and normal tissue accumulation of 2-[F-18]-fluoro-2-deoxy-d-glucose in rodents with mammary carcinoma.Radiology1992,183(3):643–647. 2. Lindholm P, Minn H, Leskinen-Kallio S, Bergman J, Ruotsalainen U, Joensuu H:
3. Diederichs CG, Staib L, Glatting G, Beger HG, Reske SN:FDG-PET: elevated plasma glucose reduces both uptake and detection rate of pancreatic malignancies.J Nucl Med1998,39(6):1030–1033.
4. Torizuka T, Zasadny KR, Wahl RL:Diabetes decreases FDG accumulation in primary lung cancer.Clin Positron Imag Offic J Inst Clin PET1999, 2(5):281–287.
5. Zhuang HM, Cortes-Blanco A, Pourdehnad M, Adam LE, Yamamoto AJ, Martinez-Lazaro R, Lee JH, Loman JC, Rossman MD, Alavi A:Do high glucose levels have differential effect on FDG uptake in inflammatory and malignant disorders?Nucl Med Commun2001,22(10):1123–1128. 6. Gorenberg M, Hallett WA, O'Doherty MJ:Does diabetes affect [(18)F]FDG
standardised uptake values in lung cancer?Eur J Nucl Med Mol Imaging
2002,29(10):1324–1327.
7. Eary JF, Mankoff DA:Tumor metabolic rates in sarcoma using FDG-PET.J Nucl Med Offic Publ, Soc Nucl Med1998,39(2):250–254.
8. Young WG, Deutsch JA:Effects of blood glucose levels on [14 C]2-deoxyglucose uptake in rat brain tissue.Neurosci Lett1980,20(1):89–93. 9. Hallett WA, Marsden PK, Cronin BF, O'Doherty MJ:Effect of corrections for
blood glucose and body size on [18F]FDG-PET standardised uptake values in lung cancer.Eur J Nucl Med2001,28(7):919–922.
10. Hadi M, Bacharach SL, Whatley M, Libutti SK, Straus SE, Rao VK, Wesley R, Carrasquillo JA:Glucose and insulin variations in patients during the time course of a FDG-PET study and implications for the "glucose-corrected" SUV.Nucl Med Biol2008,35(4):441–445.
11. Crouthamel MC, Kahana JA, Korenchuk S, Zhang SY, Sundaresan G, Eberwein DJ, Brown KK, Kumar R:Mechanism and management of AKT inhibitor-induced hyperglycemia.Clin Can Res Offic J Am Assoc Canc Res
2009,15(1):217–225.
12. Gallagher EJ, Fierz Y, Vijayakumar A, Haddad N, Yakar S, Leroith D:Inhibiting PI3K reduces mammary tumor growth and induces hyperglycemia in a mouse model of insulin resistance and hyperinsulinemia.Oncogene2011, doi:10.1038/onc.2011.495.
13. Sokoloff L, Reivich M, Kennedy C, Des Rosiers MH, Patlak CS, Pettigrew KD, Sakurada O, Shinohara M:The [14C]deoxyglucose method for the measurement of local cerebral glucose utilization: theory, procedure, and normal values in the conscious and anesthetized albino rat.
J Neurochem1977,28(5):897–916.
14. Williams SP, Flores-Mercado JE, Port RE, Bengtsson T:Quantitation of glucose uptake in tumors by dynamic FDG-PET has less glucose bias and lower variability when adjusted for partial saturation of glucose transport.EJNMMI Res2012,2(1):6.
15. Gottesman I, Mandarino L, Verdonk C, Rizza R, Gerich J:Insulin increases the maximum velocity for glucose uptake without altering the Michaelis constant in man. Evidence that insulin increases glucose uptake merely by providing additional transport sites.J Clin Investig
1982,70(6):1310–1314.
16. Kuwabara H, Evans AC, Gjedde A:Michaelis-Menten constraints improved cerebral glucose metabolism and regional lumped constant
measurements with [18F]fluorodeoxyglucose.J Cereb Blood Flow Metab
1990,10(2):180–189.
17. Yki-Jarvinen H, Young AA, Lamkin C, Foley JE:Kinetics of glucose disposal in whole body and across the forearm in man.J Clin Investig1987, 79(6):1713–1719.
18. Burrows RC, Freeman SD, Charlop AW, Wiseman RW, Adamsen TC, Krohn KA, Spence AM:[18F]-2-fluoro-2-deoxyglucose transport kinetics as a function of extracellular glucose concentration in malignant glioma, fibroblast and macrophage cells in vitro.Nucl Med Biol2004,31(1):1–9. 19. Rivenzon-Segal D, Rushkin E, Polak-Charcon S, Degani H:Glucose
transporters and transport kinetics in retinoic acid-differentiated T47D human breast cancer cells.Am J Physiol Endocrinol Metab2000,279(3): E508–E519.
20. Kolch W:Meaningful relationships: the regulation of the Ras/Raf/MEK/ ERK pathway by protein interactions.Biochem J2000,351(Pt 2):289–305. 21. Thompson N, Lyons J:Recent progress in targeting the Raf/MEK/ERK
pathway with inhibitors in cancer drug discovery.Curr Opin Pharmacol
2005,5(4):350–356.
22. Williams SP, Fredrickson J, Mckenzie M, Jones C, Gates M, Hoeflich K, LoRusso P, Rosen L, Sikic B, Ma W, Chan I, de Crespigny AJ:Preclinical and clinical evidence for MEK pathway inhibition by GDC-0973 using FDG-PET. Presentation 1280/5. InProceedings of the American Association for Cancer Research 102nd Annual Meeting: April 2–6 2011; Orlando.
23. McArthur GA, Puzanov I, Ribas A, Chapman PB, Kim KB, Sosman JA:Early FDG-PET responses to PLX4032 in BRAF-mutant advanced melanoma [abstract].J Clin Oncol2010,28:15s.
24. Carlino MS, Saunders CA, Gebski V, Menzies AM, Ma B, Lebowitz PF: Heterogeneity of FDG-PET response to GSK2118436, an inhibitor of oncogenic mutant BRAF-kinase in BRAF-mutant metastatic melanoma [abstract].J Clin Oncol2011,29.
25. Flores JE, McFarland LM, Vanderbilt A, Ogasawara AK, Williams SP:The effects of anesthetic agent and carrier gas on blood glucose and tissue uptake in mice undergoing dynamic FDG-PET imaging: sevoflurane and isoflurane compared in air and in oxygen.Mol Imag Biol2008, 10(4):192–200.
26. Wan PT, Garnett MJ, Roe SM, Lee S, Niculescu-Duvaz D, Good VM, Jones CM, Marshall CJ, Springer CJ, Barford D, Marais R, Cancer Genome Project: Mechanism of activation of the RAF-ERK signaling pathway by oncogenic mutations of B-RAF.Cell2004,116(6):855–867.
27. Zhang BH, Guan KL:Activation of B-Raf kinase requires phosphorylation of the conserved residues Thr598 and Ser601.EMBO J2000,
19(20):5429–5439.
28. Hoeflich KP, Herter S, Tien J, Wong L, Berry L, Chan J, O'Brien C, Modrusan Z, Seshagiri S, Lackner M, Stern H, Choo E, Murray L, Friedman L, Belvin M: Antitumor efficacy of the novel RAF inhibitor GDC-0879 is predicted by BRAFV600E mutational status and sustained extracellular signal-regulated kinase/mitogen-activated protein kinase pathway suppression.
Cancer Res2009,69(7):3042–3051.
29. Hoeflich KP, O'Brien C, Boyd Z, Cavet G, Guerrero S, Jung K, Januario T, Savage H, Punnoose E, Truong T, Zhou W, Berry L, Murray L, Amler L, Belvin M, Friedman L, Lackner M:In vivo antitumor activity of MEK and phosphatidylinositol 3-kinase inhibitors in basal-like breast cancer models.Clin Cancer Res2009,
15(14):4649–4664.
30. R Development Core Team:R: A Language and Environment for Statistical Computing. Vienna: R Foundation for Statistical Computing; 2011. 31. Rice J:Power. Mathematical Statistics and Data Analysis. Belmont: Duxbury
Press; 1995.
32. Phelps ME, Huang SC, Hoffman EJ, Selin C, Sokoloff L, Kuhl DE: Tomographic measurement of local cerebral glucose metabolic rate in humans with (F-18)2-fluoro-2-deoxy-d-glucose: validation of method.
Ann Neurol1979,6(5):371–388.
33. Boellaard R, O'Doherty MJ, Weber WA, Mottaghy FM, Lonsdale MN, Stroobants SG, Oyen WJ, Kotzerke J, Hoekstra OS, Pruim J, Marsden PK, Tatsch K, Hoekstra CJ, Visser EP, Arends B, Verzijlbergen FJ, Zijlstra JM, Comans EF, Lammertsma AA, Paans AM, Willemsen AT, Beyer T, Bockisch A, Schaefer-Prokop C, Delbeke D, Baum RP, Chiti A, Krause BJ:FDG-PET and PET/CT: EANM procedure guidelines for tumour PET imaging: version 1.0.Eur J Nucl Med Mol Imaging2010,37(1):181–200.
34. Arnold SF:Inferences in Multiple Regression. Mathematical Statistics. NJ: Prentice-Hall; 1990.
35. Christensen R:Plane Answers to Complex Questions: The Theory of Linear Models. 1st edition. New York: Springer; 1987.
doi:10.1186/2191-219X-2-35
Cite this article as:Williamset al.:The power of FDG-PET to detect treatment effects is increased by glucose correction using a Michaelis
constant.EJNMMI Research20122:35.
Submit your manuscript to a
journal and benefi t from:
7 Convenient online submission 7 Rigorous peer review
7 Immediate publication on acceptance 7 Open access: articles freely available online 7 High visibility within the fi eld
7 Retaining the copyright to your article