R E S E A R C H
Open Access
Ring testing of the AnBUSDiC test; a new
screening method for the anaerobic degradability
of surfactants
Charles Eadsforth
1, Tom Austin
1, Alain Bouvy
2, Giorgio Cassani
3, Juanantonio DeFerrer
4, Claus-Dierk Hager
5,
Diederik Schowanek
6, Klaus Taeger
7and Andreas Willing
8*Abstract
Background:Surfactants are widely used across the globe both in industrial and consumer products; their biodegradation characteristics are therefore of high importance. Upon entering a wastewater treatment plant (WWTP), the majority of surfactants are aerobically mineralized to CO2and H2O. However, a small fraction is inevitably left non-degraded and adheres to the remaining sludge. This sludge is usually further treated in
anaerobic digester tanks. Assessment of existing methods for determining anaerobic biodegradability has led to the development of a new test method, which is in principle based on the method DIN 38414 part 8. This new test, named the anaerobic biodegradation under sludge digester conditions test (abbreviated to AnBUSDiC test) allows for a quantification of the degradation of surfactants under conditions encountered in the anaerobic digester tank of municipal WWTPs. The AnBUSDiC test has several advantages over existing methods. The main advantage is that it is particularly suitable for surfactants, because the two-step design minimizes possible unspecific digester gas formation caused by the surface activity of the test substances, therefore avoiding false positive results.
Results:In order to further standardize the AnBUSDiC test and gain regulatory acceptance, a ring test was organized involving seven laboratories, and five model surfactants from different surfactant classes (anionic, non-ionic (branched and linear) and amphoteric) plus a positive control, glucose. The AnBUSDiC test produced reliable repeatable results between laboratories; however, some additional modifications were suggested. It was identified that the original test method did not identify a clear endpoint from which a biodegradation value should be taken. It was proposed that a new more concise endpoint be defined in combination with the AnBUSDiC test to allow better comparability between test results.
Conclusions:The inclusion of a second addition of test substance is a major step forward in the elimination of the variability produced by non-specific gas production. With the exception of one anomalous result for linear
alkylbenzene sulfonates, for which an explanation can be provided, the AnBUSDiC method appears to provide overall robust and interpretable results.
Keywords:Surfactants; Anaerobic biodegradation; Environmental fate; Digester tank simulation test; Ring test
* Correspondence:andreas.willing@basf.com 8
BASF Personal Care and Nutrition GmbH, Henkelstr 67, Dusseldorf 40589, Germany
Full list of author information is available at the end of the article
Background
Surfactants are widely used across the globe in both in-dustrial and consumer products, so their biodegradation characteristics are therefore of high importance. The biodegradability of a substance is a key parameter when considering the environmental implications of its use [1]. The fate of most surfactants is to be discharged in wastewater, usually entering a wastewater treatment plant (WWTP). Upon entering a WWTP a fraction of the surfactants, due to their surface-active nature, is adsorbed to the primary sludge. The remainder is almost completely mineralized to CO2and H2O in the aerator. The sludge containing the non-degraded surfactants is then further treated in anaerobic digester tanks. Cur-rently, scientifically appropriate simulation methods for the analysis of surfactants in anaerobic conditions within a WWTP (OECD 314 [2]) require radiolabeled test sub-stances, which limit the scope of such a method.
The European Commission, in a communication to the European Parliament and the Council (http://eur-lex.eur-opa.eu/LexUriServ/LexUriServ.do?uri=COM:2009:0230: FIN:en:PDF) indicated their intention to undertake fur-ther research on the anaerobic biodegradability of surfac-tants as required by Article 16(2) of Regulation (EC) No. 648/2004. In response to this ERASM informed the Com-mission of their initiative to explore an improved method for measuring anaerobic degradability under sludge di-gester conditions. Assessment of existing methods for an-aerobic biodegradability [3] led to the development of a new, improved test method, which is in principle based on the method DIN 38414 part 8 [4]. The newly developed test method, named the Anaerobic Biodegradation Under Sludge Digester Conditions test (or abbreviated the AnBUSDiC test [5]) overcomes the limitation of DIN 38414 part 8 in two ways:
(1) A well characterized amount of surfactant is added to the test system instead of the unknown test effluent to allow determination of an exact degradation rate
(2) A two-step addition of the test substance is introduced to avoid false positive results due to unspecific (excess) gas formation caused by the surface activity of the test substance.
The new AnBUSDiC test allows for a quantification of the degradation of surfactants under conditions encoun-tered in the anaerobic digester tank of municipal WWTPs. The advantages of the AnBUSDiC test are that it is particularly relevant for assessment of the environ-mental fate of surfactants, as surfactants usually end up in the digester tank of WWTPs and the two-step design minimizes possible unspecific digester gas formation caused by the surface-activity of the surface-active test
substances, thereby avoiding false positive results (i.e. the formation of biogas from unspecified substances re-leased from the sludge rather than from the added test compound). The AnBUSDiC test conditions are closer to a simulation test rather than a screening test and it is also capable of identifying whether a surfactant is de-gradable, potentially non-degradable or inhibitory to the anaerobic microorganisms (i.e. preventing or reducing biodegradation in WWTP conditions).
In order to further standardize the AnBUSDiC test and gain regulatory acceptance, a ring test was organized involving seven laboratories, the results of which are presented and discussed here.
Results and discussion
Results
Typical gas production curves for the positive control glucose are shown in Figure 1. As detailed in the original test method [5], the majority of the unspecific sludge gas production, as demonstrated by an initial gas formation, occurs during the first 21 days (phase 1). Phase 2 is therefore more representative of the true test substance biodegradation, and the initial gas production is there-fore slightly lower (Figure 1).
The associated total biodegradation curves for the positive control glucose are shown in Figure 2. The total biodegradation curve is produced (using Equation six, see [5]) based on gas production data as well as the the-oretical gas production of the test substance. In some cases, negative biodegradation values can be achieved because of the comparison between test substance bio-degradation and blank digester biobio-degradation (as shown in Figure 3). This is discussed later.
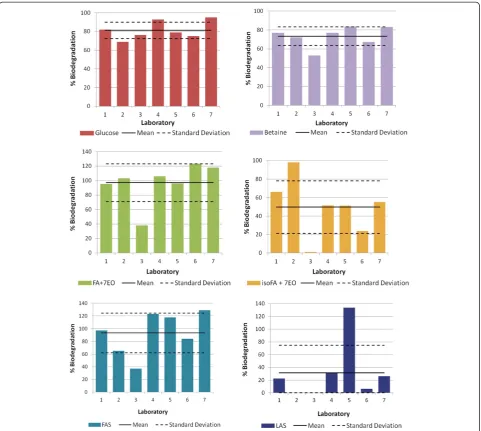
three test substances had standard deviations of around 20% to 30% and one substance (LAS) showed highly variable results with a standard deviation of around 40%. Some individual values appeared particularly erroneous; the significance of these is discussed later.
Based on the full sets of results from the participating laboratories, the two substances with the best reproduci-bility between labs were glucose and betaine. The posi-tive control, glucose, achieved a mean biodegradation of 81.2% with a standard deviation of 8.8%, whereas betaine
Biog
as pr
oduction
fo
r
tes
t
item (NL/r
eactor)
Glucose, parallel 1
Glucose, parallel 2
Glucose, parallel 3
Blank avg Test duration (days)
NL = Normalised Litre
Figure 1Representative example of total biogas production curve of glucose (positive control) compared with blank sewage sludge. Taken from a participating laboratory report.
Biodegr
adation of
the tes
t
item (%)
Glucose, parallel 1
Glucose, parallel 3 Glucose,
parallel 2 Test duration (days)
achieved a mean biodegradation of 73.3% with a stand-ard deviation of 9.8%. After reaching a maximum deg-radation, the degradation of glucose and betaine both proceed to‘plateau’as expected.
There were also two substances with higher degradabil-ity results than the positive control, glucose. FA + 7EO achieved a mean biodegradation of 97.1% with a standard deviation of 26.0%. This test substance exhibited a rapid initial degradation reaching its maximum (of 97.1%), at which point the degradation curve plateaued briefly before beginning to slowly decrease. FAS achieved a mean bio-degradation of 93.3% with a standard deviation of 31.2%. After reaching its maximum degradation (of 93.3%) the degradation curve plateaued. One of the laboratories suggested that FAS may have shown some initial toxic ef-fects at the tested concentration as the degradation of the
toxicity controls were significantly lower than the test sub-stance alone. However, the FAS degradation levels were sufficiently high to suggest that the anaerobic degradation of the test material had not been significantly affected after 60 days.
Both these high anaerobic degradation results were achieved despite the inclusion of potentially anomalous results of 38% and 37%, respectively, for these sub-stances which were both generated by laboratory 3. La-boratory 3 reported a toxic influence of test substance FAS on the inoculum which explains the lower biodeg-radation value compared with other labs; however, this is not the case for FA + 7EO. It is noted that this labora-tory also generated significantly lower biodegradation levels for a number of test substances when compared with other labs. Conversely, the degradation of the
Biodegr
a
da
tion of
the t
e
s
t it
em (%)
LAS (phase 1)
Test duration (days)
LAS + tox control (Phase 2)
LAS (Phase 2)
Figure 3LAS biodegradation curve from a participating laboratory report.
Table 1 Percentage biodegradation results, with mean, standard deviation and 95% confidence interval
Laboratory Biodegradation (%) (+/−SD, where available) <lag period in days>
Glucose Betaine FA + 7EO FAS isoFA + 7EO LAS
1 81.9 (4.7) <0> 76.8 (4.75) <0> 95.3 (2.88) <0> 97.4 (7.29) <0> 66.3 (30.7) <39> 22.7 (1.66) <0>
2 69.0 <0> 72.0 <0> 103.0 <0> 65.0 <35> 98.0 <0> 0.0 <105>
3 76.0 (4) <0> 53.0 (5.51) <0> 38.0a(11.02) <0> 37.0a(48.64) <39> 1.3a(1.53) <40> 0.0 (1.15) <40>
4 92.7 (3.51) <0> 77.0 (2.83) <0> 106.0 (15.56) <0> 123.0 (8.49) <0> 51.5 (0.71) <0> 31.0 (2.83) <0>
5 79.0 (NA) <0> 83.7 (8.7) <0> 95.9 (1.3) <0> 117.6 (3.4) <0> 51.2 (1.4) <0> 133.4a(62) <0>
6 74.9 <0> 67.3 <0> 123.4 <0> 84.0 <4> 23.9 <33> 6.2 <0>
7 95.0 <0> 83.0 <0> 118.0 <0> 129.0 <0> 55.0 <0> 26.0 <0>
Mean (+/- SD) 81.2 (8.8) 73.3 (9.8) 97.1 (26.0) 93.3 (31.2) 49.6 (28.5) 31.3 (43.3)
bMean (+/- SD) 106.9 (10.5) 102.7 (22.8) 57.7 (22.1) 14.3 (12.7)
a
Questionable result based on the reported anaerobic biodegradability of this type of surfactant, e.g. according to the DID list;b
positive control substance glucose is within acceptable limits, and therefore, it must be summised that the low value for FA + 7EO and the toxicity demonstrated by FAS was simply a result of the inherent variability be-tween inoculum sources. If these results are discounted, the results show much less variation with lower standard deviations. FA + 7EO achieves a mean degradation of 106.9% and standard deviation of 10.5%, and FAS achieves a mean degradation of 102.7% and standard de-viation of 22.8%.
The results of the remaining two substances were con-siderably influenced by two potentially anomalous re-sults. The test substance isoFA + 7EO achieved a mean degradation of 49.6% with a standard deviation of 28.5% and, in particular, showed inconsistent degradation pat-terns amongst some of the participating laboratories. During phase 2, testing isoFA + 7EO exhibited a lag phase of between 20 and 32 days in three different laboratories. The large lag phase meant that laboratory 6 potentially did not continue the study to the maximum achievable level of degradation and so would have returned a lower result. On termination of phase 2, the percentage degradation of isoFA + 7EO was still increasing, indicating that a plateau would have been reached given enough time. Additionally,
laboratory 3 only experienced minimal (i.e. 1%) anaerobic degradation of isoFA + 7EO and reported that this test substance demonstrated toxicity towards the inoculum. In two of the remaining laboratories, isoFA + 7EO did not exhibit a lag phase; however, the toxicity control deg-radation levels at the end of phase 2 were significantly lower, indicating either a toxic or inhibitory effect. If the result from laboratory 3 is discounted, then the mean degradation value for isoFA + 7EO was 57.7% with a standard deviation of 22.1%. The biodegradation curves of isoFA + 7EO are displayed in Figure 5.
LAS achieved a mean degradation of 31.3% with a standard deviation of 43.3%. All but one laboratory achieved degradation in the range 0% to 31%, with la-boratory 5 achieving a much higher anomalous value of 133.4%. If the anomalous result is discounted, then the mean degradation value for LAS was 14.3% with a stand-ard deviation of 12.7%. In the LAS studies, the initial gas formation in phase 1 proceeded normally. However, after a few days of normal degradation in phase 2, there was a severe decline in the degradation rate of LAS resulting in a downward sloping degradation curve producing negative values (as shown in Figure 3). In addition, the toxicity control also follows a similar pattern with a Start of Phase 2
small lag. These results indicate some form of inhibitory action by LAS at the tested concentrations. Total bio-degradation results (as %) for the isoFA + 7EO test sub-stance are tabulated in Table 1. Individual test subsub-stance degradation values (mean and standard deviation) are shown in Figure 4.
Discussion
Using the revised AnBUSDiC test procedure [5], there were noticeable differences in the levels of anaerobic biodegradation observed for the six different test sub-stances. When all data submitted by the participating laboratories were included, four of the test substances, FA + 7EO (a non-ionic linear alcohol ethoxylate), FAS (the anionic sodium dodecyl sulphates), betaine (an
amphoteric surfactant) together with the positive con-trol (glucose) were all efficiently anaerobically degraded with mean degradation levels of more than 70%. Pos-sible anomalous (lower biodegradation percentage) re-sults were observed from participating laboratory 3 for FA + 7EO and FAS. Exclusion of these two values resulted in higher degradation and improved standard deviation values for these two test products but does not change the overall conclusion that both these prod-ucts are efficiently anaerobically degraded. Whilst the degradation of these two substances in laboratory 3 was lower compared with the other labs, degradation of the positive control substance glucose was within the nor-mal range, and therefore, it must be summised that the low values are simply a result of the inherent variability
between inoculum sources ability to degrade the test substances. When previously tested under OECD 311 test guidelines, FA + 7EO was found to be 70% to 80% biodegradable in 60 days which supports the ring test data found in this study [1].
The test substance isoFA + 7EO (a nonionic branched alcohol ethoxylate) was anaerobically degraded slightly less (i.e. 50%) than its linear equivalent (FA + 7EO) when all the data were included. Exclusion of the lower biodegradation value (1%) submitted by laboratory 3, resulted in a higher degradation (58%) and improved standard deviation value for isoFA + 7EO. IsoFA + 7EO appeared to show a certain amount of persistence; most laboratories experienced a lag phase of some length dur-ing which the inoculums adapted to the substrate. Toxic controls were not affected, indicating the test item was not poorly degraded because of toxicity. The lag phase indicates an initial period whereby microorganisms needed to adapt to the presence of isoFA + 7EO. This initial lag phase and lower overall degradation (com-pared with the linear FA + 7EO) was likely a result of the increased resistance to biodegradation under aerobic and anaerobic conditions of hydrocarbons with iso branching [6,7]. Each test assay was subject to inherent variability brought about by the various sludge inoculum sources. Each sludge may have been exposed to differing wastewater conditions resulting in a variety of microbial communities with differing abilities to adapt to each test substance. All tests were considered valid, with the sludge blanks producing gas within the required range of 1.2 to 3 NL/Kg. The lower degradation value for the branched isoFA + 7EO in comparison to that for the lin-ear FA + 7EO can be attributed to the effect of quater-nary carbon atoms in the alkyl chain, an effect which is also seen in aerobic degradation [6] and anaerobic deg-radation studies [6]. The isoFA + 7EO data are consist-ent with those reported by Berna et al. [1].
The anionic surfactant LAS was degraded much less than the other surfactants. It achieved a mean degrad-ation of 31.3% with a standard devidegrad-ation of 43.3% when all the test data were included. The high mean degrad-ation and standard devidegrad-ation values are due to a single anomalous degradation value of 133.4% submitted by laboratory 5. If the anomalous result is discounted, then LAS achieves a mean degradation of 14.3% with a stand-ard deviation of 12.7%. Laboratory 5 found no toxic effects associated with LAS as demonstrated by the tox-icity control. However, it was noted that the results appeared ‘strange’, although no problems were found. Possible explanations might be (a) the presence of oxy-gen in the system (see below) or (b) that the observed
‘degradation’was an artifact due to a not properly sealed apparatus and/or that the bottles containing the excess eudiometer solution were not placed at about the same
height as the meniscus of the liquid inside the eudiom-eter (see [5] for a more detailed explanation).
The graph produced (Figure 3) shows that after an ini-tially high biodegradation rate, biodegradation of the test substance decreases dramatically resulting in a down-ward sloping curve (most likely because most of the test substance has been degraded at this stage). The other six laboratories found that LAS did not degrade at all or that only a very low percentage was degraded and that the biological activity of the sludge had been inhibited. Most laboratories found that the phase 1 LAS degrad-ation proceeded normally, however, after around ten days into the second phase an early plateau was reached, leading into a decreasing degradation curve, the same also happened with the toxicity/inhibition control. A possible explanation is that after only being degraded by around 50% during the first phase, the second addition of test substance exceeded a concentration threshold, over which LAS is inhibitory or toxic to the inoculum. These results agree with the majority of the scientific lit-erature on the subject of anaerobic LAS biodegradation, it has been found that over a certain concentration LAS can become inhibitory to biogas production; this thresh-old has been shown to be as low as just 20 ppm [1]. It has only recently been shown that the full anaerobic bio-degradation of LAS is possible. However, it appears very specific to certain microorganisms and has only been demonstrated in marine sediment studies [8]. In addition, the average half-life of LAS in this study was 90 days, making this an unlikely explanation for this result. It is more likely that a small amount of oxygen was present in the experimental system; work with sulfonate such as LAS has shown that once sulfonate biodegradation has been initiated in oxygen-limited systems, the intermediates can continue to degrade anaerobically [1]. In addition, the results of laboratory 5 did not show LAS had any toxic/inhibitory effects, which would be the case if it was aerobically degraded quickly. The AnBUSDiC test appears capable of demonstrating degradability of test items with inhibitory and toxic effects provided a suitable concentra-tion is used; LAS has been previously shown not to de-grade anaerobically to biogas in other tests [1]. It can therefore be concluded that LAS is unlikely to undergo high levels of biodegradation within the anaerobic com-partments of a WWTP.
methods [4,5,9]. Issues during the DIN 38414 part 8 test with unspecific sludge degradation leading to degrad-ation values over 100% were to a large extent solved with the two phase test design of the AnBUSDiC test. However, mean degradation values of over 100% were still encountered in the second test phase with FA+7EO and FAS, albeit to a lesser extent. The 1st phase addition of test substance appears to have released most of the organic carbon ‘trapped’ in the sludge (via the solubilising action of the surfactant test item), the two phase design was implemented to reduce this unspecific degradation during the second phase addition (however, some still occurs) [5]. Using a two-phase addition of test substance (rather than three dosings) was deemed a compromise between the test length and the potential to overestimate test substance degradation. It was there-fore expected that highly degradable test substances would display values close to or over 100%; however, values in some tests did exceed 120%. When developing the AnBUSDiC test it was clear that the two phase test did not totally eliminate the release of organic carbon from the sludge during the second addition; however, values over 120% were not expected anymore.
An explanation for the overestimation of the degrad-ation value is that the total organic carbon (TOC) value used to calculate the theoretical gas production (using Equation one from Bendt and Willing [5]) is too low and does not represent the TOC left in the system in phase 2. There was a discussion within Bendt and Willing [5] with regards to the calculation of the maximum theor-etical gas production value if 100% of the test substance TOC was to be degraded. It was argued that the TOC used in the calculation of the theoretical gas production should be taken as the TOC from the second addition of test substance only. The justification was that when phase 1 reaches the plateau phase the remaining test substance is no longer degradable and that the addition of the remaining phase 1 TOC to the second phase TOC (for use in calculating theoretical gas production) would lead to underestimation of the test substance de-gradability (i.e. a theoretical gas production value which was too large). It is suggested that in the degradation rate graph, the plateau phase does not equate to the end of test substance degradation, but rather that the deg-radation of sludge with and without test substance is the same (as defined by Equation four). Achieving re-sults of up to 130% degradation during the ring tests suggests that the degradability of test substances is be-ing to a certain extent overestimated.
In an attempt to resolve this issue, some of the per-centage biodegradation results were recalculated. A number of phase 2 biodegradation results reached over 100% biodegradation, as discussed this was partly due to an underestimation of the TOC left in the system when
calculating the theoretical gas production (using Equation one from Bendt and Willing [5]). The solution suggested involved calculating the remaining TOC after phase 1 and adding it to the TOC introduced to the system in phase 2. A brief exercise was carried out where possible to test whether using an altered TOC value in the theoretical gas production calculation would offer more realistic biodegradation values. The percentage biodegradation at the end of phase 1 was read from the original results and used to calculate the TOC non-degraded in phase 1. The remaining TOC from phase 1 was then added to the TOC added to phase 2. This value was then used in Equation one to calculate the theoretical gas produc-tion. As informed by Equation two, a higher theoretical gas production results in a lower phase 2 biodegrad-ation percentage for the same net gas production.
As can be seen in Table 2, the altered calculation did reduce the percentage biodegradation for a selection of results. However, the results that this alteration was intended to effect could not be recalculated. In many cases where the phase 2 biodegradation was significantly over 100%, it was found that the phase 1 biodegradation also exceeded 100%. This meant that in theory, no left-over TOC could be added to the phase 2 total, and therefore, the results could not be recalculated. It would
Table 2 Phase 2% biodegradation results with recalculated values (where this was possible)
Test substance Result Lab
1 4 6 7
Glucose 81.9 92.7 74.9 82.1
Phase 2
Phase 2 re-calculated 63.2 NA 37.4 82.1
FAS 97.4 123.0 84.0 129.0
Phase 2
Phase 2 re-calculated NA NA NA NA
Betaine
Phase 2 76.8 77.0 67.3 83.0
Phase 2 re-calculated 56.6 NA 54.8 71.2
isoFA + 7EO
Phase 2 66.3 51.5 23.9 55.0
Phase 2 re-calculated 36.5 NA 12.2 35.5
FA + 7EO
Phase 2 95.3 106.0 123.4 118.0
Phase 2 re-calculated NA NA NA 98.3
LAS
Phase 2 22.7 31.0 6.2 26.0
Phase 2 re-calculated 16.2 26.7 3.1 16.0
appear that the only way to reduce the results to below 100% would be to include a third phase; however, this is impractical [5]. Whilst the alternative calculation worked in some cases, it could not be applied every time there-fore in the interests of consistency should not be used. Other options may include extending phase 1 to allow further degradation of the released sludge material to prevent overestimation of the degradation in phase 2.
Degradation percentage curves for some test sub-stances show that after an initial peak of intense biodeg-radation the biodegbiodeg-radation curve (e.g. for FA + 7EO) then begins to decrease after a short plateau. The initial peak is likely just a large increase in degradation because of a large amount of new substrate. This initial burst of degradation caused by test item addition will leave a lower amount of degradable material within the sludge. The lower degradation rate enforced would ordinarily lead to a leveling off as seen in the gas production curves; however, when put into Equation four with the now relatively higher degradation of the blank (which did not experience the initial degradation spike and con-tinues to increase), a negative value is obtained leading to a downward sloping curve (as shown in Figure 3). The results taken to calculate the mean were therefore taken from the maximum degradation at the beginning of the plateau or downwards curve.
During analysis of the results from the participating la-boratories, it was clear that the laboratories interpreted the end point of the test in different ways. Currently, the method states that the tests are continued until the net gas production has reached the plateau phase or the degradation has reached more than 80% of the theoret-ical amount. However, some laboratories continued each test only to a set time limit, whereas some continued way past a plateau had been reached resulting in a downward-sloping curve. When analyzing the results, it therefore had to be decided which biodegradation value to take to compare between labs. It was decided that the value used in comparison would be the maximum value at the initial stages of the plateau. To prevent this di-lemma for potential future users of the method, it should be clearly stated that the final biodegradation value should be taken as the maximum value of the first three results within 5% of each other at plateau phase (as opposed to any initial lag phase).
Conclusions
The AnBUSDiC test has been shown to produce reli-able and repeatreli-able results between laboratories. The inclusion of a second addition of test substance is a major step forward in the elimination of the variability produced by non-specific gas production. With the ex-ception of one anomalous test result for LAS, for which a possible explanation has been provided, the
method appears to provide robust and interpretable results.
Ring testing of other anaerobic biodegradation methods such as the European Centre for Ecotoxicology and Toxi-cology of Chemicals (ECETOC) test [9] used a validity cri-terion of more than 40% biodegradation to exclude anomalous results produced by poor test conditions (ex-cept where toxic/inhibitory effects were identified). Appli-cation of this criterion to this set of results identifies a number of anomalous results that might be eliminated as a result of substandard test conditions. In addition to the results discussed, applying this criterion would also re-move the result for isoFA + 7EO (of 23.9%) from labora-tory 6. Whilst this result was not identified as anomalous by the laboratory, it is over a factor of 2 lower than the mean result from the other laboratories. In the absence of any other scientific observations, this result could indicate poor test conditions, e.g. a sludge inoculum with a micro-bial community poorly suited to the degradation of this substance; however, this is an uncontrollable variable which contributes to the overall variation associated with this test method. It is also of note that the ECETOC valid-ity criterion was used to exclude anomalous values for readily degradable substances only and therefore cannot be applied here regardless.
A biodegradable criterion of more than 60% degrad-ation is recommended based on the results of sub-stances known to be anaerobically biodegradable to biogas under sludge conditions, e.g. glucose and the alcohol ethoxylates. Additionally, a partially degradable criteria is recommended for substances which degrade in the range more than 20% to less than 60%; this is based on the results of substances known to be partially degradable, e.g. isoFA + 7EO. Substances that achieve less than 20% degradation shall be regarded as non- or poorly degradable under these particular anaerobic con-ditions. This criterion is set based on the results of sub-stances known to be poorly degradable in anaerobic conditions, e.g. LAS.
The anaerobic results for LAS suggest that false posi-tives can still occur when carrying out a single test (as opposed to a ring test); however, no criteria can elimin-ate experimental error completely. LAS has been previ-ously shown not to degrade anaerobically in other tests [1] and LAS has subsequently been used as a negative control substance in the AnBUSDiC test.
The inclusion of non-degraded TOC from phase 1 has been discussed. Despite the addition of a second phase to account for unspecific gas production, the degrad-ation test items still appears to be overestimated in some cases. May it be that the second addition of test sub-stance is not sufficient to eliminate unspecific digester gas formation completely (can be checked by a third addition) or that initial inhibition (i.e. test substance gas evolution curve is temporarily below the control gas curve) leads to a carry-over of easily degradable organic matter, resulting in an overestimation of the degradation rate in the second phase, due to an underestimation of the theoretical gas production reference value. To rectify this issue, the results from some studies were recalculated with the addition of the remaining TOC from phase 1. However, it was found that this addition could not be car-ried out consistently and therefore did not provide a suit-able solution. Whilst a small number of results for FAS and FA + 7EO were greater than 100% in phase 2, this did not happen in every lab. One possible explanation is that the degradable material contained within the raw sludge used to create the inoculum was greater in these cases. A possible solution to this problem would be to extend the duration of phase 1 where degradation levels close to or above 100% are initially reached in phase 1. This would allow the removal of further degradable material, reducing any overestimation of biodegradation occurring in phase 2. Further testing is required to assert whether this is a vi-able solution and to determine how long phase 1 must be extended, e.g. perhaps until the degradation curve falls below 100%.
The advantage of the two-step design is that it is a good compromise between test complexity and minimiz-ing unspecific (excess) gas formation caused by the surface-activity of the test substance. For the most part, this has been achieved with the majority of results con-sistent with the literature.
Methods
Participating laboratories
The test protocol for the AnBUSDiC test, as detailed in [5], was shared with seven laboratories who had experi-ence in undertaking biodegradation studies. These were (in alphabetical order);
Department of Experimental Toxicology and Ecology BASF SE, Ludwigshafen (Germany) Dr. Noack-Laboratorium, Hildesheim, (Germany) Fraunhofer UMSICHT, Oberhausen (Germany) Harlan Laboratories, Derby (UK)
Hydrotox GmbH, Freiburg (Germany)
Organic Waste Systems (OWS) NV, Gent (Belgium) Stadtentwässerungsbetrieb Landeshauptstadt,
Düsseldorf (Germany)
Each laboratory was instructed to follow the modified AnBUSDiC test method. Information about the test sub-stances (e.g. empirical formula), the detailed test proced-ure and the source and preparation of the inoculum are provided elsewhere [5]. Any deviations from the proto-col due to equipment limitations and/or differences were discussed and agreed beforehand.
Basis of the method
A mixture of anaerobic fermentative and methanogenic bacteria is involved in the anaerobic decomposition process such as is usually encountered in the digestion tower of municipal sewage plants. The different microor-ganisms decompose the organic carbon compounds via various intermediate stages to form the ultimate degrad-ation products methane (CH4) and carbon dioxide (CO2). The community of all these microorganisms forms the digested sludge in the anaerobic sludge treat-ment stage in the WWTPs.
In order to determine the anaerobic degradation, an exactly defined amount of the substance is incubated to-gether with sludge inoculum at 35°C ± 1°C. The sludge inoculum consists of digested sludge to which a certain amount of raw sludge (raw sludge is usually a mixture of 40% sludge from the pre-sedimentation and 60% sludge from the final sedimentation in WWTPs) has been added in order to‘vitalize’it, i.e. to obtain a basic sludge gas development. The addition of raw sludge is part of the original DIN 38414, part 8. When the suitability of the method for determining the biodegradability of sur-factants was evaluated, this step was retained, as the basic sludge gas development enables any possible in-hibitory effects caused by the test substance to be ob-served. The sludge gas production is measured using a eudiometer. The net gas production of the test batch is obtained by subtracting the volume of gas produced by the control batch. The gas law is then used to convert the net gas volume into the molar gas amount, taking pressure and temperature into account. The degree of degradation of the test substance is then determined by the rule of three from the measured molar gas amount and the organic carbon provided by the test substance and used in the test.
Preparing the sample
organic carbon content of the test substance is deter-mined as the TOC (g/g) (according to DIN EN 13137 in a double determination) and a known amount of the test substance is used in the test. A test substance concentra-tion of 200 to 800 mg active substance is used for the first addition (i.e. 150 to 500 mg/L TOC). After the net gas evolution in the test sample has come to an end (i.e. the degradation kinetic of the test sample and the con-trol are more or less identical), a second addition of an-other 200 to 800 mg active substance is made directly to the test system with gentle mixing.
Carrying out the test
The determination of the biodegradability of the test substance is made by determining the difference in the amounts of digester gas produced by the test batch and the control batch. The test and control batches are dosed with identical aliquots of the sludge inoculum.
In general, the DIN 38414, part 8 (1985) test is more tolerant to higher test substance concentrations than the ECETOC test, which is caused by the higher inoculum density. As a rule of thumb 150 to 500 mg/L TOC of the test substance is a good starting concentration for most surfactants, but for some surfactants even 1,500 mg/L TOC was not found to be inhibitory.
The test solutions (500 ml sludge inoculum and sludge inoculum with test substance) are placed in the incuba-tion bottles of the eudiometers as described above. These are then sealed with a ground joint stopper and gently homogenized without any air entrainment. The incubation bottles are then fitted with the eudiometer at-tachments and treated in parallel by placing them in a water bath held at 35°C ± 1°C. The eudiometers are filled to the zero mark with the barrier liquid with the stopcock open. All tests and controls are carried out at least as double determinations. Each water bath contains one control batch and two test batches as a double determination.
It is assumed that any unspecific digester gas evolution caused by the surface activity of the test substance takes place within the first 3 weeks. Therefore, after the initial degradation reaction has reached the plateau phase (usu-ally at about day 21), another aliquot of the test sub-stance (with or without the toxicity control) is added. To avoid oxygen entering the system, this is done, e.g. under a nitrogen atmosphere. Verification of the anaerobic sta-tus of the test system at the end of the test could be done using an oxygen indicator, a redox dye, resazurin. However, as in the OECD 311 method [10]; it is not straightforward to confirm the color of the dye easily without filtration of sludge under nitrogen, which re-quires further work.
Further it should be kept in mind that the correct TOC reference value defining 100% degradation of the
added test substance(s) is used for the calculation of the degradation rate of the second phase (see evaluation).
The batches are swirled around once per day. The gas volumes are initially read off and recorded on a daily basis; subsequently the reading intervals can be length-ened to several days as is necessary. For reading the evolved digester gas volume, the meniscus of the liquid collection bottle and the meniscus of the liquid inside the eudiometer should be aligned. All readings are noted in the test protocol. After each reading, the barrier liquid in the eudiometer is readjusted to the zero mark. In addition, the water bath and room temperatures are measured and recorded on a daily basis (this is import-ant for the conversion of the gas volumes to molar amounts).
The daily determined gas amounts are added together for each batch, but separately for phase 1 and phase 2 (both starting at zero) and presented as gas production curves and, after appropriate conversion, also as degrad-ation curves.
The tests are continued until the net gas production has reached the plateau phase or the degradation has reached more than 80% of the theoretical amount.
Ring test conditions
All participating laboratories ran the six test substances (five surfactants + control) through the test procedure as expected for the ring test. The TOC content of each test substance was pre-determined and provided to the par-ticipating laboratories. This information allowed the la-boratories to create suitable concentrations of each test substance in the range of 200 to 800 mg/L or 150 to 500 mg/L organic carbon (OC). Laboratories were able to refine the dosing and individually determine suitable concentrations of test substances, according to their ex-perimental set up. Any changes to the exex-perimental set up due to equipment availability or otherwise, were pre-agreed beforehand. Each laboratory sourced their own wastewater treatment plant inocula from a nearby do-mestic WWTP. This was then prepared in the appropri-ate way according to the test procedure outlined.
Six test substances representing a variety of surfactant types including a positive control (glucose) were tested anonymously by the laboratories. Details of the sub-stances are as follows:
Glucose (CAS 50-99-7) - the positive reference compound, not surface active
isoC9-11 alcohol ethoxylate [7EO] (CAS 78330-20 -8) - non-ionic surfactant (#23 DID list [11]) Linear C12-18 alcohol ethoxylate [7EO] (CAS
68213-23-0) - non-ionic surfactant (#35 DID list) C12 alkyl sulfonate (CAS 151-21-3) - anionic
Cocoamidopropyl Betaine (CAS 61789400) -amphoteric surfactant (#61 DID list)
C10-13 linear alkylbenzene sulfonate [LAS] (CAS 68411-30-3) - anionic surfactant (#1 DID list)
Competing interests
The authors declare that they have no competing interests.
Authors' contributions
CE, AB, GC, JDF, CH, DS, KT and AW elaborated the testing scheme and monitored the ring test. TA and CE drafted the manuscript. All authors read and approved the final manuscript.
Authors' information
CE, AB, GC, JDF, CH, DS, KT and AW are Members of the ERASM Anaerobic Task Force. TA is an Ecotoxicologist (Contractor) working for Shell Health -Environment and Product Health (EPH).
Acknowledgements
The authors thank the ERASM Technical Committee (Brussels) for their financial support of this study and all of the participating laboratories that generated test data using the AnBUSDiC method.
Author details 1
Shell Health, Shell Technology Centre - Thornton, P O Box 1, Chester CH1 3SH, Cheshire, UK.2European Chemical Industry Council, avenue E van Nieuwenhuyse 4, Brussels 1160, Belgium.3Sasol Italy S. p A, Stabilimento di Augusta (SR), C da Marcellino s. n. C P 119, Augusta, SR 96011, Italy.4Cepsa Quimica S A, Fabrica de Ouneta Mayorga Apdo Correos 40, San Roque, Cádiz 11360, Spain.5Sasol Germany GmbH, Building 1033/PB02, Paul-Baumann-Str. 1, Marl 45772, Germany.6Procter & Gamble, Brussels Innovation Center (BIC), Temselaan 100, Strombeek-Bever 1853, Belgium.7BASF SE, GUP/PA–Z470, Ludwigshafen 67056, Germany.8BASF Personal Care and Nutrition GmbH, Henkelstr 67, Dusseldorf 40589, Germany.
Received: 2 April 2013 Accepted: 6 August 2013 Published: 15 August 2013
References
1. Berna JL, Cassani G, Hager C-D, Rehman N, Lopez I, Schowanek D, Steber J, Taeger K, Wind T:Anaerobic biodegradation of surfactants–scientific review.Tenside Surf Det2007,44(6):312–347.
2. OECD Guideline for the Testing of Chemicals:314: Simulation Tests to Assess the Biodegradability of Chemicals Discharged in Wastewater.Paris: Organization for Economic Co-operation Development; 2008. 3. Fraunhofer Institut UMSICHT:Anaerobic biodegradability of detergent
surfactants, anaerobic biodegradability of detergent surfactants. Final Report. Oberhausen, Germany: Fraunhofer Institut UMSICHT; 2003 [http://ec.europa. eu/enterprise/sectors/chemicals/documents/competitiveness/anaerobic_en. htm]
4. DIN 38414, part 8: German Standard Methods for the Examination of Water, Waste Water and Sludge; Sludge and Sediments (Group S):Determination of the Amenability to Anaerobic Digestion(S 8). Berlin: Deutsches Institut Fur Normung E.V. (German National Standard); 1985.
5. Bendt T, Willing A:A new method to determine the anaerobic degradability of surfactants: the AnBUSDiC test.Environ Sci Eur2012, 24:28.
6. Atlas RM:Microbial degradation of petroleum hydrocarbons: an environmental perspective.Microbiological reviews1981,45(1):180–209. 7. Dorn PB, Wong DCL, Ye J, Martin VA:Chemical properties affecting the
environmental performance of synthetic-based drilling fluids for the gulf of Mexico, Report SPE 142008.InSPE Americas E&P Health, Safety, Security and Environmental Conference.Houston, Texas, USA; Richardson, Texas 75080: Society of Petroleum Engineers; 2011.
8. Lara-Martin PA, Gomez-Parra A, Sanz JL, Gonzales-Mazo E:Anaerobic degradation pathway of linear alkylbenzene sulfonates (LAS) in sulfate-reducing marine sediments.Environ Sci Technol2010, 44(5):1670–1676.
9. Pagga U, Beimborn DB:Anaerobic biodegradation test for organic compounds.Chemosphere1993,27(8):1499–1509.
10. OECD Guidelines for the Testing of Chemicals:311: Anaerobic
Biodegradability of Organic Compounds in Digested Sludge: by Measurement of Gas Production.Paris: Organization for Economic Co-operation Development; 2006.
11. EU: Detergents Ingredients List: 2007.[http://ec.europa.eu/environment/ ecolabel/ecolabelled_products/categories/pdf/did_list/didlist_part_a_en.pdf]
doi:10.1186/2190-4715-25-23
Cite this article as:Eadsforthet al.:Ring testing of the AnBUSDiC test; a
new screening method for the anaerobic degradability of surfactants.
Environmental Sciences Europe201325:23.
Submit your manuscript to a
journal and benefi t from:
7 Convenient online submission 7 Rigorous peer review
7 Immediate publication on acceptance 7 Open access: articles freely available online 7 High visibility within the fi eld
7 Retaining the copyright to your article