Influence of CO
2enrichment and nitrogen fertilization on tissue chemistry
and carbon allocation in longleaf pine seedlings
James A. Entry
1, G. Brett Runion
2, Stephen A. Prior
2, Robert J. Mitchell
3and Hugo H. Rogers
21USDA Agricultural Research Service, Northwest Irrigation and Soils Research Laboratory, 3793 North 3600 West,
Kimberly, Idaho 83341∗; 2USDA-Agricultural Research Service, National Soil Dynamics Laboratory, Auburn, Alabama 36831, and3Joseph W. Jones Ecological Research Center, Newton, Georgia 31770, USA
Received 5 March 1997. Accepted 2 December 1997
Key words: biomass, carbon concentrations, carbon fractions, Pinus palustris
Abstract
One-year old, nursery-grown longleaf pine (Pinus palustris Mill.) seedlings were grown in 45-L pots containing a coarse sandy medium and were exposed to two concentrations of atmospheric CO2(365 or 720µmol−1) and two
levels of nitrogen (N) fertility (40 or 400 kg N ha−1yr−1) within open top chambers for 20 months. At harvest, needles, stems, coarse roots, and fine roots were separated and weighed. Subsamples of each tissue were frozen in liquid N, lyophilized at−50◦C, and ground to pass a 0.2 mm sieve. Tissue samples were analyzed for carbon (C), N, nonpolar extractives (fats, waxes, and oils = FWO), nonstructural carbohydrates (total sugars and starch), and structural carbohydrates (cellulose, lignin, and tannins). Increased dry weights of each tissue were observed under elevated CO2and with high N; however, main effects of CO2were significant only on belowground tissues.
The high N fertility tended to result in increased partitioning of biomass aboveground, resulting in significantly lower root to shoot ratios. Elevated CO2did not affect biomass allocation among tissues. Both atmospheric CO2
and N fertility tended to affect concentration of C compounds in belowground, more than aboveground, tissues. Elevated CO2 resulted in lower concentrations of starch, cellulose, and lignin, but increased concentrations of
FWO in root tissues. High N fertility increased the concentration of starch, cellulose, and tannins, but resulted in lower concentrations of lignin and FWO in roots. Differences between CO2concentrations tended to occur only
with high N fertility. Atmospheric CO2did not affect allocation patterns for any compound; however the high N
treatment tended to result in a lower percentage of sugars, cellulose, and lignin belowground.
Abbreviations: FWO – fats, waxes, and oils, Cel – cellulose, SC – structural carbohydrates, Lig – Lignin, Tan –
tannins, NSC – nonstructural carbohydrates, TC – total carbon.
Introduction
Substantial research has demonstrated positive effects of increasing CO2in the atmosphere on plants,
includ-ing increased growth and yield (Rogers and Dahlman, 1993; Wittwer, 1990), increased photosynthesis (Long and Drake, 1992; Radin et al., 1987), and de-creased respiration (Amthor et al., 1992; Bunce, 1990; Wullschleger et al., 1994) for many plant species. It is this increased C uptake and assimilation which
re-∗ FAX No: (334) 423-6555.
E-mail: jentry@kimberly.ars.pn.usbr.gov
sults in increased phytomass production; and, in many cases, the largest proportion of this extra phytomass is found belowground (Prior et al., 1994; Rogers et al., 1994; Wittwer, 1978). Increased C from elevated at-mospheric CO2can also enter the rhizosphere via root
growth, turnover, and exudation (Lekkerkerk et al., 1990; Norby et al., 1987; Pregitzer et al., 1995; Zak et al., 1993). There is increasing recognition that be-lowground responses to the CO2environment
The primary effect of elevated CO2is to increase
the rate of photosynthesis, and enhanced photosyn-thesis is likely to increase the amount of C allocated to sinks, especially to root systems. In yellow-poplar (Liriodendron tulipifera L.) saplings grown in open top field chambers with elevated CO2,
photosynthe-sis was enhanced and remained so throughout three growing seasons (Norby et al., 1992). This did not result in a significant increase in plant mass, but rather a change in allocation from leaf production to fine root production and an apparent increase in C flux through the root system.
An increased supply of photosynthate to roots could alter root chemistry. Elevated CO2 increased
carbohydrate concentrations in loblolly pine (Pinus
taeda L.) seedlings by 68% and compensated for
the decline in carbohydrates caused by water stress (Tschaplinski et al., 1993). The concentration of non-structural carbohydrates in roots of cotton (Gossypium
hirsutum L.) plants was 2 to 4 fold higher in
ele-vated CO2 (Wong, 1990). Carbon to nitrogen ratio
(C:N) of roots of the marsh plant, American bulrush (Scripus americanus Pers.), was 22% higher under CO2-enriched conditions (Curtis et al., 1990).
Nitro-gen concentration in roots also tended to be lower under elevated CO2 in white oak (Quercus alba L.)
and yellow-poplar fine roots from field-grown saplings (Norby et al., 1995) and in fine roots from potted
Quercus spp. and Liriodendron spp. seedlings (Norby
and O’Neill, 1989; Norby et al., 1986). Despite the increasing attention forest species are receiving in CO2 effects research, there remain a paucity of data
describing the effects of atmospheric CO2on the
con-centration of secondary metabolites, such as lignin and tannins, in plant tissues. The objective of this study was to examine the effects of elevated atmospheric CO2, combined with soil N fertilization, on tissue
chemistry of longleaf pine (P. palustris Mill.).
Materials and methods
Plant growth and exposure system
Longleaf pine seedlings, from a wild seed source, were lifted from a Florida nursery in February 1993. Seedlings were stored (2◦C) for less than one week, graded (mean root collar diameter = 13 mm; stan-dard deviation = 2), and planted on February 25, 1993 into 45-L plastic containers containing a coarse sandy medium (pH 5.1) which was low in mineral elements
(P, K, mg, and Ca = 0.9, 5.6, 6.9, and 26.6 mg kg−1, respectively).
Treatments were arranged in a split-plot design with five replications. Carbon dioxide treatments (main plots) were randomly assigned to chambers. Nitrogen treatments (subplots) were randomly as-signed within each chamber. To avoid within chamber location effects, pot locations were re-randomized monthly.
Seedlings were exposed to ambient (≈365µmol CO2 mol−1) or elevated (≈720 µmol CO2 mol−1)
CO2 within an open top chamber system similar to
that described by Rogers et al. (1983). The chambers, CO2supply, and CO2monitoring systems have been
previously described for this study site (Mitchell et al., 1995). Carbon dioxide exposures were initiated on March 30, 1993 and continued until November 28, 1994 (20 months). Average daytime CO2
concentra-tions (±standard deviation) through the duration of the experiment were 372.3 µmol−1 (±19.0) in the ambient chambers and 739.5µmol−1(±39.7) in the elevated CO2chambers.
Nitrogen treatments were similar to those de-scribed by Bazzaz and Miao (1993) with slight mod-ification. Nitrogen treatments consisted of applying either 400 or 40 kg N ha−1yr−1at three-month inter-vals (as sulfur coated urea; 38-0-0) which correspond to high and low N treatments. Fertility of other nutri-ents was maintained in non-limiting levels in all pots by application of sulfur coated potassium (0-0-47 = 80 kg K ha−1 yr−1) and MicroMaxT M Plus1 (0-4-0; P = 280, Ca = 1140, Mg = 560, and S = 100 kg ha−1
yr−1, plus a complete compliment of micronutrients)
mixed into sand at the time containers were filled, with a second application at the end of the first year. Iron chelate (0.007 mg Fe g−1 soil) was applied once in April 1993. Nitrogen treatments were initiated at the time of planting and CO2 treatments were initiated
March 30, 1993.
Longleaf pine xylem pressure potential was mea-sured periodically using a pressure chamber apparatus (Scholander et al., 1965). Gravimetric measurements of each container were made two times each week using a scale (Model LP-C4, 101 kg; Tri-Coastal In-dustries, Mukilteo, Washington, USA.). Gravimetric measurements were correlated with pre-dawn xylem pressure potentials, measured on excised needles at each weighing for one month. Trees received water
1 Trade names and products are mentioned solely for
Table 1. Concentration of N and C fractions in Pinus palustris tissue after 20 months of growth at ambient and elevated CO2with high and low
N soil fertility in open top chambers
Treatment Nitrogen Carbon Fractions
CO2 Nitrogen Biomass mg N g−1 FWOa Sugar Starch Cellulose Lignin Tannin Tissue (µmol mol−1) (kg ha−1yr−1) (g) tissue (mg fraction g−1tissue)
Needles 365 40 22.9 bb 6.1 c 166.7 a 7.0 a 239.0 a 412.2 a 152.0 a 23.0 ab 720 40 19.4 b 5.8 c 161.6 a 6.9 a 248.0 a 408.5 a 148.2 a 26.7 a 365 400 153.6 a 14.5 a 175.7 a 6.6 a 264.4 a 383.6 a 155.6 a 14.1 b 720 400 181.5 a 10.9 b 145.2 a 7.2 a 281.0 a 394.0 a 155.0 a 17.7 ab
Stems 365 40 12.8 c 2.6 c 279.6 a 6.1 a 164.5 a 370.2 a 158.5 a 21.0 a 720 40 17.1 bc 3.5 c 355.4 a 5.4 a 146.2 a 322.4 a 151.8 a 18.9 a 365 400 60.4 ab 13.5 a 233.7 a 6.4 a 234.6 a 327.1 a 166.8 a 31.4 a 720 400 97.7 a 8.7 b 347.3 a 5.5 a 173.8 a 313.6 a 141.4 a 18.5 a
Taproots 365 40 16.8 c 3.1 c 226.5 a 6.2 a 311.8 ab 268.8 a 157.2 ab 29.6 b 720 40 15.8 c 3.8 c 364.9 a 5.2 a 119.2 c 302.3 a 194.7 a 13.6 c 365 400 44.7 b 8.8 a 278.9 a 5.8 a 241.1 b 276.7 a 162.5 ab 34.7 b 720 400 74.1 a 6.0 b 249.4 a 6.0 a 405.1 a 195.4 a 94.1 b 49.9 a
Laterals 365 40 15.9 c 4.0 c 353.2 a 5.0 a 194.6 a 267.5 a 166.0 a 13.6 ab 720 40 16.2 c 4.1 c 356.9 a 5.3 a 179.4 a 270.1 a 176.3 a 12.0 b 365 400 87.8 b 9.4 a 315.4 a 5.5 a 250.2 a 240.3 a 167.2 a 21.4 a 720 400 140.9 a 6.3 b 387.0 a 5.2 a 220.9 a 231.0 a 140.8 a 15.1 ab
Fine 365 40 9.5 b 6.1 b 333.4 b 8.1 a 114.7 b 278.5 ab 251.7 a 13.4 a Roots 720 40 11.0 b 5.4 b 502.8 a 6.4 a 74.0 b 225.9 b 180.4 b 10.4 a 365 400 32.6 a 13.4 a 197.6 b 7.5 a 191.8 a 334.9 a 252.8 a 15.3 a 720 400 46.0 a 7.9 b 339.6 b 7.9 a 134.7 ab 269.2 b 232.7 ab 16.1 a
aFWO = fats, waxes and oils.
bFor each tissue, in each column within each tissue type, values followed by the same letter are not significantly different as determined by the
Least Square Means Test (p≤0.05), n = 5.
sufficient to return them to field capacity weight when gravimetric measurements indicated a xylem pressure potential of−0.5 MPa had been reached. Pre-dawn xylem pressure potential continued to be taken a min-imum of once each month as a check on gravimetric readings. Gravimetric measurements were again cor-related with pre-dawn xylem pressure potentials to establish new field capacity values after November, 1993 (8 months) and July 1994 (16 months) to com-pensate for changes in plant mass; xylem pressure potential was measured on each container for one month following determination of new field capacity weights. Deionized water was used in order to en-sure that fertility treatments remained unaffected by watering.
Plant harvests
One container from each N treatment in each cham-ber was destructively harvested in Novemcham-ber 1994, corresponding to 20 months of CO2exposure. Plants
were separated into tissue component parts (needles, stems, taproots, lateral roots, and fine roots), oven dried at 55 ◦C to a constant weight, and dry weight recorded. A detailed description of treatment effects on biomass production and morphological variables has been previously reported (Prior et al., 1997).
Tissue analysis
and measured using methods described by Hanson and Moller (1975). Cellulose and lignin were determined gravimetrically (Effland, 1977). Hot water extractable tannins were extracted and measured by methods de-scribed by Allen et al. (1974). Proximate C fractions were corrected for ash and presented as ash-free dry weight (Ryan et al., 1990). Tissue N content was deter-mined with a LECO CHN-600 analyzer (LECO Corp., St. Joseph, MI).
Data analysis
Data were totaled for each seedling and averaged for each container prior to analysis. Data were tested for homogeneity of variance and transformations to achieve normality were not necessary. Data analy-sis was conducted using the General Linear Models (GLM) procedure of the Statistical Analysis System (SAS, 1990). Error terms appropriate to the split-plot design were used to test the significance of main ef-fects variables and their interactions. Residuals were equally distributed with constant variances. Signif-icance was determined at p ≤ 0.05 with the Least Square Means test.
Results
Concentration (mg g−1)
Biomass of all tissues (needles, stems, taproots, lateral roots, and fine roots) was usually greater when plants received the high N treatment regardless of CO2
con-centration (Table 1). In general, biomass of all tissues was greater when plants received both elevated CO2
and N. The effects of elevated CO2and N on
concen-tration of C fractions were observed for belowground, but not aboveground, tissues. Elevated CO2 resulted
in lower concentrations of starch, cellulose, and lignin, but increased the concentration of FWO in root tissues. High N fertility increased the concentration of starch, cellulose, and tannins, but resulted in lower concentra-tions of lignin and FWO in roots. Interacconcentra-tions between CO2 and N often occurred with differences between
CO2 concentrations only with high N fertility.
Nitro-gen concentration (mg g−1) was significantly greater in all tissues for plants grown in the high N treatment. Elevated CO2 resulted in lower N concentrations for
all tissues when grown with the high N treatment. In fine roots, FWO were significantly higher when plants received elevated CO2with low N. Starches in
fine roots were higher for plants receiving high N, par-ticularly with ambient CO2. Starches in taproots were
greater for plants in elevated CO2 and high N;
how-ever, in low N, starch concentration in taproots was greater for ambient CO2-grown plants. Lignin
concen-tration was lower while the concenconcen-tration of cellulose was higher in fine roots in plants grown under ambi-ent CO2. Lignin concentration in taproots tended to be
lower when plants received both elevated CO2and
el-evated N. Tannin concentration in taproots was higher for plants in elevated CO2and high N.
Allocation (% in tissue of total tree)
Biomass partitioning was higher in needles, but was lower in taproots and fine roots, when plants received high N (Table 2). Biomass partitioning to needles was greater for plants in ambient CO2in both N treatments.
CO2 concentration had no effect on N partitioning
among tissues. A greater percentage of N was allo-cated to needles, and less to taproots and fine roots for plants receiving the high N treatment.
Partitioning of sugars to needles and lateral roots tended to be increased in plants receiving high N; however, allocation of sugars to taproots was lower for high N-grown plants (Table 2). Treatment effects on allocation of cellulose were seen only in needles, where allocation was greater for plants receiving high N. Allocation of tannins to taproots was lower in the low N treatment for elevated, compared to ambient, CO2-grown plants; also, allocation was higher for
plants grown in high N and elevated CO2, compared
to plants receiving low N and elevated CO2.
Alloca-tion of tannins to lateral roots was greater for plants receiving high N, particularly for ambient CO2-grown
plants.
Ratios among C components in tissues
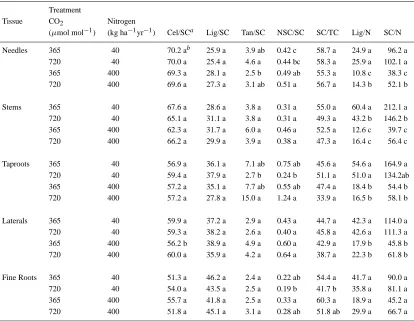
Treatment effects on ratios involving structural C (SC = cellulose + lignin + tannins) were infrequent and, with the exception of the ratio of tannins to total struc-tural C (Tan:SC), were only observed for belowground tissues (Table 3). There were no treatment effects on the distribution of lignin as a percentage of total structural C (Lig:SC). The ratio of tannin to struc-tural C (Tan:SC) was higher in taproots of elevated CO2-grown plants receiving the high N, compared to
Table 2. Allocation of N and C fractions in Pinus palustris tissue after 20 months of growth at ambient and elevated CO2with high and
low N soil fertility in open top chambers
Treatment Nitrogen Carbon Fractions
CO2 Nitrogen Biomass % of FWOa Sugar Starch Cellulose Lignin Tannin Tissue (µmol mol−1) (kg ha−1yr−1) (%) total (%of total in tissue)
Needles 365 40 29.6 bb 41.1 ab 19.3 ab 32.6 bc 33.0 c 37.4 ab 26.8 b 32.6 a 720 40 24.9 c 32.1 b 12.1 b 29.3 c 38.0 b 32.4 b 22.2 b 38.7 a 365 400 40.5 a 47.4 a 30.7 a 42.4 a 43.3 a 48.1 a 37.4 a 27.2 a 720 400 33.7 b 43.6 a 17.6 b 39.0 ab 37.7 b 44.9 a 36.1 a 27.8 a
Stems 365 40 16.4 a 9.6 a 18.1 a 15.7 a 12.3 a 18.5 a 15.2 a 16.5 a 720 40 21.0 a 16.3 a 23.4 a 19.2 a 18.4 a 21.3 a 18.9 a 22.1 a 365 400 16.0 a 17.4 a 16.3 a 16.5 a 15.4 a 16.1 a 15.7 a 24.2 a 720 400 17.8 a 18.6 a 22.2 a 15.6 a 12.9 a 18.4 a 17.2 a 15.8 a
Taproots 365 40 21.7 a 14.7 ab 18.8 a 21.1 a 31.5 a 17.6 a 20.2 a 31.1 a 720 40 19.4 ab 16.7 a 21.8 a 17.1 ab 14.6 b 18.6 a 21.9 a 15.8 b 365 400 11.8 c 8.3 c 14.2 a 10.8 c 11.5b 9.9 a 11.2 b 19.3 ab 720 400 13.6 bc 9.6 bc 12.3 a 13.2 bc 21.7 ab 9.6 a 8.8 b 31.1 a
Laterals 365 40 20.1 a 17.8 a 27.1 a 15.0 b 16.6 a 16.2 a 19.5 a 11.3 b 720 40 20.6 a 18.8 a 21.6 a 18.7 ab 22.8 a 17.8 a 21.6 a 14.7 ab 365 400 23.2 a 17.7 a 31.2 a 20.2 ab 23.2 a 17.2 a 22.9 a 23.1 a 720 400 26.3 a 20.0 a 37.3 a 21.6 a 23.3 a 20.0 a 24.3 a 18.9 ab
Fine Roots 365 40 12.2 ab 16.8 a 16.7 ab 15.6 a 6.5 a 10.4 a 18.2 a 8.5 a 720 40 14.0 a 16.2 a 21.1 a 15.8 a 6.3 a 9.9 a 15.4 a 8.7 a
365 400 8.5 b 9.3 b 7.6 c 10.2 a 6.6 a 8.7 a 12.7 a 6.2 a
720 400 8.6 b 8.2 b 10.7 bc 10.7 a 4.5 a 7.7 a 13.6 a 6.3 a
aFWO = fats, waxes and oils.
bFor each tissue, in each column within each tissue type, values followed by the same letter are not significantly different as determined
by the Least Square Means Test (p≤0.05), n = 5.
In contrast to C, ratios involving tissue N concen-trations were observed for all tissues except fine roots. Lignin to N ratios (Lig:N) and ratios of structural C to N (SC:N) were higher in plants growing under low N. Lig:N and SC:N ratios of belowground tissues were not affected by CO2 treatment; however, Lig:N and
SC:N of needles were higher for elevated CO2-grown
plants in the high N treatment, while Lig:N and SC:N in stems were higher for ambient CO2-grown plants in
low N.
Discussion
Effects of CO2 and N on concentration of C
com-pounds (FWO, sugars, starches, cellulose, lignin, and tannins) tended to occur belowground rather than aboveground, especially in the taproots and fine roots.
A similar response was observed for biomass and this tendency for atmospheric CO2 to enhance
be-lowground more than aboveground growth has been previously noted (Prior et al., 1994; Rogers et al., 1994; Wittwer, 1978). Carbon dioxide by N interac-tions indicated that elevated CO2increased tissue dry
weights only when combined with high N. This inter-action of CO2with soil fertility has been commonly
reported (Griffin et al., 1993; Pérez-Soba et al., 1995; Prior et al., 1997; Walker et al., 1995), although excep-tions have been noted with some tree species (Johnson et al., 1995; Norby et al., 1995).
Although previous research has investigated CO2
effects on plant biomass, few studies have examined changes in plant chemistry under increased levels of atmospheric CO2, and these have been restricted to
Table 3. Allocation of C ratios in Pinus palustris tissue after 20 months of growth at ambient and elevated CO2with high and low
N soil fertility in open top chambers
Treatment
Tissue CO2 Nitrogen
(µmol mol−1) (kg ha−1yr−1) Cel/SCa Lig/SC Tan/SC NSC/SC SC/TC Lig/N SC/N
Needles 365 40 70.2 ab 25.9 a 3.9 ab 0.42 c 58.7 a 24.9 a 96.2 a 720 40 70.0 a 25.4 a 4.6 a 0.44 bc 58.3 a 25.9 a 102.1 a 365 400 69.3 a 28.1 a 2.5 b 0.49 ab 55.3 a 10.8 c 38.3 c 720 400 69.6 a 27.3 a 3.1 ab 0.51 a 56.7 a 14.3 b 52.1 b
Stems 365 40 67.6 a 28.6 a 3.8 a 0.31 a 55.0 a 60.4 a 212.1 a
720 40 65.1 a 31.1 a 3.8 a 0.31 a 49.3 a 43.2 b 146.2 b
365 400 62.3 a 31.7 a 6.0 a 0.46 a 52.5 a 12.6 c 39.7 c 720 400 66.2 a 29.9 a 3.9 a 0.38 a 47.3 a 16.4 c 56.4 c
Taproots 365 40 56.9 a 36.1 a 7.1 ab 0.75 ab 45.6 a 54.6 a 164.9 a
720 40 59.4 a 37.9 a 2.7 b 0.24 b 51.1 a 51.0 a 134.2ab
365 400 57.2 a 35.1 a 7.7 ab 0.55 ab 47.4 a 18.4 b 54.4 b 720 400 57.2 a 27.8 a 15.0 a 1.24 a 33.9 a 16.5 b 58.1 b
Laterals 365 40 59.9 a 37.2 a 2.9 a 0.43 a 44.7 a 42.3 a 114.0 a 720 40 59.3 a 38.2 a 2.6 a 0.40 a 45.8 a 42.6 a 111.3 a
365 400 56.2 b 38.9 a 4.9 a 0.60 a 42.9 a 17.9 b 45.8 b
720 400 60.0 a 35.9 a 4.2 a 0.64 a 38.7 a 22.3 b 61.8 b
Fine Roots 365 40 51.3 a 46.2 a 2.4 a 0.22 ab 54.4 a 41.7 a 90.0 a
720 40 54.0 a 43.5 a 2.5 a 0.19 b 41.7 b 35.8 a 81.1 a
365 400 55.7 a 41.8 a 2.5 a 0.33 a 60.3 a 18.9 a 45.2 a 720 400 51.8 a 45.1 a 3.1 a 0.28 ab 51.8 ab 29.9 a 66.7 a
aCel = cellulose, Lig = lignin, Tan = tannin, SC = structural carbohydrates (cellulose, lignin and tannin), TC = total carbon, NSC =
nonstructural carbohydrates (sugars and starches).
bFor each tissue, in each column within each tissue type, values followed by the same letter are not significantly different as
determined by the Least Square Means Test (p≤0.05), n = 5.
concentration and allocation of C compounds in lon-gleaf pine seedlings were observed to predominantly occur in belowground tissues, with N effects tending to be stronger than CO2effects.
In general, plant tissues receive photosynthate ac-cording to demand and plants will allocate a majority of this photosynthate to those tissues encountering the most limiting resource, i.e., greatest demand; this, of course, is dependent upon availability of photosyn-thate for allocation (Chapin et al., 1987; Eissenstat, 1992; Rogers et al., 1996). Both environmental vari-ables tested in this study are undoubtedly important and plants will likely respond, if able, to attain the most limiting resource at any given time in order to maintain a balance of internal C and N pools (Rogers et al., 1996). These interactions indicate that only when sufficient N is available can the plants take
ad-vantage of the higher concentrations of atmospheric CO2.
Ratios among C components were calculated to de-termine treatment effects on structural C allocation to plant tissues by removing the dynamic portion of the internal C pools (i.e., nonstructural carbohydrates). It has been previously shown that concentrations of non-structural carbohydrates can be increased by elevated CO2(Yelle et al., 1989). Effects of CO2and N on
par-titioning of structural C occurred belowground only, as was observed for most data in this study.
Generally, CO2-induced changes in the quality
al., 1993). Thus, the manner in which increases in atmospheric CO2will affect the major insect pests and
diseases of the world’s plants are largely unknown but may result in positive or negative impacts on plant health and productivity. Results of this study lead us to conclude that atmospheric CO2 enrichment
com-bined with elevated soil N may change plant defense compounds, such as lignin and tannins, thereby chang-ing plant susceptibility to many insect and disease infestations (Entry et al., 1992, 1994).
By altering plant tissue quantity and quality, ele-vated atmospheric CO2will likely affect soil microbial
composition and activity, changing C turnover and storage in soils (Goudriaan and de Ruiter, 1983; Lam-borg et al., 1983). Melillo (1983) reported higher C:N ratios and higher levels of phenolics in sweet-gum (Liquidambar styraciflua L.) leaves exposed to high CO2 and hypothesized that this would result in
reduced rates of decomposition and decreased soil fer-tility. Lekkerkerk et al. (1990) found that elevated atmospheric CO2 increased the input of easily
de-composable root-derived material in the soil of wheat (Tritcum aestivum L.) and reduced turnover of more resistant soil organic matter. Coûteaux et al. (1991) demonstrated similar results for an initial decomposi-tion period and related the reducdecomposi-tion in decomposidecomposi-tion rate to lower N concentration and higher C:N ratios of CO2-enriched plants. When decomposition was
al-lowed to continue, changes in the composition of the microbial population resulted in an increased decom-position rate of CO2-enriched material which led to an
overall enhancement of C mineralization of 30%. Effects of increasing CO2 on biomass production
will influence microbial composition and activity and, in turn, may impact mineralization/immobilization processes. Zak et al. (1993) reported significant in-creases in microbial biomass C in the rhizosphere and in bulk soil associated with plants grown un-der elevated CO2. They also observed a significant
increase in N mineralization which they related to pos-sible increased turnover rate of microbial N and/or an increased N release from soil organic matter. We ob-served decreased lignin:N ratios for all tissues except fine roots under high N fertility which may increase the rate of decomposition and nutrient mineralization. This study demonstrated that N fertility exerted a much stronger influence on longleaf pine tissue chem-istry and C allocation among those tissues than did atmospheric CO2. The majority of both N and CO2
effects occurred belowground; however, effects on N concentration and lignin to N ratios were observed
both above- and belowground. Also, the majority of treatment effects involved structural, rather than nonstructural, carbohydrates. Altered tissue C and N concentrations and altered lignin to N ratios suggest changes in tissue susceptibility to insect and disease attack and altered rates of decomposition and nutri-ent mineralization under elevated CO2 and high N
fertility.
Acknowledgements
This material is based upon work supported through the Southeastern Regional Center of the National In-stitute for Global Environmental Change by the US Department of Energy under Cooperative Agreement No. DE-FC03-90ER61010 and through the Experi-mental Program to Stimulate Competitive Research by the US Environmental Protection Agency under Contract No. R821826-01-1. Any opinions, findings, and conclusions or recommendations expressed in this publication are those of the authors and do not nec-essarily reflect the views of the US Department of Energy or the US Environmental Protection Agency.
References
Agrios G N 1988 Plant Pathology. Third Edition. Academic Press, New York. 803 p.
Allen S E, Grimshaw H M, Parkinson J and Quermby C 1974 Chemical Analysis of Ecological Materials. Blackwell Scientific, Oxford. 386 p.
Amthor J S, Koch G W and Bloom A J 1992 CO2 inhibits
respiration in leaves of Rumex crispus L. Plant Physiol. 98, 757–760.
Bunce J A 1990 Short- and long-term inhibition of respiratory car-bon dioxide efflux by elevated carcar-bon dioxide. Ann. Bot. 65, 637–642.
Bazzaz F A and Miao S L 1993 Successional status, seed size, and responses of tree seedlings to CO2, light, and nutrients. Ecology
74, 104–112.
Chapin F S III, Bloom A J, Field C B and Waring R H 1987 Plant responses to multiple environmental factors. Biosci. 37, 49–55. Coûteaux M-M, Mousseau M, Célérier M-L and Bottner P 1991
Increased atmospheric CO2 and litter quality: Decomposition
of sweet chestnut leaf litter with animal food webs of different complexities. Oikos 61, 54–64.
Curtis P S, Balduman L M, Drake B G and Whigham D F 1990 Ele-vated atmospheric CO2effects on belowground processes in C3
and C4estuarine marsh communities. Ecology 71, 2001–2006.
Effland M J 1977 Modified procedure to determine acid-insoluble lignin in wood and pulp. TAPPI 60, 143–144.
Eissenstat D M 1992 Costs and benefits of constructing roots of small diameter. J. Plant Nutri. 15, 763–782.
Entry, J A, N C Vance and D L Copes. 1994 Resistance of graft com-patible and incomcom-patible Pseudotsuga menziesii rooted cuttings to Phellinus weirii. Can. J. For. Res. 24: 878–881.
Fajer E D, Bowers M D and Bazzaz F A 1992 The effect of nutri-ents and enriched CO2environments on production of
carbon-based allelochemicals in Plantago: A test of the carbon/nutrient balance hypothesis. Amer. Natural. 140, 707–723.
Goudriaan J and de Ruiter H E 1983 Plant growth in response to CO2enrichment at two levels of nitrogen and phosphorus supply.
1. Dry matter, leaf area, and development. Neth. J. Agric. Sci. 31, 157–169.
Griffin K L, Thomas R B and Strain B R 1993 Effects of nitrogen supply and elevated carbon dioxide on construction cost in leaves of Pinus taeda (L.) seedlings. Oecologia 95, 575–580. Hanson J and Moller I 1975 Percolation of starch and soluble
car-bohydrates from plant tissue for quantitative determination with anthrone. Anal. Biochem. 68, 87–94.
Johnson D W, Ball T, Walker R F 1995 Effects of elevated CO2and
nitrogen on nutrient uptake in ponderosa pine seedlings. Plant Soil 168-169, 535–545.
Lamborg M R, Hardy R W F and Paul E A 1983 Microbial effects. In CO2 and Plants: The Response of Plants to Rising Levels
of Atmospheric CO2, AAAS Selected Symposium 84. Ed. E R
Lemon. pp 131–176. Westview Press, Boulder, CO.
Lekkerkerk L J A, van de Geijn S C and van Veen J A 1990 Effects of elevated atmospheric CO2-levels on the carbon economy of a
soil planted with wheat. In Soils and the Greenhouse Effect. Ed. A F Bouwman. pp 423–429. John Wiley & Sons, New York. Lincoln D E and Couvet D 1989 The effect of carbon supply
on allocation to allelochemicals and caterpillar consumption of peppermint. Oecologia 78, 112–114.
Lindroth R L 1996 CO2-mediated changes in tree chemistry and
tree-Lepidoptera interactions. In Carbon Dioxide and Terrestrial Ecosystems. Eds. G W Koch and H A Mooney. pp 105–120. Academic Press, New York.
Lindroth R L, Kinney K K and Plaz C L 1993 Responses of deciduous trees to elevated atmospheric CO2: Productivity,
phytochemistry and insect performance. Ecology 74, 763–777. Long S P and Drake B G 1992 Photosynthetic CO2 assimilation
and rising atmospheric CO2concentrations. In Crop
Photosyn-thesis: Spatial and Temporal Determinants. Eds. N R Baker and H Thomas. pp 69–107. Elsevier, New York.
Melillo J M 1983 Will increases in atmospheric CO2concentrations
affect decay processes? In Ecosystems Center Annual Report. pp 10–11. Marine Biology Laboratory, Woods Hole, MA. Mitchell R J, Runion G B, Prior S A, Rogers H H, Amthor J
S and Henning F P 1995 Effects of nitrogen on Pinus palus-tris foliar respiratory responses to elevated atmospheric CO2
concentration. J. Exp. Bot. 46, 1561–1567.
Norby R J, Gunderson C A, Wullschlger S D, O’Neill E G and McCraken M K 1992 Productivity and compensatory responses of yellow-poplar trees in elevated CO2. Nature 354, 322–324.
Norby R J and O’Neill E G 1989 Growth dynamics and water use of seedlings of Quercus alba L. in CO2-enriched atmospheres.
New Phytol. 111, 491–500.
Norby R J, O’Neill E G, Hood W G and Luxmoore R J 1987 Carbon allocation, root exudation and mycorrhizal colonization of Pinus echinata seedlings grown under CO2enrichment. Tree Physiol.
3, 203–210.
Norby R J, O’Neill E G and Luxmoore R J 1986 Effects of at-mospheric CO2enrichment on the growth and mineral nutrition
of Quercus alba seedings in nutrient poor soil. Plant Physiol. 82, 83–89.
Norby R J, O’Neill E G and Wullschlger S D, 1995 Belowground responses to atmospheric carbon dioxide in forests. In Carbon Forms and Functions in Forest Soils. Eds. W W McFee and J M Kelly. pp 397–418. SSSA, Madison, WI.
O’Neill E G and Norby R J 1996 Litter quality and decomposition rates of foliar litter produced under CO2enrichment. In Carbon
Dioxide and Terrestrial Ecosystems. Eds. G W Koch and H A Mooney. pp 87–103. Academic Press, New York.
Pérez-Soba M, Dueck T A, Puppi G and Kuiper J C 1995 Interac-tions of elevated CO2, NH3and O3on mycorrhizal infection,
gas exchange and N metabolism in saplings of Scots pine. Plant Soil 176, 107–116.
Pregitzer K S, Zak D R, Curtis P S, Kubiske M E, Teeri J A and Vogel C S 1995 Atmospheric CO2, soil nitrogen, and turnover of
fine roots. New Phytol. 129, 579–585.
Prior S A, Rogers H H, Runion G B and Mauney J R 1994 Effects of free-air CO2enrichment on cotton root growth. Agric, For.
Meteorol. 70, 69–86.
Prior S A, Runion G B, Mitchell R J, Rogers H H and Amthor J S. 1997 Effects of atmospheric CO2on longleaf pine: Productivity
and allocation as influenced by nitrogen and water. Tree Physiol. (In press).
Radin J W, Kimball B A, Hendrix D L and Mauney J R 1987 Pho-tosynthesis of cotton plants exposed to elevated levels of carbon dioxide in the field. Photosyn. Res. 12, 191–203.
Rogers H H and Dahlman R C 1993 Crop responses to CO2
enrichment. Vegetatio 104/105, 117–131.
Rogers H H, Heck W W and Heagle A S 1983 A field tech-nique for the study of plant responses to elevated carbon dioxide concentrations. Air Pollut. Control Assoc. J. 33, 42–44. Rogers H H, Runion G B and Krupa S V 1994 Plant responses
to atmospheric CO2enrichment with emphasis on roots and the
rhizosphere. Environ. Pollut. 83, 155–189.
Rogers H H, Prior S A, Runion G B and Mitchell R J 1996 Root to shoot ratio of crops as influenced by CO2. Plant Soil (In Press).
Ryan, M G, Melillo J M and Ricca A 1990 A comparison of methods for determining proximate carbon fractions of forest litter. Can. J. For. Res. 20, 166–171.
SAS Institute INC 1990 SAS User’s Guide: Statistics – Version 6.03 Edition. Statistical Analysis System (SAS) Institute Inc., Cary, NC. 584 pp.
Scholander P F, Hammel H T, Bradstreet E D and Hemmingsen E A 1965 Sap pressure in vascular plants. Science 148, 339–346. TAPPI 1975 Water solubles in wood and pulp. T 207 os-69.
Tech-nical association of the pulp and paper industry, Atlanta, GA. USA.
Tschaplinski T J, Norby R J and Wullschleger S D 1993 Responses of loblolly pine seedlings to elevated CO2and fluctuating water
supply. Tree Physiol. 13, 283–296.
Walker R F, Geisinger D R, Johnson D R and Ball J T 1995 In-teractive effects of atmospheric CO2and soil N on growth and
ectomycorrhizal colonization of ponderosa pine seedlings. Forest Sci. 41, 491–500.
Wittwer, S.H. 1978. Carbon dioxide fertilization of crop plants. p. 310–33. In Problems in Crop Physiology. Ed. U S Gupta. Haryana Agric. Univ., Hissar, India.
Wittwer, S.H. 1990. Implications of the greenhouse effect on crop productivity. HortScience 25: 1560–1567.
Wong S C 1990 Elevated atmospheric partial pressure of CO2and
Wullschleger S D, Ziska L H and Bunce J A 1994 Respiratory responses of higher plants to atmospheric CO2 enrichment.
Physiol. Plant. 90, 221–229.
Yelle S, Beeson R C Jr, Trudel M J and Gosselin A 1989 Acclima-tion of two tomato species to high atmospheric CO2. I. Starch
and sugar concentrations. Plant Physiol. 90, 1465–1472.
Zak D R, Pregitzer K S, Curtis P S, Teeri J A, Fogel R and Ran-dlett D L 1993 Elevated atmospheric CO2and feedback between
carbon and nitrogen cycles. Plant Soil 151, 105–117.