O R I G I N A L R E S E A R C H
Open Access
Impact of time-of-flight PET on
quantification accuracy and lesion
detection in simultaneous
18
F-choline PET/
MRI for prostate cancer
Urs J. Muehlematter
1,2*, Hannes W. Nagel
1,2, Anton Becker
1, Julian Mueller
2, Kerstin N. Vokinger
3,
Felipe de Galiza Barbosa
4, Edwin E. G. T. ter Voert
2,5, Patrick Veit-Haibach
6,7and Irene A. Burger
1,2Abstract
Background:Accurate attenuation correction (AC) is an inherent problem of positron emission tomography magnetic resonance imaging (PET/MRI) systems. Simulation studies showed that time-of-flight (TOF) detectors can reduce PET quantification errors in MRI-based AC. However, its impact on lesion detection in a clinical setting with18F-choline has not yet been evaluated. Therefore, we compared TOF and non-TOF18F-choline PET for absolute and relative difference in standard uptake values (SUV) and investigated the detection rate of metastases in prostate cancer patients.
Results:Non-TOF SUV was significantly lower compared to TOF in all osseous structures, except the skull, in primary lesions of the prostate, and in pelvic nodal and osseous metastasis. Concerning lymph node metastases, both experienced readers detected 16/19 (84%) on TOF PET, whereas on non-TOF PET readers 1 and 2 detected 11 (58%), and 14 (73%), respectively. With TOF PET readers 1 and 2 detected 14/15 (93%) and 11/15 (73%) bone metastases, respectively, whereas detection rate with non-TOF PET was 73% (11/15) for reader 1 and 53% (8/15) for reader 2. The interreader agreement was good for osseous metastasis detection on TOF (kappa 0.636, 95% confidence interval [CI] 0. 453–0.810) and moderate on non-TOF (kappa = 0.600, CI 0.438–0.780).
Conclusion:TOF reconstruction for18F-choline PET/MRI shows higher SUV measurements compared to non-TOF reconstructions in physiological osseous structures as well as pelvic malignancies. Our results suggest that addition of TOF information has a positive impact on lesion detection rate for lymph node and bone metastasis in prostate cancer patients.
Keywords:PET/MRI, Attenuation correction, Time-of-flight, Prostate cancer
Background
Direct combination of magnetic resonance imaging (MRI) with positron emission tomography (PET) is a recent advance in hybrid imaging, and the demand for such im-aging is continuously growing. Early clinical experience showed comparable results of PET/MRI in the detection of malignant lesion compared to PET/computed tomog-raphy (CT) [1]. However, a major advantage of hybrid PET/MRI is the combination of high soft tissue contrast
and multi-parameter images from MR with functional and molecular information from PET, which could be espe-cially beneficial in the pelvis, as was suggested by several authors [2–4].
In high-risk patients or patients with the suspicion of extra pelvic diseases, use of PET/CT with either18F-choline or more recently also 68Ga-PSMA is widely used and showed improved accuracy compared to morphologic imaging alone [5]. Studies comparing18F-choline PET/CT and PET/MRI yielded highly comparable results concerning lesion detection and choline uptake in patients with prostate cancer [6–9] with the benefit of improved anatomical localization [7]. Furthermore, the advantages of improved tracer localization in Choline PET/MRI * Correspondence:[email protected]
1
Department of Diagnostic and Interventional Radiology, University Hospital Zurich, Zurich, Switzerland
2Department of Nuclear Medicine, University Hospital Zurich, Zurich,
Switzerland
Full list of author information is available at the end of the article
could even improve accuracy of local staging over multiparametric MRI alone [10–12]. Therefore, PET/MRI is a highly promising field for prostate cancer.
Attenuation correction (AC) of PET remains an inher-ent problem of quantitative PET/MRI imaging since it is based on either an atlas-based (brain) or a direct MR image segmentation-based AC neglecting metal or bone density. Newer template-based AC algorithms including pattern recognition/machine learning and transmission/ emission-based methods have recently been incorpo-rated into magnetic resonance-based attenuation correc-tion (MRAC) but are not clinically available [13, 14]. It has been demonstrated that segmentation-based MRAC, which is the standard method on most commercial PET/ MRI scanners, treating bone as soft tissue, leads to sub-stantial underestimation of SUV in bone lesions [15–20]. A recent simulation study showed that TOF PET can re-duce MRAC-inre-duced quantification errors in bone tissue [21]. However, it remains unclear if this reduced MRAC-induced bias on SUV measurements has clinical consequences for 18
F-choline PET/MRI in prostate cancer patients.
An important improvement in PET was the devel-opment of the time-of-flight (TOF) function which was initially introduced in the clinical setting in the 1980s [22]. Since then, PET technique has substan-tially improved resulting in fully-3D TOF PET scan-ners available today [23]. With the development of new PET detector systems, there are now fully
integrated PET/MRI systems available featuring TOF. Previous studies have shown that TOF information improves image quality of PET/CT [24–28] and PET/ MRI [29–31]. For example, the implementation of TOF in PET/MRI notably reduces image acquisition time [32], metal artifacts [31, 33–35], as well as arti-facts caused by respiratory mismatch between emis-sion and data [21, 36]. Using the same TOF PET images from PET/CT with MRI or CT in a trimodal-ity setting showed that the PET/CT and PET/MRI performed comparable in whole-body oncology [37], but for PET/MRI, the addition of TOF improved le-sion quantification [38]. However, studies comparing TOF and non-TOF PET/MRI addressing specific tumor entities are still rare.
Thus, the purpose of our study was to examine the impact of TOF versus non-TOF reconstruction for 18
F-choline PET/MRI regarding absolute and relative SUVmax differences and metastasis detection in the setting of prostate cancer patients.
Table 1MRI protocol parameters
Axial LAVA-FLEXa Coronal T2w FRFSE-XLb Axial T2w FRFSE-XL (Pelvic)
Coronal T2w FRFSE-XL (Pelvic)
Axial DWIc EPId(Focus) (Pelvic)
Repetition time, TR (ms) 5618 6326 2600 2900 4000
Echo time, TE (ms) 2.66 118 118 121 67.2
Flip angle, FA (degrees) 12 111 125 125 90
Acquisition matrix 344 × 256 288 × 224 416 × 224 416 × 224 160 × 80
Image size (voxels) 512 × 512 512 × 512 512 × 512 512 × 512 256 × 256
Reconstruction diameter (mm) 460 480 180 200 240
Slice thickness (mm) 3 (3D) 5 4 4 4
Signal averages 0.68 1 4 4 –
b-values (s/mm2) and signal averages – – – – 0 (6 av.)
400 (8 av.)
700 (16 av.)
Diffusion direction – – – – ‘All’
Bandwidth (Hz/pixel) 651 355 326 326 1953
Acquisition time (mm:ss) 0:18 0:52 3:39 4:04 5:16
a
3D, fast spoiled gradient echo imaging technique that generates water only, fat only, in phase, and out of phase echoes in one single acquisition (GE Healthcare, Waukesha, WI, USA)
b
Fast relaxation fast spin echo c
Diffusion-weighted imaging d
Echo-planar imaging
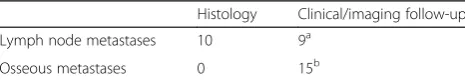
Table 2Reference standard of lesions
Histology Clinical/imaging follow-up
Lymph node metastases 10 9a
Osseous metastases 0 15b
aMedian follow-up duration 276 days (range 188–364) b
Methods
Subjects
Twenty men referred to our department for an 18 F-choline PET/CT were prospectively enrolled in this study from December 2014 to January 2016.There was no further selection applied regarding patient inclusion. Exclusion criteria were (a) refusal to study participation or (b) claustrophobia or other contraindications for MRI (e.g., cardiac pacemakers). Informed consent was obtained from each patient prior to the study inclusion and to the PET/MRI. The local ethics committee approved the study under reference number KEK ZH-Nr 2013-0220.
PET/MRI protocol
All patients underwent a single injection of 18F-choline (mean dose ± standard deviation, 201 ± 4.7 MBq, range 195–214 MBq). Whole-body PET/MRI was performed after 59.3 min ± 4.9 min (mean ± SD) after injection. These PET/MRI study scans were acquired with a simul-taneous TOF PET/MRI system (SIGNA PET/MR, GE Healthcare, Waukesha, WI, USA) used in previous stud-ies at our department [33]: The scanner comprises a 3T wide-bore MR system with a TOF-PET detector ring in-stalled between the body and gradient coils. The trans-axial and trans-axial fields of view are 600 and 250 mm, respectively. The resolving time of the TOF detector is less than 400 ps [39].
The default acquisition protocol consisted of six bed positions (2 min per bed position), from the vertex of the skull to the mid-thighs. During PET scanning, MRI acquisitions for attenuation correction were performed, using in-phase and out-of-phase images to calculate water-only and fat-only images according to Dixon’s method [40, 41]. Additionally, the basic whole-body
protocol and dedicated sequences to the pelvic region were applied. The MRI protocols and parameters are listed in Table1.
MR imaging-based attenuation correction
An atlas-based attenuation correction was used for the head [42]. For the remaining body regions, air, lung, and soft tissue were segmented and a continuous fat-water based MRAC method was applied [43,44].
TOF and non-TOF PET reconstructions and image analysis
3D-PET emission data was reconstructed with TOF and non-TOF for each patient with a fully three-dimensional iterative algorithm, which is part of the manufacturer-supplied standard scanner software (ordered subset expectation maximization (OSEM)-based VUE Point FX Table 3Summary of patient characteristics
N % ofN
Patients 20
Age at scan in years (median, range) 72.5 (60–89)
Body height in m (median, range) 1.74 (1.60–1.87)
Body weight in kg (median, range) 80 (57–114)
BMIain kg/m2(median, range) 27.5 (19.0–34.2)
Reason for referral
Restaging 11 55
Initial staging 9 45
Tumor location
No tumor detected 2 10
Prostate 14 70
Lymph node metastases 9 45
Osseous metastases 7 35
a
Body mass index
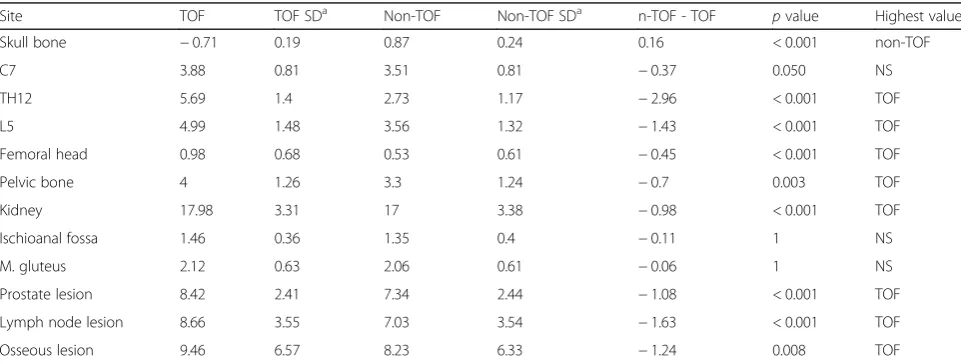
Table 4Average SUVmaxand SUVmaxdifference (difference significant ifp< 0.05)
Site TOF TOF SDa Non-TOF Non-TOF SDa n-TOF - TOF pvalue Highest value
Skull bone −0.71 0.19 0.87 0.24 0.16 < 0.001 non-TOF
C7 3.88 0.81 3.51 0.81 −0.37 0.050 NS
TH12 5.69 1.4 2.73 1.17 −2.96 < 0.001 TOF
L5 4.99 1.48 3.56 1.32 −1.43 < 0.001 TOF
Femoral head 0.98 0.68 0.53 0.61 −0.45 < 0.001 TOF
Pelvic bone 4 1.26 3.3 1.24 −0.7 0.003 TOF
Kidney 17.98 3.31 17 3.38 −0.98 < 0.001 TOF
Ischioanal fossa 1.46 0.36 1.35 0.4 −0.11 1 NS
M. gluteus 2.12 0.63 2.06 0.61 −0.06 1 NS
Prostate lesion 8.42 2.41 7.34 2.44 −1.08 < 0.001 TOF
Lymph node lesion 8.66 3.55 7.03 3.54 −1.63 < 0.001 TOF
Osseous lesion 9.46 6.57 8.23 6.33 −1.24 0.008 TOF
Units: g/ml a
for TOF PET and VUE Point HD for non-TOF PET, GE Healthcare, Waukesha, WI, USA). Both algorithms include standard scatter, dead-time, random attenuation, and normalization correction as well as correction for the detector response using Sharper (GE Healthcare, Waukesha, WI, USA). Their only difference lies in the TOF information, which is ignored by the VUE Point HD algorithm. The PET images for both TOF and non-TOF were reconstructed using 2 iterations, 28 subsets, a 600-mm field of view, and a 256 × 256 image grid with 2.34 × 2.34 × 2.78 mm3voxels. For image space filtering, an in-plane Gaussian convolution kernel with a full width at half maximum of 4.0 mm was used, followed by a standard axial filter with a 3-slice kernel.
Reconstructed images were reviewed on a dedicated workstation (Advantage Workstation, Version 4.6, GE Healthcare, Milwaukee, WI, USA) for region of interest (ROI) analysis. Maximum standardized uptake values (SUVmax) was normalized to patient body weight. SUV-maxwas calculated for nine physiological structures using rectangle ROIs of 20 × 20 mm: skull, C7, Th12, L5, fem-oral head, pelvis, kidneys, ischioanal fossa, and M.
Table 5Average relative SUVmaxdifferences
Site (n-TOF -TOF)/TOF RSD
Skull bone 23% 0.16
C7 −9% 0.12
TH12 −52% 0.15
L5 −28% 0.17
Femoral head −48% 0.23
Pelvic bone −18% 0.17
Kidney −6% 0.04
Ischioanal fossa −6% 0.2
M. gluteus −1% 0.21
Prostate lesion −13% 0.11
Lymph node lesion −22% 0.13
Osseous lesion −17% 0.10
RSDrelative standard deviation
gluteus. Average values were calculated for symmetrical structures. Lesions in the prostate, lymph node, and bone were assessed with size-adapted ROIs with know-ledge of the reference standard. Additionally, size of lymph node metastases (maximal short axis) as well as minimum distance to osseous tissue (lymph node surface to cortical bone) was measured on T2-weighted MR images.
Four readers (readers 1 and 2, board-certified radi-ologist with 2 and 1 years of fellowship training in Nuclear Medicine; reader 3, 2 years of residency training in Nuclear Medicine; reader 4, 3 years of residency training in Radiology and 1 year of fellow-ship training in Nuclear Medicine) reviewed all recon-structed images on a dedicated review workstation. Readers investigated non-TOF PET and 1–3 months later TOF PET and were blinded to any other infor-mation than the patient bodyweight and injected dose (necessarily needed for the SUV calculations). Readers 1–4 evaluated the data for image quality, prostate le-sions detection (or prostate bed if post-prostatectomy) , lymph node metastases detection, and osseous and visceral metastases detection. Image quality was ranked from 4 (excellent) to 0 (non-diagnostic), and it was evaluated based on general quality, image sharp-ness, noise, and presence of artifacts (noise was evalu-ated in a scale from 0 (high noise) to 4 (low noise), artifacts from 0 (no artifacts) to 2 (severe artifacts), respectively). Readers 1 and 2 furthermore evaluated exact lymph node and osseous metastases site. An unblinded read out (board-certified Nuclear Medicine Physician and Radiologist), including all available histopathology and clinical/imaging follow-up data served as a reference standard. Details of the reference standard are shown in Table2.
Statistical analysis
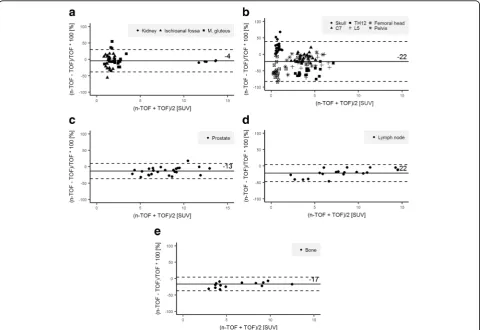
Difference of SUVmax(SUVmax n-TOF−SUVmax TOF) was compared using a two-sample paired t test and to achieve an alpha of 0.05, a conservative multiple com-parisons correction of Bonferroni was applied (n= 12 different ROIs compared in each patient) [45]. Signifi-cant difference was defined at p< 0.05. Relative differ-ence of SUVmaxwas defined as (SUVmax n-TOF−SUVmax
TOF)/SUVmax TOF and was compared using Bland Alt-man plots [46]. Results are presented as mean and rela-tive standard deviation (RSD). Agreement among observers was evaluated using Fleiss’s kappa (κ) [47,48] for all readers. Interpretation of κwas based on a classi-fication provided by Landis and Koch: 0.0, poor; 0.0–0. 20, slight; 0.21–0.40, fair; 0.41–0.60, moderate; 0.61–0. 80, good; 0.81–1.00, almost-perfect reproducibility [49].
The Spearman’s rank correlation was used to investi-gate the effect of lymph node lesion size and the
distance between lymph node lesions and bone on rela-tive SUVmaxdifference. Lesion detection percentage was calculated for lymph node metastasis and distant metas-tasis. The Wilcoxon signed-rank test was used to
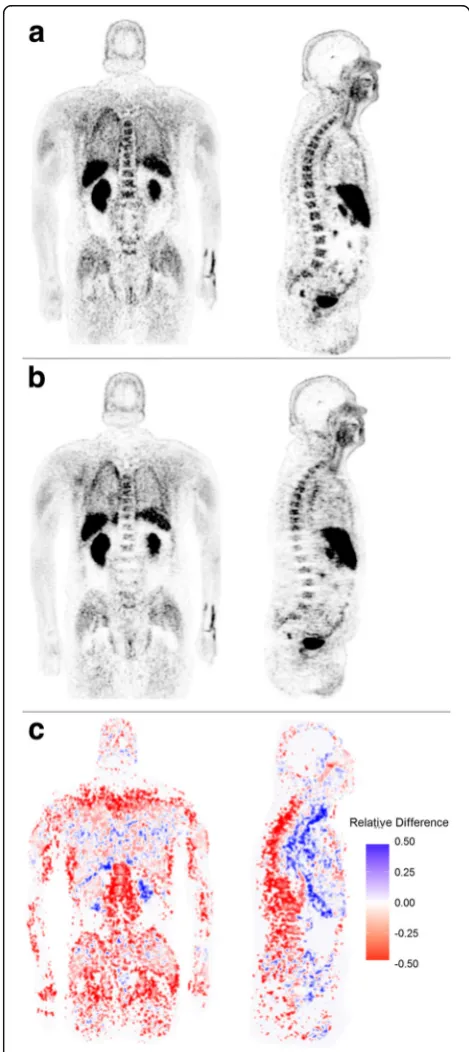
Fig. 2Coronal and sagittal TOF18F-choline PET reconstruction
(a). Coronal and sagittal non-TOF 18F-choline PET reconstruction
compare visual image quality scores between TOF and non-TOF reconstructions. Neither sensitivity nor specifi-city measurements were calculated due to the heterogenous patient population and application of a heterogenous reference standard. All analyses were con-ducted in R 3.2.5 (The R Software Foundation, Vienna, Austria).
Results
A total of 20 patients with a mean age of 72.5 years (range 60–89 years) were consecutively included in our study. Of these, 11 were referred for restaging and 9 for initial staging of prostate cancer. Table 3
summarizes the demographic and clinically relevant details of our study population. A total of 241 ROIs were analyzed. One hundred eighty ROIs were set in physiological tissue, 25 ROIs in prostate lesions, 19 ROIs in lymph node metastases, and 17 ROIs in osse-ous metastases to calculate absolute and relative dif-ferences. Our study population included 19 lymph node metastases in nine patients. Seven patients had
bone metastases, two with disseminated disease. The remaining five patients showed 15 osseous metastases. In two patients, no cause for an elevated PSA could be identified. An overview of absolute and relative differences for physiological tissue and lesions are given in Tables 4 and 5.
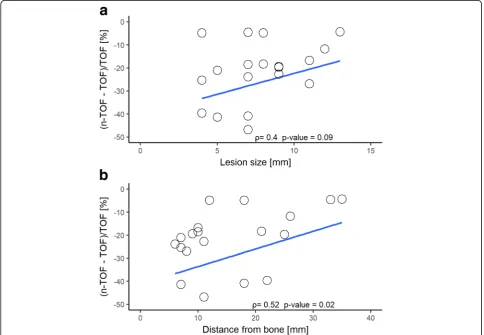
SUVmax was significantly lower in non-TOF recon-structions compared to TOF images in all osseous struc-tures, except in the bone of the skull with a mean relative difference of osseous structures without skull bone of−31% (RSD ±23). However, there was no signifi-cant difference in the pooled physiological soft tissue data between non-TOF and TOF, although the difference was significant for the kidney alone. Typical distribution of relative differences in physiological tissue is shown in Bland-Altman plots in Fig. 1a, b. The highest relative difference of SUVmaxwas found in the Th12 and femoral heads with a mean relative difference of −52% (RSD ± 15) and −48% (RSD ± 23), respectively. Examples for relative difference images of TOF PET and non-TOF PET reconstructions for one patient are given in Fig.2.
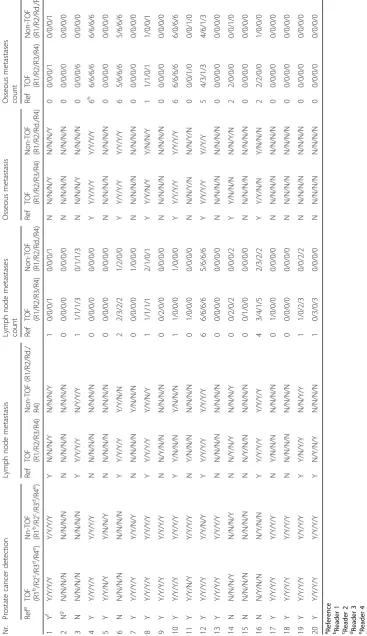
Table 6 Readout results Nr. Pros tate cance r detec tion Lym ph nod e meta stasis Lymph node meta stases count Osseo us metast asis O sseous meta stases cou nt Ref a TOF (R1 b /R2 c /R3 d /R 4 e ) Nn-TO F (R1 b /R 2 c /R3 d /R4 e ) Re f TOF (R1/ R2/R3/R4 ) Non-T OF (R1/ R2/Rd./ R4) Ref TOF (R1/ R2/R3/ R4) Non-T OF (R1/ R2/Rd. /R4) Ref TOF (R1/R2/ R3/R 4) Non-TO F (R1/R2/ Rd./ R4) Re f TOF (R1/R2 /R3/R4) Non-T OF (R1/R2 /Rd./R4) 1Y f Y/Y/Y/ Y Y/Y/ Y/Y Y N/ N/N/Y N/N/ N/Y 1 0/ 0/0/1 0/ 0/0/1 N N/N/N/Y N/N/N/Y 0 0/0/ 0/1 0/0/ 0/1 2N g N/N/N/N N/N/ N/N N N/ N/N/N N/N/ N/N 0 0/ 0/0/0 0/ 0/0/0 N N/N/N/N N/N/N/N 0 0/0/ 0/0 0/0/ 0/0 3 N N/N/N/N N/N/ N/N Y Y/ Y/Y/Y N/Y/ Y/Y 1 1/ 1/1/3 0/ 1/1/3 N N/N/N/Y N/N/N/N 0 0/0/ 0/6 0/0/ 0/0 4 Y Y/Y/Y/ Y Y/Y/ Y/Y N N/ N/N/N N/N/ N/N 0 0/ 0/0/0 0/ 0/0/0 Y Y/Y/Y/ Y Y/Y/Y/ Y 6 h 6/6/ 6/6 6/6/ 6/6 5 Y Y/Y/N/ Y Y/N/ N/Y N N/ N/N/N N/N/ N/N 0 0/ 0/0/0 0/ 0/0/0 N N/N/N/N N/N/N/N 0 0/0/ 0/0 0/0/ 0/0 6 N N/N/N/N N/N/ N/N Y Y/ Y/Y/Y Y/Y/ N/N 2 2/ 3/2/2 1/ 2/0/0 Y Y/Y/Y/ Y Y/Y/Y/ Y 6 5/6/ 6/6 5/6/ 6/6 7 Y Y/Y/Y/ Y Y/Y/ N/Y N N/ N/N/N Y/N/ N/N 0 0/ 0/0/0 1/ 0/0/0 N N/N/N/N N/N/N/N 0 0/0/ 0/0 0/0/ 0/0 8 Y Y/Y/Y/ Y Y/Y/ Y/Y Y Y/ Y/Y/Y Y/Y/ N/Y 1 1/ 1/1/1 2/ 1/0/1 Y Y/Y/N/ Y Y/N/N/ Y 1 1/1/ 0/1 1/0/ 0/1 9 Y Y/Y/Y/ Y Y/Y/ Y/Y N N/ Y/N/N N/N/ N/N 0 0/ 2/0/0 0/ 0/0/0 N N/N/N/N N/N/N/N 0 0/0/ 0/0 0/0/ 0/0 10 Y Y/Y/Y/ Y Y/Y/ Y/Y Y Y/ N/N/N Y/N/ N/N 1 1/ 0/0/0 1/ 0/0/0 Y Y/Y/Y/ Y Y/Y/Y/ Y 6 6/6/ 6/6 6/0/ 6/6 11 Y Y/Y/N/ Y Y/Y/ Y/Y N Y/ N/N/N N/N/ N/N 0 1/ 0/0/0 0/ 0/0/0 N N/N/Y/ N N/N/Y/ N 0 0/0/ 1/0 0/0/ 1/0 12 Y Y/Y/Y/ Y Y/Y/ N/Y Y Y/ Y/Y/Y Y/Y/ Y/Y 6 6/ 6/6/6 5/ 6/6/6 Y Y/Y/Y/ Y Y//Y/Y 5 4/3/ 1/3 4/6/ 1/3 13 Y Y/Y/Y/ Y Y/Y/ Y/Y N N/ N/N/N N/N/ N/N 0 0/ 0/0/0 0/ 0/0/0 N N/N/N/N N/N/N/N 0 0/0/ 0/0 0/0/ 0/0 14 N N/N/N/Y N/N/ N/Y N N/ Y/N/Y N/N/ N/Y 0 0/ 2/0/2 0/ 0/0/2 Y Y/N/N/ N N/N/Y/ N 2 2/0/ 0/0 0/0/ 1/0 15 N N/N/N/N N/N/ N/N N N/ Y/N/N N/N/ N/N 0 0/ 1/0/0 0/ 0/0/0 N N/N/N/N N/N/N/N 0 0/0/ 0/0 0/0/ 0/0 16 N N/Y/N/N N/Y/ N/N Y Y/ Y/Y/Y Y/Y/ Y/Y 4 3/ 4/1/5 2/ 3/2/2 Y Y/Y/N/ N Y/N/N/ N 2 2/2/ 0/0 1/0/ 0/0 17 Y Y/Y/Y/ Y Y/Y/ Y/Y N Y/ N/N/N N/N/ N/N 0 1/ 0/0/0 0/ 0/0/0 N N/N/N/N N/N/N/N 0 0/0/ 0/0 0/0/ 0/0 18 Y Y/Y/Y/ Y Y/Y/ Y/Y N N/ N/N/N N/N/ N/N 0 0/ 0/0/0 0/ 0/0/0 N N/N/N/N N/N/N/N 0 0/0/ 0/0 0/0/ 0/0 19 Y Y/Y/Y/ Y Y/Y/ Y/Y Y Y/ N/Y/Y N/N/ Y/Y 1 1/ 0/2/3 0/ 0/2/2 N N/N/N/N N/N/N/N 0 0/0/ 0/0 0/0/ 0/0 20 Y Y/Y/Y/ Y Y/Y/ Y/Y Y N/ Y/N/Y N/N/ N/N 1 0/ 3/0/3 0/ 0/0/0 N N/N/N/N N/N/N/N 0 0/0/ 0/0 0/0/ 0/0
aReference bReader
1 cReader 2 dReader 3 eReader 4
fYes gNo hMultiple
(>
Lesions
SUVmax was significantly lower on non-TOF images for all lesions, with an overall underestimation of − 17% (−13% for prostate lesions, −22% for lymph node metastases, and −17% for osseous metastases, respectively). Typical distribution of relative differ-ences of lesions is shown in Bland-Altman plots in Fig. 1c, d, and e. Spearman’s rank correlation showed
a negative correlation for both lymph node lesion size and their distance to bone to relative SUVmax differ-ence (ρ= 0.4, p value = 0.09 and ρ= 0.52, p value = 0. 02, respectively) as shown in Fig. 3.
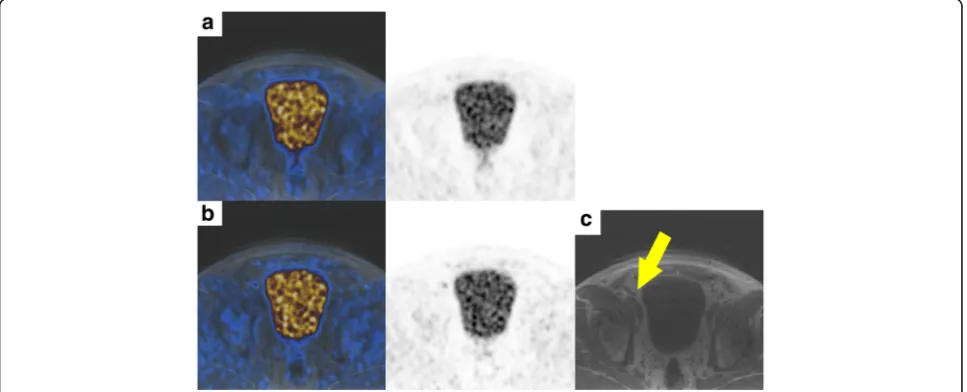
Detailed results of all four readers are given in Table6. Reader 1 detected 84% (16/19) of lymph node ses on TOF PET reconstructions (three missed metasta-ses with histopathology reference) and 58% (11/19) on non-TOF PET reconstruction (five missed metastases with histopathology, three with imaging/clinical follow-up as reference, respectively). Reader 1 detected 93% (14/15) of osseous metastases on TOF PET and 73% (11/ 15) on non-TOF PET reconstructions (all missed metas-tases with imaging/clinical follow-up as reference). Reader 2 detected 84% (16/19) of lymph node metasta-ses on TOF PET reconstructions (two missed metastametasta-ses with histopathology reference, one with imaging/clinical follow-up as reference, respectively) and 73% (14/19) on non-TOF PET reconstruction (three missed metastases with histopathology, two with imaging/clinical follow-up as reference, respectively). Reader 2 detected 73% (11/ 15) of osseous metastases on TOF PET and 53% (8/15) on non-TOF PET reconstructions (all missed metastases with imaging/clinical follow-up as reference). Example of a missed lymph node metastasis is given in Fig. 4.
The interreader agreement between readers 1 and 2 was good for localization of lymph node metastases for TOF and non-TOF (TOF kappa = 0.652, 95% confidence interval [CI] 0.506–0.798 and non-TOF kappa = 0611, CI 0.465–0.757). The interreader agreement between readers 1 and 2 was almost perfect for localization of os-seous metastases for TOF (TOF kappa = 0.81, CI 0.631– 0.989) and good for non-TOF (non-TOF kappa = 0.756. CI 0.577–0.935). Interreader agreement between all reader was good for local cancer detection for both TOF and non-TOF (TOF kappa = 0.762, CI 0.583–0.941 and non-TOF kappa = 0.696, CI 0.517–0.875), respectively. For lymph node metastasis detection, the agreement was moderate for both TOF and non-TOF (TOF kappa 0. 501, CI 0.323–0.680 and non-TOF kappa = 0.457, CI 0. 278–0.636). For osseous metastasis detection, the inter-reader agreement was good for TOF (TOF kappa = 0. 636, CI 0.453–0.810) and moderate for non-TOF (non-TOF kappa = 0.600, CI 0.438–0.780).
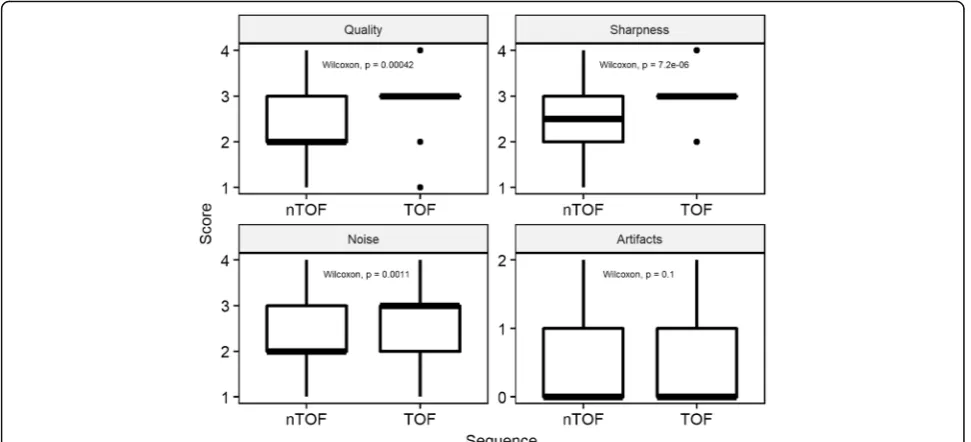
Image quality
General image quality, image sharpness, and image noise were rated statistically significantly superior (pvalue < 0. 001 for general quality and sharpness,pvalue < 0.05 for noise) on TOF-PET reconstructions compared to non-TOF-PET reconstructions, there was no significant dif-ference in the rating of image artifacts (p value = 0.25) (Fig. 5). Mean score (and SD) for TOF and non-TOF sequences were 3.0 (± 0.7) and 2.6 (± 0.7) for general quality, 3.1 (± 0.6) and 2.6 (± 0.7) for image sharpness, 2. 7 (± 0.7), 2.3 (± 0.7) for image noise, and 0.4 (± 0.6) and 0.5 (± 0.6) for artifacts. Details of all readers are given in Additional file1: Table S1.
Fig. 4Images of a patient with a PET-positive lesion along the right external iliac vessel diagnosed as a lymph node metastasis of prostate cancer.
Discussion
In the present study, we investigated the impact of non-TOF versus non-TOF reconstruction in 18F-choline PET/MRI on lesion detection in a clinical setting. We demonstrated that not only SUV measurements are significantly affected, but also the lesion detection rate is lower if PET data is reconstructed without TOF information. Furthermore, we compared SUV measurements of TOF and non-TOF re-constructions in physiological osseous or pelvic tissue and could confirm lower SUVmaxvalues as previously found in simulated data, suggesting that TOF can recover some of the lost PET signal in areas under-corrected by the MRAC that does not consider bone tissue.
Comparing TOF and non-TOF PET OSEM recon-structions is not straightforward as TOF also acceler-ates the convergence rate of the iterative algorithm. Briefly, this means that TOF reconstructions converge faster (requiring fewer iterations) to the“true”(or more accurate) SUV. As each iteration adds more noise to the image, fewer iterations also means lower image noise. Finally, this can be interpreted as an improved SNR or contrast recovery [23, 25]. This “TOF effect” increases with improved TOF timing resolutions [50].
To avoid unacceptably noisy PET images, the OSEM iterative process is usually stopped early. With the injected dose and scan time applied in this study, both the TOF and non-TOF OSEM reconstructions needed to be stopped after two iterations. A consequence of the early termination of the iterative process is that the reconstructed PET images may have non-uniform recov-ery of activity as different image parts may converge at different rates. Using the same number of iterations in
both TOF and non-TOF OSEM means, considering the faster convergence rate of TOF OSEM, that some TOF OSEM reconstructed image parts have more accurate (higher) SUV compared to the non-TOF OSEM recon-structed images. These TOF effects are already known from research on PET/CT. The application of TOF in PET/MR has however additional effects as was briefly mentioned in the introduction and indicated in this study. Most of the previous comparison regarding SUV measurements between TOF and non-TOF reconstruc-tions has been done in PET/CT and showed improved PET quantification using TOF [51–53]. There is only lit-tle evidence that TOF reconstruction in PET/CT does not have a clinically relevant impact on SUV measure-ment [54]. Our data demonstrate that TOF PET/MRI reconstruction results in higher SUVmax measurements in physiological osseous structures as well as in lesions within the prostate, bones, and lymph nodes compared to non-TOF PET reconstructions. This is in concord-ance to preliminary data shown in an abstract by Mollard et al. who also found higher SUVmax in TOF reconstructions compared to non-TOF reconstructions in lesions in prostate patients with 18F-choline [55] and is consistent with the findings of a simulation study of Mehranian et al. [21].
Moreover, our results suggest that lymph node and osseous metastases detection rate is higher on TOF PET reconstructions compared to non-TOF PET reconstruc-tions. Most of the previous patient studies evaluating lesion detection comparing TOF and non-TOF PET were achieved in PET/CT and suggested a better lesion detection for TOF reconstructions [25, 26, 56–59].
Hausmann et al. [58], for example, found a higher lesion de-tection rate in a study comparing TOF and non-TOF 18 F-choline in PET/CT in 32 prostate cancer patients with biochemical recurrence. The gain in lesion detection due to TOF in PET/CT is attributed to several factors, whereas an improved signal to noise ratio and contrast to noise ratio is considered to play an important role [35, 60], especially in small lesions [57,61,62]. It is obvious that these factors are also relevant for PET/MRI, while the correction of SUV underestimation induced by MRAC plays an additional important role. Our measurements suggest that SUV underestimation does not only affect bone tissue but also lesion in the proximity of bones, leading to a negative correlation between relative difference in lymph node activity and distance to osseous structures, as shown in Fig. 3. An additional factor that could have influenced lesion detection is reduced scatter correction artifacts around the bladder and the liver/kidney in TOF, as previously described by Minamimoto et al. [35] in PET/MR. Our results additionally showed a higher interreader agreement for lymph node and bone metastasis on TOF compared to non-TOF.
A direct comparison of lesion detection in TOF and non-TOF PET/MRI in patients has not yet been re-ported. Therefore, no direct comparison of our results is possible. However, performance of choline PET/MRI compared to PET/CT in prostate patients has been in-vestigated previously in several studies using both TOF capable PET/MRI [8, 9] and non-TOF PET/MRI [7,12]. One study using TOF PET/MRI showed a higher lesion detection rate compared to TOF PET/CT [8], while two had equivocal results [9, 12] and one comparison of TOF PET/CT with non-TOF PET/MRI had a slightly higher detection rate on the TOF PET/CT (three lymph nodes, one bone lesion) [7].
TOF plays an important role in current PET/MRI im-aging for standard MR imim-aging-based attenuation cor-rection. Furthermore, TOF information is essential for promising emission-based attenuation correction tech-niques that might become standard attenuation correc-tion in PET/MRI in the near future [50, 63–65]. All these improvements are important for an accurate PET quantification to improve lesion detection sensitivity and to establish comparable results among PET/CT and PET/MRI systems.
Although a TOF OSEM reconstruction takes approxi-mately twice as long as a non-TOF OSEM reconstruction (3 m: 30 s vs 1 m: 45 s per bed on our system), the effect on the clinical workflow is usually limited. Modern recon-struction computers have sufficient computing power to re-construct an average dataset in the same time as an average patient scan. As modern reconstruction computers and software are optimized for parallel processing on central processing unit (GPU) and/or GPU cores, they are scalable to most clinical requirements [60].
Our study has inherent limitations; the study population including only 20 and rather heterogeneous patients does not allow any conclusion on the overall accuracy of 18
F-choline PET/MRI for staging or restaging prostate cancer, especially also given the heterogeneous reference standard with histopathology not available for all PET-positive lesions. However, bone metastases are usually not biopsied, and since it was our main interest to show the effect of TOF versus non-TOF on bony structures and metastasis, we selected a high-risk patient cohort for this project. Conse-quently, only a minority underwent surgical treatment or histological confirmation of the PET findings. Therefore, we did not report on sensitivity or specificity measurement of 18
F-choline PET/MRI but rather pointed out the differences for qualitative and quantitative assessments of TOF versus non-TOF reconstructions. Our reported subjective image quality data might be biased due to the inherent problem that readers usually identify TOF and non-TOF reconstruc-tions by its appearance in a blinded readout.
Conclusion
Our results show that TOF reconstruction of 18 F-choline PET/MRI increases SUV measurements in physiological osseous structures as well as pelvic malignancies compared to non-TOF reconstructions, es-pecially in bony lesions or lymph nodes in the proximity of bones. Furthermore, our study suggests a positive im-pact on lesion detection rate for lymph node and bone metastasis in prostate cancer patients if TOF reconstruc-tion is applied to18F-choline PET/MR.
Additional file
Additional file 1:Table S1.Results of image quality rating. (DOCX 12 kb)
Abbreviations
AC:Attenuation correction; CT: Computed tomography; MR: Magnetic resonance; MRAC: Magnetic resonance-based attenuation correction; OSEM: Ordered subset expectation maximization; PET: Positron emission tomography; PET/MRI: Positron emission tomography magnetic resonance imaging; ROI: Region of interest; RSD: Relative standard deviation; SUV: Standard uptake value; SUVmax: Maximum standardized uptake value; TOF: Time-of-flight
Acknowledgements
The authors thank the technicians Marlena Hofbauer, Miguel Porto, Sofia Kaltsuni, Sabrina Epp, Tobias Oblasser, Melanie Thüringer, and Michele Hug for their excellent work on high-quality PET/MRI.
Availability of data and materials
Please contact the author for data requests.
Authors’contributions
Ethics approval and consent to participate
This study was approved by the institutional review board (local ethics committee, KEK ZH-Nr 2013-0220). Informed consent was obtained from each patient prior to the study inclusion and to the PET/MRI.
Competing interests
The Department of Nuclear Medicine holds an institutional Research Contract with GE Healthcare. Author IAB has received research grants and speaker honorarium from GE Healthcare and Swiss Life. Author IAB received speaker honorarium from Bayer Health Care and Astellas Pharma AG. Patrick Veit-Haibach received investigator-initiated study grants from Bayer Healthcare, Siemens Healthcare, Roche Pharmaceuticals, GE Healthcare, and speaker’s fees from GE Healthcare. Authors UJM, HWN, AB, JM, KNV, FdGB, and EEGWtV declare no conflict of interest.
Publisher’s Note
Springer Nature remains neutral with regard to jurisdictional claims in published maps and institutional affiliations.
Author details
1Department of Diagnostic and Interventional Radiology, University Hospital
Zurich, Zurich, Switzerland.2Department of Nuclear Medicine, University Hospital Zurich, Zurich, Switzerland.3University Hospital Zurich, Zurich,
Switzerland.4Department of Diagnostic Imaging, Sirio Libanes Hospital, Sao
Paulo, Brazil.5University of Zurich, Zurich, Switzerland.6Department Joint
Medical Imaging, Toronto General Hospital, Toronto, ON, Canada.7University of Toronto, Toronto, ON, Canada.
Received: 16 January 2018 Accepted: 18 April 2018
References
1. Drzezga A, Souvatzoglou M, Eiber M, Beer AJ, Furst S, Martinez-Moller A, et al. First clinical experience with integrated whole-body PET/MR: comparison to PET/CT in patients with oncologic diagnoses. J Nucl Med. 2012;53:845– 55.
2. Afshar-Oromieh A, Haberkorn U, Hadaschik B, Habl G, Eder M, Eisenhut M, et al. PET/MRI with a 68Ga-PSMA ligand for the detection of prostate cancer. Eur J Nucl Med Mol Imaging. 2013;40:1629–30.
3. Eiber M, Weirich G, Holzapfel K, Souvatzoglou M, Haller B, Rauscher I, et al. Simultaneous 68Ga-PSMA HBED-CC PET/MRI improves the localization of primary prostate cancer. Eur Urol. 2016;70:829–36.
4. Grueneisen J, Schaarschmidt BM, Heubner M, Aktas B, Kinner S, Forsting M, et al. Integrated PET/MRI for whole-body staging of patients with primary cervical cancer: preliminary results. Eur J Nucl Med Mol Imaging. 2015;42: 1814–24.
5. Fanti S, Minozzi S, Castellucci P, Balduzzi S, Herrmann K, Krause BJ, et al. PET/CT with 11C-choline for evaluation of prostate cancer patients with biochemical recurrence: meta-analysis and critical review of available data. Eur J Nucl Med Mol Imaging. 2016;43:55–69.
6. Wiesmüller M, Quick HH, Navalpakkam B, Lell MM, Uder M, Ritt P, et al. Comparison of lesion detection and quantitation of tracer uptake between PET from a simultaneously acquiring whole-body PET/MR hybrid scanner and PET from PET/CT. Eur J Nucl Med Mol Imaging. 2013;40:12–21. 7. Souvatzoglou M, Eiber M, Takei T, Fürst S, Maurer T, Gaertner F, et al.
Comparison of integrated whole-body [11C]choline PET/MR with PET/CT in patients with prostate cancer. Eur J Nucl Med Mol Imaging. 2013;40:1486–99. 8. Lamanna G, Tabouret-Viaud C, Rager O, Jorcano S, Vees H-J, Seimbille Y, et al. Long-term results of a comparative PET/CT and PET/MRI study of 11C-acetate and 18F-fluorocholine for restaging of early recurrent prostate cancer. Clin Nucl Med. 2017;42:e242–6.
9. Oprea-Lager DE, Yaqub M, Pieters IC, Reinhard R, van Moorselaar RJA, van den Eertwegh AJM, et al. A clinical and experimental comparison of time of flight PET/MRI and PET/CT systems. Mol Imaging Biol. 2015;17:714–25. 10. de Perrot T, Rager O, Scheffler M, Lord M, Pusztaszeri M, Iselin C, et al.
Potential of hybrid 18F-fluorocholine PET/MRI for prostate cancer imaging. Eur J Nucl Med Mol Imaging. 2014;41:1744–55.
11. Piert M, Montgomery J, Kunju LP, Siddiqui J, Rogers V, Rajendiran T, et al. 18F-choline PET/MRI: the additional value of PET for MRI-guided transrectal prostate biopsies. J Nucl Med. 2016;57:1065–70.
12. Wetter A, Lipponer C, Nensa F, Beiderwellen K, Olbricht T, Rübben H, et al. Simultaneous 18F choline positron emission tomography/magnetic resonance imaging of the prostate: initial results. Investig Radiol. 2013;48:256–62. 13. Wagenknecht G, Kaiser HJ, Mottaghy FM, Herzog H. MRI for attenuation
correction in PET: methods and challenges. Magn Reson Mater Phys Biol Med. 2013;26:99–113.
14. Bezrukov I, Mantlik F, Schmidt H, Schölkopf B, Pichler BJ. MR-based PET attenuation correction for PET/MR imaging. Semin Nucl Med 2013;43:45–59. Elsevier Inc.
15. Samarin A, Burger C, Wollenweber SD, Crook DW, Burger IA, Schmid DT, et al. PET/MR imaging of bone lesions—implications for PET quantification from imperfect attenuation correction. Eur J Nucl Med Mol Imaging. 2012; 39:1154–60.
16. Seith F, Gatidis S, Schmidt H, Bezrukov I, la Fougère C, Nikolaou K, et al. Comparison of positron emission tomography quantification using magnetic resonance- and computed tomography-based attenuation correction in physiological tissues and lesions. Investig Radiol. 2016;51:66–71. 17. Schleyer PJ, Schaeffter T, Marsden PK. The effect of inaccurate bone
attenuation coefficient and segmentation on reconstructed PET images. Nucl Med Commun. 2010;31:708–16.
18. Akbarzadeh A, Ay MR, Ahmadian A, Riahi Alam N, Zaidi H. MRI-guided attenuation correction in whole-body PET/MR: assessment of the effect of bone attenuation. Ann Nucl Med. 2013;27:152–62.
19. Schramm G, Langner J, Hofheinz F, Petr J, Beuthien-Baumann B, Platzek I, et al. Quantitative accuracy of attenuation correction in the Philips Ingenuity TF whole-body PET/MR system: a direct comparison with transmission-based attenuation correction. Magn Reson Mater Phys Biol Med. 2013;26: 115–26.
20. Kim JH, Lee JS, Song I-C, Lee DS. Comparison of segmentation-based attenuation correction methods for PET/MRI: evaluation of bone and liver standardized uptake value with oncologic PET/CT data. J Nucl Med. 2012;53: 1878–82.
21. Mehranian A, Zaidi H. Impact of time-of-flight PET on quantification errors in MR imaging-based attenuation correction. J Nucl Med Off Publ Soc Nucl Med. 2015;56:635–41.
22. Yamamoto M, Ficke DC, Ter-Pogossian MM. Experimental assessment of the gain achieved by the utilization of time-of-flight information in a positron emission tomograph (Super PETT I). IEEE Trans Med Imaging. 1982;1:187–92. 23. Surti S. Update on time-of-flight PET imaging. J Nucl Med. 2015;56:98–105. 24. Surti S, Kuhn A, Werner ME, Perkins AE, Kolthammer J, Karp JS. Performance
of Philips Gemini TF PET/CT scanner with special consideration for its time-of-flight imaging capabilities. J Nucl Med Off Publ Soc Nucl Med. 2007;48: 471–80.
25. Karp JS, Surti S, Daube-Witherspoon ME, Muehllehner G. Benefit of time-of-flight in PET: experimental and clinical results. J Nucl Med. 2008;49:462–70. 26. Lois C, Jakoby BW, Long MJ, Hubner KF, Barker DW, Casey ME, et al. An
assessment of the impact of incorporating time-of-flight information into clinical PET/CT imaging. J Nucl Med. 2010;51:237–45.
27. Conti M. Why is TOF PET reconstruction a more robust method in the presence of inconsistent data? Phys Med Biol. 2011;56:155–68.
28. Kadrmas DJ, Casey ME, Conti M, Jakoby BW, Lois C, Townsend DW. Impact of time-of-flight on PET tumor detection. J Nucl Med Off Publ Soc Nucl Med. 2009;50:1315–23.
29. Delso G, Khalighi M, Hofbauer M, Porto M, Veit-Haibach P, von Schulthess G. Preliminary evaluation of image quality in a new clinical ToF-PET/MR scanner. EJNMMI Phys. 2014;1:A41.
30. Minamimoto R, Levin C, Jamali M, Holley D, Barkhodari A, Zaharchuk G, et al. Improvements in PET image quality in time of flight (TOF) simultaneous PET/MRI. Mol Imaging Biol. 2016;
31. ter Voert EEGW, Veit-Haibach P, Ahn S, Wiesinger F, Khalighi MM, Levin CS, et al. Clinical evaluation of TOF versus non-TOF on PET artifacts in simultaneous PET/MR: a dual centre experience. Eur J Nucl Med Mol Imaging; 2017.
32. Zeimpekis KG, Barbosa F, Hüllner M, ter Voert E, Davison H, Veit-Haibach P, et al. Clinical evaluation of PET image quality as a function of acquisition time in a new TOF-PET/MRI compared to TOF-PET/CT—initial results. Mol Imaging Biol. 2015;17:735–44.
34. Burger IA, Wurnig MC, Becker AS, Kenkel D, Delso G, Veit-Haibach P, et al. Hybrid PET/MR imaging: an algorithm to reduce metal artifacts from dental implants in Dixon-based attenuation map generation using a
multiacquisition variable-resonance image combination sequence. J Nucl Med. 2015;56:93–7.
35. Minamimoto R, Levin C, Jamali M, Holley D, Barkhodari A, Zaharchuk G, et al. Improvements in PET image quality in time of flight (TOF) simultaneous PET/MRI. Mol Imaging Biol. 2016;18:776–81.
36. Delso G, Khalighi M, Ter Voert E, Barbosa F, Sekine T, Hüllner M, et al. Effect of time-of-flight information on PET/MR reconstruction artifacts: comparison of free-breathing versus breath-hold MR-based attenuation correction. Radiology. 2016;000:152509.
37. Huellner MW, Appenzeller P, Kuhn FP, Husmann L, Pietsch CM, Burger IA, et al. Whole-body nonenhanced PET/MR versus PET/CT in the staging and restaging of cancers: preliminary observations. Radiology. 2014;273:859–69. 38. de Galiza Barbosa F, Delso G, Zeimpekis KG, Ter Voert E, Hullner M,
Stolzmann P, et al. Evaluation and clinical quantification of neoplastic lesions and physiological structures in TOF-PET/MRI and non-TOF/MRI—a pilot study. Q J Nucl Med Mol Imaging. 2015;
39. Levin CS, Jansen F, Deller T, Maramraju S, Grant A, Iagaru A. Performance of a high sensitivity time-of-flight PET ring operating simultaneously within a 3T MR system. EJNMMI Phys. 2014;1:A72.
40. Bley TA, Wieben O, François CJ, Brittain JH, Reeder SB. Fat and water magnetic resonance imaging: fat and water MRI. J Magn Reson Imaging. 2010;31:4–18. 41. Dixon WT. Simple proton spectroscopic imaging. Radiology. 1984;153:189–94. 42. Wollenweber SD, Ambwani S, Delso G, Lonn AHR, Mullick R, Wiesinger F, et
al. Evaluation of an atlas-based PET head attenuation correction using PET/ CT & MR patient data. IEEE Trans Nucl Sci. 2013;60:3383–90.
43. Wollenweber SD, Ambwani S, Lonn AHR, Shanbhag DD, Thiruvenkadam S, Kaushik S, et al. Comparison of 4-Class and Continuous Fat/Water Methods for Whole-Body, MR-Based PET Attenuation Correction. IEEE Transactions on Nuclear Science. 2013;60:3391–8.
44. Wollenweber S. Comparison of 4-c1ass and continuous fat/water methods for whole-body, MR-based PET attenuation correction. IEEE Nucl Sci Symp Med Imaging Conf. 2012:3019–25.
45. Hochberg Y, Tamhane AC. Multiple comparison procedures. Hoboken, NJ: John Wiley & Sons; 1987.
46. Bland JM, Altman D. Statistical methods for assessing agreement between two methods of clinical measurement. Lancet. 1986;327:307–10. 47. Hale CA, Fleiss JL. Interval estimation under two study designs for kappa
with binary classifications. Biometrics. 1993;49:523–34.
48. Zapf A, Castell S, Morawietz L, Karch A. Measuring inter-rater reliability for nominal data—which coefficients and confidence intervals are appropriate? BMC Med Res Methodol; 2016.
49. Landis JR, Koch GG. The measurement of observer agreement for categorical data. Biometrics. 1977;33:159–74.
50. Boellaard R, Hofman MBM, Hoekstra OS, Lammertsma AA. Accurate PET/MR quantification using time of flight MLAA image reconstruction. Mol Imaging Biol. 2014;16:469–77.
51. Sunderland JJ, Christian PE. Quantitative PET/CT scanner performance characterization based upon the Society of Nuclear Medicine and Molecular Imaging clinical trials network oncology clinical simulator phantom. J Nucl Med. 2015;56:145–52.
52. Oldan JD, Turkington TG, Choudhury K, Chin BB. Quantitative differences in [18F] NaF PET/CT: TOF versus non-TOF measurements. Am J Nucl Med Mol Imaging. 2015;5:504–14.
53. Minamimoto R, Xu G, Jamali M, Holley D, Barkhodari A, Zaharchuk G, et al. Semiquantitative assessment of18F-FDG uptake in the normal skeleton:
comparison between PET/CT and time-of-flight simultaneous PET/MRI. Am J Roentgenol. 2017;209:1136–42.
54. Thompson HM, Minamimoto R, Jamali M, Barkhodari A, von Eyben R, Iagaru A. A prospective, matched comparison study of SUV measurements from time-of-flight versus non–time-of-flight PET/CT scanners. Clin Nucl Med. 2016;00:1. 55. Mollard B, Behr S, Seo Y, Hawkins R, Flavell R. Effect of time-of-flight
reconstruction on SUVmax, SUVpeak, SUVaverage, and tumor volume in newly diagnosed prostate cancer with 18F choline PET/MRI. J Nucl Med. 2016;57:1991.
56. Surti S, Scheuermann J, El Fakhri G, Daube-Witherspoon ME, Lim R, Abi-Hatem N, et al. Impact of time-of-flight PET on whole-body oncologic studies: a human observer lesion detection and localization study. J Nucl Med. 2011;52:712–9.
57. Daube-Witherspoon ME, Surti S, Perkins AE, Karp JS. Determination of accuracy and precision of lesion uptake measurements in human subjects with time-of-flight PET. J Nucl Med. 2014;55:602–7.
58. Hausmann D, Bittencourt LK, Attenberger UI, Sertdemir M, Weidner A, Büsing KA, et al. Diagnostic accuracy of 18F choline PET/CT using time-of-flight reconstruction algorithm in prostate cancer patients with biochemical recurrence. Clin Nucl Med. 2014;39:e197–201.
59. El Fakhri G, Surti S, Trott CM, Scheuermann J, Karp JS. Improvement in lesion detection with whole-body oncologic time-of-flight PET. J Nucl Med. 2011;52:347–53.
60. Vandenberghe S, Mikhaylova E, D’Hoe E, Mollet P, Karp JS. Recent developments in time-of-flight PET. EJNMMI Phys; 2016.
61. Wilson JM, Turkington TG. TOF-PET small-lesion image quality measured over a range of phantom sizes. IEEE Trans Nucl Sci. 2013;60:1589–95. 62. Andreyev A, Bai C, Zhang B, Narayanan M, Hu Z, Salomon A, et al. Small
lesion visibility: can non-TOF PET with advanced reconstruction techniques or higher statistics achieve the same lesion visibility as TOF PET? J Nucl Med. 2016;57:1966.
63. Mollet P, Keereman V, Clementel E, Vandenberghe S. Simultaneous MR-compatible emission and transmission imaging for PET using time-of-flight information. IEEE Trans Med Imaging. 2012;31:1734–42.
64. Mollet P, Keereman V, Bini J, Izquierdo-Garcia D, Fayad ZA, Vandenberghe S. Improvement of attenuation correction in time-of-flight PET/MR imaging with a positron-emitting source. J Nucl Med. 2014;55:329–36.