R E S E A R C H A R T I C L E
Open Access
Lifestyle choices and mental health:
a representative population survey
Julia Velten
1*, Kristen L Lavallee
1,2, Saskia Scholten
1, Andrea Hans Meyer
2, Xiao-Chi Zhang
1, Silvia Schneider
1and Jürgen Margraf
1Abstract
Background:Identifying healthy lifestyle behaviours that promote psychological wellbeing is crucial to preventing mental disorders. The aim of the current study was to evaluate the individual and combined associations between different aspects of everyday life and mental health within a representative community sample in Germany. Method:The study was conducted in 2012/2013 and included 7,937 participants representative of the German population. Lifestyle factors were assessed via self-report and included frequency of physical and mental activity, alcohol consumption, smoking, body mass index as well as circadian and social regularity. Outcome variables were depression, anxiety, stress and satisfaction with life.
Results:All lifestyle factors were associated with the mental health outcomes. Better mental health was linked to higher frequency of physical and mental activity, moderate alcohol consumption (i.e. not increased or no alcohol consumption), non-smoking, a body mass index within the range of normal to overweight (i.e. not underweight or obese) and a regular life rhythm. The more healthy lifestyle choices an individual makes, the higher life satisfaction and lower psychological distress he or she tends to have.
Conclusions:The current study underlines the importance of healthy lifestyle choices in respect to psychological wellbeing.
Keywords:Lifestyle, Mental health, Depression, Anxiety, Physical activity, Smoking, Alcohol, Obesity
Background
Mental health is increasingly recognized as a critical component of general public health (Herrman et al. 2005). Every year, more than 38% of the population within the European Union suffers from at least one mental disorder. Both direct health care costs as well as non-medical and indirect costs are immense, as mental and neurological disorders led to total costs of€798 billion in Europe in 2010. The most expensive mental disorders are mood (€113.4 billion), psychotic (€94.0 billion), and anxiety disorders (€74.4 billion) with unipolar depression being the most burdensome in terms of years of lost prod-uctivity due to disability or premature mortality (Olesen et al. 2012). Indeed, the need for health promotion,
prevention and treatment programs for mental disorders is arguably the primary health challenge of the 21st cen-tury in Europe (Wittchen et al. 2011). Identifying risk and protective lifestyle factors that promote mental health is thus crucial to reducing the burden of mental disorders.
Lifestyle behaviours and health
Mental health is influenced not only by trait markers, general living conditions and major life events, but also, as increasing evidence indicates, by simple everyday be-haviours that can be altered by an individual. Prospective studies consistently find a bidirectional relationship be-tween various lifestyle factors and physical as well as mental health, with important health improvements and wellbeing following relatively small changes in lifestyle (Jonsdottir et al. 2010; Xu et al. 2010).
Various lifestyle choices are known promoters of phys-ical health, including engaging in sports or moderate to rigorous physical activity (Fogelholm 2010), participating * Correspondence:julia.velten@rub.de
1
Faculty of Psychology, Department of Clinical Psychology and Psychotherapy, Mental Health Research and Treatment Center, Ruhr-Universität Bochum, Massenbergstrasse 9-13, D-44787 Bochum, Germany
Full list of author information is available at the end of the article
in cultural or mental activities, like singing in a choir or reading a book (Bygren et al. 1996; Bygren et al. 2009), refraining from smoking (Schane et al. 2010), practicing moderation in alcohol consumption (Ronksley et al. 2011), maintaining a body mass index (BMI) within the range of normal weight (Harriss et al. 2009b), and eating a healthy diet (Scarborough et al. 2012). A robust relation-ship between these lifestyle choices and various somatic diseases, including cancer (Harriss et al. 2009a), heart dis-ease (Sattelmair et al. 2011), or stroke (He et al. 2006) is well documented.
Evidence indicates that such lifestyle factors also have a positive effect on the psychological domain, reducing depression as well as anxiety (Scott et al. 2008; Xu et al. 2010), increasing life satisfaction (Headey et al. 2013) and self-perceived general mental health (Chaney et al. 2007; Hamer et al. 2009; Rohrer et al. 2005). A recent re-view by Mammen and Faulkner (2013) analysed 30 pro-spective longitudinal studies and identified physical activity as an important protective factor in reducing the risk of developing depression. Another systematic review acknowledged positive effects of exercise training inter-ventions on reducing symptoms of anxiety in patients with chronic illnesses. Systematic aggregation of 40 treatment studies estimated the anxiety reduction with an average ef-fect size ofd= 0.29 for the training condition as compared with the controls without exercise training (Herring et al. 2010). Cuypers et al. (2012) reported a small, but positive effect of cultural or creative activities on various mental health outcomes, including depression, anxiety and life satisfaction in both men and women. As in the domain of physical health outcomes, smoking has also been identi-fied as a risk factor for psychological distress (Kinnunen et al. 2006; Lien et al. 2009). The relationship between alcohol consumption and psychological distress is still controversial. While some studies identify a nonlinear re-lationship, with elevated risks for depression and anxiety for abstainers and heavy drinkers as compared to light/ moderate drinkers (Rodgers et al. 2000), other studies did not find any meaningful correlation between alco-hol consumption and symptoms of psycalco-hological distress (Xu et al. 2010). The research regarding the relationship between body mass index (BMI) and mental health is also contradictory. Data from 46,704 participants in the South Australian Monitoring and Surveillance System, which measures nationwide trends in risk factors and chronic diseases, indicated a nonlinear relationship between BMI and mental health, with greater odds of mental health problems only in obese women (Kelly et al. 2011). Other studies suggested elevated risks for mental disorders for young women with obesity (Becker et al. 2001) or de-scribed underweight individuals (Molarius et al. 2009) as an additional risk group. In addition to the above men-tioned lifestyle factors, the influence of circadian and
social rhythms on mental health are currently under investigation. The association between various mental disorders and disturbances of circadian rhythms is also documented, especially for schizophrenia, bipolar disorder and depression (Jagannath et al. 2013). Disruptions of cir-cadian rhythms may indeed trigger or exaggerate episodes of mania (McClung 2007) and first evidence suggests that cognitive behavioural treatment of insomnia may improve psychotic symptoms in individuals with persistent delu-sions (Myers et al. 2011). Although the exact mechanisms are still unclear, there is evidence that the circadian system is also an important regulator of other vital functions and influences one’s capacity for mood regulation (McClung 2013). Additionally, irregular social rhythms, which in-clude social contacts, are also associated with mood disor-ders. A recent study indicated that elderly patients with major depressive disorder exhibit a lower regu-larity in their social rhythms compared to healthy con-trols (Lieverse et al. 2013). Although the understanding of the bidirectional relations between affective disorders and life rhythm is still preliminary, research indicates that so-cial and circadian rhythms play an important role in un-derstanding mood disorders (Grandin et al. 2006).
Lifestyle composite scores
Healthy and unhealthy lifestyle behaviours tend to occur in clusters (Conry et al. 2011). A healthy way of life can be characterized as an accumulation of multiple healthy lifestyle choices. Therefore, research has recently been approaching lifestyle with a more holistic view and seeks to evaluate the cumulative effects of protective lifestyle behaviours on health outcomes.
An evaluation of data from the EPIC-Norfolk Prospective Population Study indicated that the presence of a combin-ation of four important healthy lifestyle behaviours de-creased mortality substantially when compared with an absence of these behaviours (Khaw et al. 2008). Healthy life-style behaviours in this study included non-smoking, at least 30 minutes of daily physical activity, moderate or no alcohol intake and at least sufficient fruit/vegetable intake (measured via plasma vitamin C levels). With rising num-ber of healthy behaviours, a corresponding reduced mortal-ity risk over the evaluated period of eleven years was observed. For example, individuals that engaged in all four health behaviours had a 4-fold reduced mortality risk – equivalent to 14 years longer life expectancy – as com-pared to persons who did not meet the threshold on any of these behaviours (Khaw et al. 2008). The same pattern of results was found for the relation between the number of health behaviours and stroke. These four behaviours predicted more than a twofold difference in incidence of stroke in the same study population (Myint et al. 2009).
overall health and depression (Harrington et al. 2010). This PLB score also included being physically active, non-smoking, moderate alcohol consumption and adequate fruit and vegetable intake. A higher number of PLBs was associated with better perceived overall health and greater mental health outcomes. Individuals displaying no PLBs had a more than four times higher likelihood of suffering from a major depressive disorder and a seven times lower chance of perceiving their health as excellent/very good than subjects with four PLBs.
While there is evidence that physical health and de-pressive symptoms improve with a rising number of PLBs, there is a lack of literature concerning the effect of a combination of PLBs on life satisfaction or on other psychological syndromes like anxiety or stress. Research has focused mainly on certain lifestyle factors, such as physical activity, smoking or alcohol consumption, while other aspects of everyday life have not been researched satisfactorily. Social and circadian rhythm, although known predictors or mental health, have not been in-vestigated as part of a PLB score and although research revealed a dose–response relationship between the num-ber of cultural and creative activities and mental health (Cuypers et al. 2012), this health-related lifestyle has not yet been investigated in combination with other lifestyle factors.
The present study
The aim of the present study, therefore, was to extend the work on the impact of major lifestyle factors to a broad spectrum of aspects of mental health and to ana-lyse the individual and combined associations between lifestyle health behaviours and psychological distress or wellbeing. The study included major lifestyle factors previously shown to have an effect on physical health and depression, including smoking, alcohol drinking fre-quency, physical activity and body-mass-index as predic-tors of mental health in a representative community sample. Additionally, we included mental/cultural activ-ity and circadian and social rhythms, previously under-investigated in population-based surveys, and aimed to investigate their unique contributions in predicting men-tal wellbeing in the general public. Following the approach of Harrington et al. (2010) and Khaw et al. (2008), we sought to examine the combined associations of the ex-amined lifestyle behaviours with mental health and life satisfaction.
Positive lifestyle factors were expected to be independ-ently associated with lowered psychological distress and greater life satisfaction. We also expected an additive ef-fect; in that the more healthy lifestyle choices an individ-ual reported, the lower the psychological distress and the greater the life satisfaction reported by that partici-pant would be.
Method
Procedure
This study was conducted as part of the Bochum opti-mism and mental health studies (BOOM-studies), which aim to investigate risk and protective factors of mental health in representative and student samples with cross-sectional and longitudinal assessments across different cultures. Presented data were collected between November 2012 and February 2013 through three professional opin-ion research institutes. Four different assessment methods were used: face-to-face interviews, telephone interviews, online survey, and a mixed-method-approach that allowed individuals to participate either online or via set-top box. All analyses and results presented in this study are con-trolled for their data assessment methods. Participants were either recruited via telephone or were registered members of an online panel. Trained professional inter-viewers conducted the telephone and personal interviews with computer assistance. The online and mixed-method data were assessed through self-administered surveys. De-pending on the data assessment method, participants gave their informed consent written or orally after being in-formed about anonymity and voluntariness of the survey. Participants received no financial compensation. Repre-sentativeness for the German adult residential population, based on the register-assisted census data from 2011 re-garding age, gender and education, was ensured via sys-tematized sampling procedures. This procedure included the next-birthday-method, resulting in an equal chance for all household members of being selected for the tele-phone or face-to-face interview. The Ethics Committee of the Faculty of Psychology of the Ruhr-Universität Bochum approved the study.
Participants
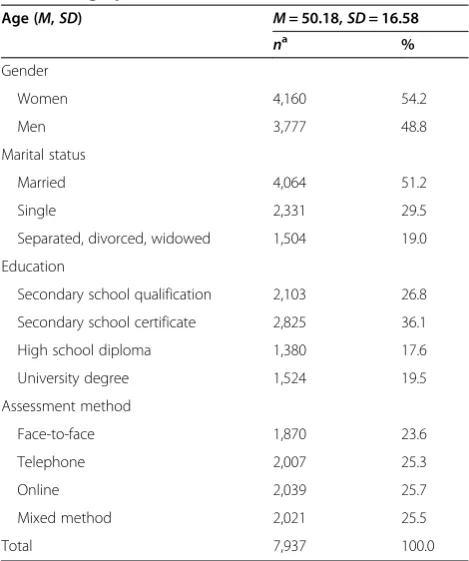
In total, 7,937 participants completed the survey. Partici-pants were between 18 and 99 years old (M= 50.18,SD= 16.58) and 54.2% (n= 4,160) were females. About half of the participants (51.2%,n= 4,064) identified themselves as married, 29.5% (n= 4,064) were single and 19.0% (n= 1,504) separated, divorced or widowed. The four subsam-ples with different data assessment methods varied in size between 23.6% (n= 1,870) for face-to-face interviews and 25.7% (n= 2,039) for online participants. Table 1 provides an overview of the sample characteristics, including gen-der, marital status, educational level and data assessment method.
Measures
Lifestyle behaviours
have you exercised in the last 12 months?” Single-item measures of physical activity are characterized by an ac-ceptable reliability and construct validity compared to objective measurement methods (Milton et al. 2011).
Frequency of mental/cultural activity Frequencies of mental/cultural activities were assessed using one item rated on a scale ranging from 0 (none) to 3 (more than 4 times a week): “Do you regularly engage yourself in a mental activity, and if yes with what intensity have you done it in the last 12 months?”.
Alcohol consumption Frequency of alcohol consump-tion was assessed using one item: “How often do you drink alcohol?” Answer categories were never, once a month, 2 to 4 times a month, 2 to 3 times a week and 4 times a week and more. While there is an on-going troversy about the validity of self-reported alcohol con-sumption compared to objective data, recent studies conclude that self-report can be a reliable estimate for alcohol consumption, especially in low to moderate drinkers (Gmel and Rehm 2004). To account for pos-sible non-linear associations between alcohol drinking frequency and mental health (as described in Rodgers et al. 2000) a quadratic polynomial was added to the statistical analyses.
Smoking Current smoking was assessed using one item: “Do you smoke regularly?” Answer categories were ‘no’, ‘yes, sometimes’and‘yes, regularly’. For the present ana-lyses the two latter categories were combined into‘yes’, which was coded as 1.‘No’was coded as 2.
Body mass index Body mass index (BMI) was calculated from weight and height as weight divided by height squared (kg/m2). Height and weight were assessed via self-report. Self-reported measurements of height and weight have been found to be very reliable, with the exception of highly obese individuals. For this group a slight underesti-mation of weight has been reported (Gorber et al. 2007). Previous research indicated impaired mental health in underweight and obese individuals (e.g., Molarius et al. 2009), and thus a quadratic polynomial of body mass index was also added to the analyses.
Circadian and social rhythms Circadian and social rhythms were assessed using the Life Rhythms Scale (Margraf, Lavallee, Zhang & Schneider, unpublished manuscript), which includes 10 items measuring an indi-vidual’s perceived life rhythm regarding sleep, meals, wake-up time and social contacts on a scale ranging from 1 (very regularly) to 6 (very irregularly). The first scale, “circadian rhythm”, consists of six items and in-cludes statements about regularity of meals, going to bed and getting up on weekdays and weekends. The second scale, “social rhythm”, consists of four items and de-scribes the regularity of social contacts with colleagues or friends on weekdays and weekends. In the present study, Cronbach’s Alpha was good with α= .84 for circadian rhythm and acceptable withα= .73 for social rhythm. Val-idity evidence comes from data indicating that the full scale is related to physical health, consistent with past re-search on rhythmicity and certain aspects of mental health (Margraf et al., unpublished manuscript).
Protective lifestyle score
To evaluate the combined effects of healthy lifestyle be-haviours, we constructed a protective lifestyle behaviour (PLB) score, as such scores have been used to examine the combined influence of different lifestyle factors on mental or physical health (Harrington et al. 2010; Khaw et al. 2008). In this study, the PLB score was calculated via aggregation of all assessed lifestyle behaviours. On this account, lifestyle behaviours were dichotomized into two variables; one reflecting a rather healthy lifestyle, the other reflecting a relatively unhealthy lifestyle behaviour. Therefore, if a participant did not meet the minimum threshold he/she was assigned a 0 for the particular life-style behaviour, and if the participant met the minimum, he/she was assigned a 1. The threshold was defined with re-gard to the existing literature on dose–response relationships Table 1 Sample characteristics regarding
sociodemographic variables
Age (M,SD) M= 50.18,SD= 16.58
na % Gender
Women 4,160 54.2
Men 3,777 48.8
Marital status
Married 4,064 51.2
Single 2,331 29.5
Separated, divorced, widowed 1,504 19.0
Education
Secondary school qualification 2,103 26.8
Secondary school certificate 2,825 36.1
High school diploma 1,380 17.6
University degree 1,524 19.5
Assessment method
Face-to-face 1,870 23.6
Telephone 2,007 25.3
Online 2,039 25.7
Mixed method 2,021 25.5
Total 7,937 100.0
Note.a
between lifestyle and mental health (Hamer et al. 2009) and with regard to our own analyses. Healthy lifestyle choices with respect to the PLB score included engaging in physical exercise or mental/cultural activity at least once a month, being non-smoker, moderation in alcohol consumption (once a month to three times per week), reporting a BMI between 18.5 and 29.9 (normal- or over-weight, but not underweight or obese) and having a rela-tively regular social and circadian rhythm compared to others (median-split). Scores were then summed across variables. Summary scores ranged from zero (least healthy lifestyle) to seven (most healthy lifestyle) indicating the number of protective lifestyle behaviours shown by the participant.
Mental health questionnaires
Satisfaction with life Life satisfaction was assessed with the Satisfaction With Life Scale (SWLS; Diener et al. 1985), a self-report questionnaire designed to assess the judgmen-tal component of personal wellbeing with five items rated on a scale ranging from 1 (strongly disagree) to 7 (strongly agree). Summing across items yields a total score ranging from 5 to 35, with a cut-off of 19 for at least average life satisfaction. Research indicates that SWLS has high con-vergent and discriminant validity (Pavot and Diener 2008). In the present sample Cronbach’s Alpha wasα= .89.
Depression, anxiety, and stressThe negative emotional states of depression, anxiety, and stress over the last seven days were assessed with the Depression Anxiety Stress Scales–21 (DASS-21; Henry and Crawford 2005), a short version of the Depression Anxiety Stress Scales (Lovibond and Lovibond 1995). The DASS-21 consists of 21 items, 7 for each subscale, rated on a 4-point Likert scale ranging from 0 (did not apply to me at all) to 3 (ap-plied to me very much, or most of the time). Summing across subscales yields three total scores from 0 to 21, with clinical cut-offs of 10 for depression (DASS-D), 6 for anxiety (DASS-A), and 10 for stress (DASS-S). Individuals that met this threshold were considered “symptomatic”. DASS-21 is a widely used instrument with good psycho-metric properties (Sheaet al. 2009). Cronbach’s Alphas in the present sample wereα= .90,α= .83 andα= .89 for the DASS-D, DASS-A and DASS-S, respectively.
Sociodemographic variables
Gender, age, educational level, marital status and data assessment method were assessed and controlled for in the following analyses.
Data analyses
Data were analysed using SPSS (Version 21). Multiple hierarchical linear regression analyses were conducted to examine the relationship between lifestyle behaviours
and mental health outcomes. We entered the sociode-mographic variables in the first step, and added the seven separate lifestyle behaviours, supplemented by quadratic predictors for alcohol frequency and body mass index, in the second step. This procedure allowed for a determination of the variance explained in mental health by the lifestyle factors above and beyond the socio-demographic variables. To assess the combined effect of lifestyle on mental health, hierarchical logistic regressions were used to calculate odds ratios (OR) with 95% confi-dence intervals for the likelihood of being satisfied with life or feeling none to low psychological symptoms. The out-come variables were dichotomized into non-symptomatic and symptomatic. Again, control variables were included in the first step, followed by the protective lifestyle behav-iour (PLB) score as the predictor in the second step. The reference category used was 0 to 2 protective lifestyle be-haviours. Missing data were handled using a multiple im-putation procedure.
Results
Sample characteristics
Table 2 displays the sample characteristics regarding life-style variables and mental health outcomes for women and men. Women described a higher frequency in mental/ cultural activities compared to men, while men reported more frequent alcohol consumption. Women exhibited a lower body mass index, a more regular circadian rhythm as well as a less regular social rhythm compared to men. Average life satisfaction scores for both genders were slightly below 25, falling between the categories“average” and“high” life satisfaction (Diener et al. 1985). Significant gender differences in psychological distress were also found, with higher ratings for depression, anxiety, and stress in women. Gender differences were minimal to small (d< .20) for all factors, except alcohol consumption, which approached a medium effect size (d= .47) with men drink-ing significantly more often. Further details are displayed in Table 2.
Individual lifestyle behaviours and mental health
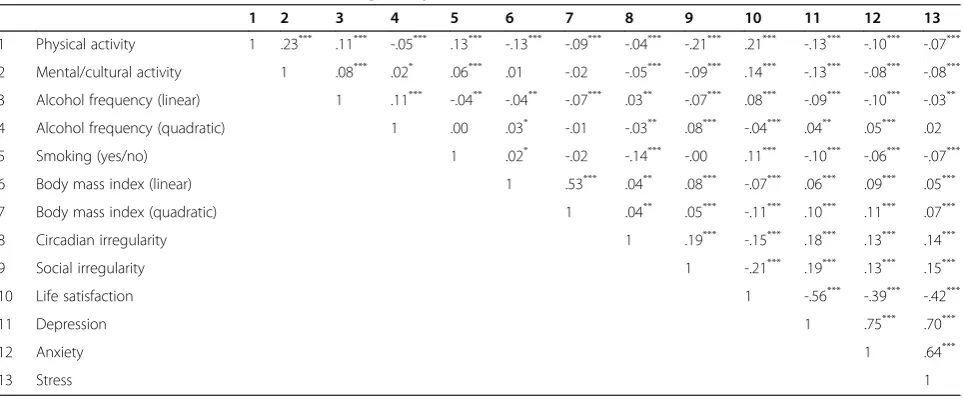
Table 3 displays bivariate correlations among lifestyle be-haviours, life satisfaction, depression, anxiety, and stress. The lifestyle behaviours correlated significantly and in the expected direction with each other (i.e. healthy haviours in one domain were correlated with healthy be-haviours in other domains), with effects in the minimal to small range. The mental health measures were also inter-correlated; life satisfaction being negatively associated with depression, anxiety, and stress, which furthermore all cor-related positively with each other with medium to large ef-fect sizes.
small. Associations were in the expected direction with supposedly healthier behaviours relating to higher life sat-isfaction as well as to lower depression, anxiety, and stress. The quadratic term of alcohol frequency was negatively correlated with life satisfaction, and positively correlated with levels of depression and anxiety, indicating greater mental health for moderate drinkers compared to ab-stainers and very frequent drinkers. A similar pattern was found for the squared BMI term, which was also nega-tively correlated with life satisfaction and posinega-tively corre-lated with all three measures of psychological distress.
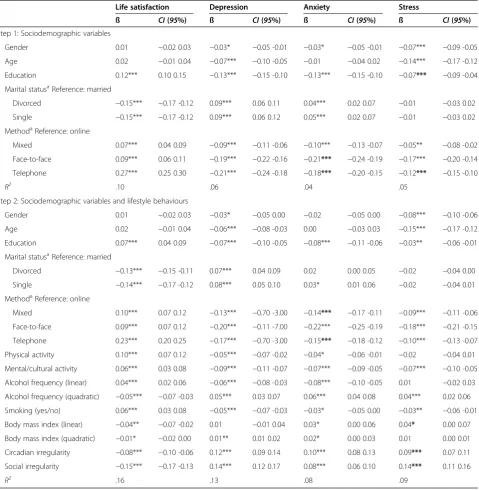
The results of the hierarchical regression analyses are presented in Table 4. Step 1 included the control variables gender, age, educational level, marital status, and assess-ment method. Step 2 added the lifestyle behaviours as
predictors. Greater frequency of mental/cultural activ-ities, non-smoking and regular social and circadian life rhythms were associated with greater mental health re-garding all four outcome measures. Physical activity was related to greater life satisfaction as well as lower depres-sion and anxiety scores. The significant squared terms of alcohol drinking frequency indicated lower mental health levels in all four outcome measures for abstainers and very frequent drinkers. The significant quadratic term of BMI indicated lower levels of life satisfaction and greater levels of depression and anxiety in underweight and obese indi-viduals. The greater the BMI, the greater the levels of re-ported symptoms of stress, even though only significant on a 5% level. All lifestyle predictors together explained a significant proportion of variance in life satisfaction Table 2 Descriptive variables and t-tests of lifestyle behaviours and mental health measures for women and men
Women Men t(df) CI(95%) d
Lifestyle behaviours Range na M SD na M SD
Physical activity 0-3 4,118 1.85 1.39 3,739 1.85 1.39 −0.08 (7855) −0.06 0.06 .00
Mental/cultural activity 0-3 4,124 2.61 1.36 3,741 2.44 1.39 5.70 (7863)*** 0.12 0.24 .12
Alcohol frequency 0-3 4,137 1.52 1.20 3,755 2.11 1.30 −21.02 (7890)*** −0.65 -0.54 .47
Smoking 1-2 4,158 1.73 0.44 3,773 1.73 0.45 0.65 (7929) −0.01 0.03 .00
Body mass index 14-67 2,811 25.90 5.64 2,874 26.88 4.72 −7.11 (5683)*** −1.25 -0.71 .19 Circadian irregularity 6-36 4,150 15.14 6.72 3,763 15.64 6.90 −3.30 (7911)** −0.81 -0.21 .07 Social irregularity 4-24 2,937 14.31 5.08 2,576 13.83 4.86 3.57 (5511)*** 0.22 0.74 .10
Mental health
Life satisfaction 5-35 4,131 24.60 6.34 3,750 24.76 6.31 −1.12 (7879) −0.44 0.12 .03
Depression 0-21 4,121 3.41 4.12 3,736 3.15 4.00 2.88 (7855)** 0.08 0.44 .06
Anxiety 0-21 4,103 2.52 3.30 3,717 2.35 3.22 2.38 (7818)* 0.03 0.32 .05
Stress 0-21 4,121 5.54 4.47 3,738 4.98 4.18 5.65 (7857)*** 0.36 0.75 .13
Note. *p< .05; **p< .01; ***p< .001. a
Numbers vary due to missing data.
Table 3 Pearson correlation coefficients among lifestyle behaviours and mental health
1 2 3 4 5 6 7 8 9 10 11 12 13
1 Physical activity 1 .23*** .11*** -.05*** .13*** -.13*** -.09*** -.04*** -.21*** .21*** -.13*** -.10*** -.07***
2 Mental/cultural activity 1 .08*** .02* .06*** .01 -.02 -.05*** -.09*** .14*** -.13*** -.08*** -.08***
3 Alcohol frequency (linear) 1 .11*** -.04** -.04** -.07*** .03** -.07*** .08*** -.09*** -.10*** -.03**
4 Alcohol frequency (quadratic) 1 .00 .03* -.01 -.03** .08*** -.04*** .04** .05*** .02
5 Smoking (yes/no) 1 .02* -.02 -.14*** -.00 .11*** -.10*** -.06*** -.07***
6 Body mass index (linear) 1 .53*** .04** .08*** -.07*** .06*** .09*** .05***
7 Body mass index (quadratic) 1 .04** .05*** -.11*** .10*** .11*** .07***
8 Circadian irregularity 1 .19*** -.15*** .18*** .13*** .14***
9 Social irregularity 1 -.21*** .19*** .13*** .15***
10 Life satisfaction 1 -.56*** -.39*** -.42***
11 Depression 1 .75*** .70***
12 Anxiety 1 .64***
13 Stress 1
(R2= .06), depression (R2= .07), anxiety (R2= .04), and stress (R2= .04). Effect sizes for all predictor x outcome combinations were small.
Protective lifestyle behaviour (PLB) score and mental health
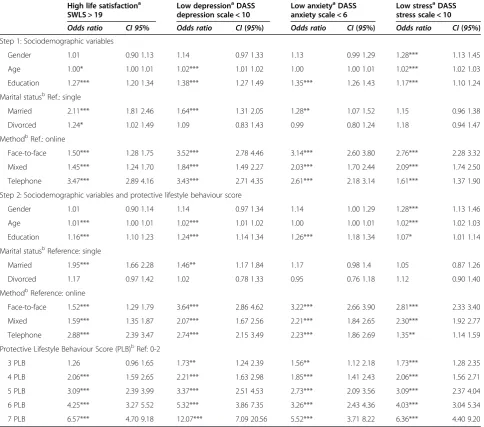
Participants varied in the number of their protective life-style behaviours. Only 0.1% exhibited no protective behav-iours, while 0.8% and 3.8% showed either one or two of such. Therefore, these participants were taken together for
the following analyses. A PLB score of three was obtained by 11.3%, a score of four by 20.2%, a score of five by 28.6%, a score of six by 24.3%, and a score of seven by 10.9% of the participants. Table 5 displays the results of the hierarchical logistic regression analyses of the pro-tective lifestyle behaviour scores on dichotomized mental health measures. Overall, the higher the PLB score, the higher the odds of being in the categories of low psychological distress and high life satisfaction. For ex-ample, odds ratios of being non-symptomatic in depression Table 4 Hierarchical multiple linear regression analyses predicting mental health from lifestyle behaviour variables
Life satisfaction Depression Anxiety Stress
ß CI(95%) ß CI(95%) ß CI(95%) ß CI(95%)
Step 1: Sociodemographic variables
Gender 0.01 −0.02 0.03 −0.03* −0.05 -0.01 −0.03* −0.05 -0.01 −0.07*** −0.09 -0.05
Age 0.02 −0.01 0.04 −0.07*** −0.10 -0.05 −0.01 −0.04 0.02 −0.14*** −0.17 -0.12
Education 0.12*** 0.10 0.15 −0.13*** −0.15 -0.10 −0.13*** −0.15 -0.10 −0.07*** −0.09 -0.04 Marital statusaReference: married
Divorced −0.15*** −0.17 -0.12 0.09*** 0.06 0.11 0.04*** 0.02 0.07 −0.01 −0.03 0.02
Single −0.15*** −0.17 -0.12 0.09*** 0.06 0.12 0.05*** 0.02 0.07 −0.01 −0.03 0.02
MethodaReference: online
Mixed 0.07*** 0.04 0.09 −0.09*** −0.11 -0.06 −0.10*** −0.13 -0.07 −0.05** −0.08 -0.02 Face-to-face 0.09*** 0.06 0.11 −0.19*** −0.22 -0.16 −0.21*** −0.24 -0.19 −0.17*** −0.20 -0.14 Telephone 0.27*** 0.25 0.30 −0.21*** −0.24 -0.18 −0.18*** −0.20 -0.15 −0.12*** −0.15 -0.10
R2 .10 .06 .04 .05
Step 2: Sociodemographic variables and lifestyle behaviours
Gender 0.01 −0.02 0.03 −0.03* −0.05 0.00 −0.02 −0.05 0.00 −0.08*** −0.10 -0.06
Age 0.02 −0.01 0.04 −0.06*** −0.08 -0.03 0.00 −0.03 0.03 −0.15*** −0.17 -0.12
Education 0.07*** 0.04 0.09 −0.07*** −0.10 -0.05 −0.08*** −0.11 -0.06 −0.03** −0.06 -0.01 Marital statusaReference: married
Divorced −0.13*** −0.15 -0.11 0.07*** 0.04 0.09 0.02 0.00 0.05 −0.02 −0.04 0.00
Single −0.14*** −0.17 -0.12 0.08*** 0.05 0.10 0.03* 0.01 0.06 −0.02 −0.04 0.01
MethodaReference: online
Mixed 0.10*** 0.07 0.12 −0.13*** −0.70 -3.00 −0.14*** −0.17 -0.11 −0.09*** −0.11 -0.06 Face-to-face 0.09*** 0.07 0.12 −0.20*** −0.11 -7.00 −0.22*** −0.25 -0.19 −0.18*** −0.21 -0.15 Telephone 0.23*** 0.20 0.25 −0.17*** −0.70 -3.00 −0.15*** −0.18 -0.12 −0.10*** −0.13 -0.07 Physical activity 0.10*** 0.07 0.12 −0.05*** −0.07 -0.02 −0.04* −0.06 -0.01 −0.02 −0.04 0.01 Mental/cultural activity 0.06*** 0.03 0.08 −0.09*** −0.11 -0.07 −0.07*** −0.09 -0.05 −0.07*** −0.10 -0.05 Alcohol frequency (linear) 0.04*** 0.02 0.06 −0.06*** −0.08 -0.03 −0.08*** −0.10 -0.05 0.01 −0.02 0.03 Alcohol frequency (quadratic) −0.05*** −0.07 -0.03 0.05*** 0.03 0.07 0.06*** 0.04 0.08 0.04*** 0.02 0.06 Smoking (yes/no) 0.06*** 0.03 0.08 −0.05*** −0.07 -0.03 −0.03* −0.05 0.00 −0.03** −0.06 -0.01 Body mass index (linear) −0.04** −0.07 -0.02 0.01 −0.01 0.04 0.03* 0.00 0.06 0.04* 0.00 0.07 Body mass index (quadratic) −0.01* −0.02 0.00 0.01** 0.01 0.02 0.02* 0.00 0.03 0.01 0.00 0.01 Circadian irregularity −0.08*** −0.10 -0.06 0.12*** 0.09 0.14 0.10*** 0.08 0.13 0.09*** 0.07 0.11 Social irregularity −0.15*** −0.17 -0.13 0.14*** 0.12 0.17 0.08*** 0.06 0.10 0.14*** 0.11 0.16
R2 .16 .13 .08 .09
Note. *p< .05; **p< .01; ***p< .001. a
were 2.21 (95% CI = 1.63 – 2.98) for individuals with 4 PLBs and 12.07 (95% CI = 7.09–20.56) for persons with 7 PLBs compared to the reference category (0 to 2 PLBs). In other words, the odds of reporting substantial symptoms of depression were about 12 times higher in individuals with 0 to 2 PLBs than in individuals with 7 PLBs. A similar pattern was found for the other outcome variables and is shown in Table 5.
Discussion
The primary objective of the present study was to evalu-ate the relationship between multiple everyday lifestyle behaviours and mental health in a large representative
community sample in Germany. Our analyses indicated that mental health is indeed associated with different lifestyle behaviours. Physical activity, mental/cultural ac-tivity, frequency of alcohol consumption, smoking, body mass index, circadian and social rhythms were all signifi-cantly associated with life satisfaction, depression, anxiety, and stress. The importance of physical exercise, moderate alcohol consumption, non-smoking and healthy body weight for mental health supported the findings from past research and extended them to the German adult popula-tion. Additionally, the independent contribution of mental/ cultural activities and regular life rhythm to mental health is particularly interesting, as findings until now have been
Table 5 Hierarchical multiple logistic regression analyses predicting mental health from protective lifestyle behaviour score
High life satisfactiona
SWLS > 19
Low depressionaDASS
depression scale < 10
Low anxietyaDASS
anxiety scale < 6
Low stressaDASS
stress scale < 10
Odds ratio CI 95% Odds ratio CI(95%) Odds ratio CI(95%) Odds ratio CI(95%) Step 1: Sociodemographic variables
Gender 1.01 0.90 1.13 1.14 0.97 1.33 1.13 0.99 1.29 1.28*** 1.13 1.45
Age 1.00* 1.00 1.01 1.02*** 1.01 1.02 1.00 1.00 1.01 1.02*** 1.02 1.03
Education 1.27*** 1.20 1.34 1.38*** 1.27 1.49 1.35*** 1.26 1.43 1.17*** 1.10 1.24
Marital statusbRef.: single
Married 2.11*** 1.81 2.46 1.64*** 1.31 2.05 1.28** 1.07 1.52 1.15 0.96 1.38
Divorced 1.24* 1.02 1.49 1.09 0.83 1.43 0.99 0.80 1.24 1.18 0.94 1.47
MethodbRef.: online
Face-to-face 1.50*** 1.28 1.75 3.52*** 2.78 4.46 3.14*** 2.60 3.80 2.76*** 2.28 3.32
Mixed 1.45*** 1.24 1.70 1.84*** 1.49 2.27 2.03*** 1.70 2.44 2.09*** 1.74 2.50
Telephone 3.47*** 2.89 4.16 3.43*** 2.71 4.35 2.61*** 2.18 3.14 1.61*** 1.37 1.90
Step 2: Sociodemographic variables and protective lifestyle behaviour score
Gender 1.01 0.90 1.14 1.14 0.97 1.34 1.14 1.00 1.29 1.28*** 1.13 1.46
Age 1.01*** 1.00 1.01 1.02*** 1.01 1.02 1.00 1.00 1.01 1.02*** 1.02 1.03
Education 1.16*** 1.10 1.23 1.24*** 1.14 1.34 1.26*** 1.18 1.34 1.07* 1.01 1.14
Marital statusbReference: single
Married 1.95*** 1.66 2.28 1.46** 1.17 1.84 1.17 0.98 1.4 1.05 0.87 1.26
Divorced 1.17 0.97 1.42 1.02 0.78 1.33 0.95 0.76 1.18 1.12 0.90 1.40
MethodbReference: online
Face-to-face 1.52*** 1.29 1.79 3.64*** 2.86 4.62 3.22*** 2.66 3.90 2.81*** 2.33 3.40
Mixed 1.59*** 1.35 1.87 2.07*** 1.67 2.56 2.21*** 1.84 2.65 2.30*** 1.92 2.77
Telephone 2.88*** 2.39 3.47 2.74*** 2.15 3.49 2.23*** 1.86 2.69 1.35** 1.14 1.59
Protective Lifestyle Behaviour Score (PLB)bRef: 0-2
3 PLB 1.26 0.96 1.65 1.73** 1.24 2.39 1.56** 1.12 2.18 1.73*** 1.28 2.35
4 PLB 2.06*** 1.59 2.65 2.21*** 1.63 2.98 1.85*** 1.41 2.43 2.06*** 1.56 2.71
5 PLB 3.09*** 2.39 3.99 3.37*** 2.51 4.53 2.73*** 2.09 3.56 3.09*** 2.37 4.04
6 PLB 4.25*** 3.27 5.52 5.32*** 3.86 7.35 3.26*** 2.43 4.36 4.03*** 3.04 5.34
7 PLB 6.57*** 4.70 9.18 12.07*** 7.09 20.56 5.52*** 3.71 8.22 6.36*** 4.40 9.20
Note. *p< .05; **p< .01; ***p< .001. a
Outcome variables were dichotomized in symptomatic and non-symptomatic categories according to literature. b
somewhat inconclusive regarding social rhythm and a spectrum of disorders other than bipolar depression. The present data complements the current state of research in this area (Cuypers et al. 2012).
Combining multiple lifestyle behaviours into one pro-tective lifestyle behaviour score indicated an additive rela-tionship between healthy behaviours and mental health. There was a strong trend of decreasing psychological dis-tress corresponding with an increasing number of protect-ive lifestyle behaviours. The more health promoting behaviours reported, the better the reported mental health outcomes were. These results were in line with previous research that utilized protective lifestyle scores and exam-ined their relation to depression (Harrington et al. 2010). The present study adds substantial information about the application of PLB scores not only as an important correl-ate of affective disorders, but also of anxiety and stress, as well as of life satisfaction, a positive facet of psychological wellbeing. Also in line with other large-scale surveys on different lifestyle factors and mental health outcomes, the proposed associations were mostly statistically significant, although the overall effect sizes were small (Herring et al. 2010; Molarius et al. 2009).
Another interesting finding concerns the meaningful associations between all four mental health outcomes and some sociodemographic factors. While age and gen-der were significant predictors of depression and stress, educational level showed significant associations with all outcomes and marital status was associated with life sat-isfaction, depression, and anxiety. Our analyses showed that higher education and being married were associated with better mental health as compared with lower edu-cation or being single or divorced. Effect sizes for these sociodemographic variables were comparable to effect sizes of the proposed lifestyle predictors. Meta-analytic results suggest that this is not an incidental finding, but reflects actual associations. An aggregation of 51 studies revealed that individuals with low socioeconomic status, often also operationalized through the level of education, had higher odds of being depressed (odds ratio = 1.18, p< .001) compared to persons with high socioeconomic status (Lorant et al. 2003). The association between mari-tal status and menmari-tal health has also been documented, with lower rates of anxiety and depression prevalent in married individuals compared or divorced/widowed persons (Afifi et al. 2006; Holt-Lunstad et al. 2008). Generalizability and external validity were assured via the utilization of a large population-based representative sample and validated measures for both lifestyle and men-tal health. The observed effect of data assessment methods on mental health outcomes might seem surprising, but it also reflects existing research. The substantial differences between different data assessment methods and mental health were not expected, but seem to be very relevant
not only as a limitation to our findings, but also as an important research question. The presented data def-initely suggests careful consideration of data assessment methods, as differences between online, telephone and face-to-face interviews were obvious, with online surveys resulting in higher reporting of psychological distress compared to personal or telephone interviews [unpub-lished data]. To this point, it is unclear if the higher levels of distress reported in self-administered surveys reflect an over reporting of symptoms by the participants, or indi-cate a greater openness to revealing substantial psycho-logical distress due to the higher perceived anonymity of the setting.
Limitations
Several methodological limitations that challenge in-ternal validity should be considered. First and foremost, the lack of longitudinal data is a shortcoming that pre-vents us from examining the proposed bidirectional rela-tionship between lifestyle and mental health. Additionally, the reliance of self-report and the lack of objective data might have led to more socially desirable responding. While circadian and life rhythms, life satisfaction, depres-sion, anxiety, and stress were assessed with carefully con-structed psychometric instruments, alcohol consumption, physical, cultural/mental activity, smoking and body mass index were each assessed with only one item each. Al-though these or similar items have been used in several previous studies (Milton et al. 2011), and have demon-strated sufficient reliability and validity, memory biases and socially desirable responding may have extra effects on these items.
Implications
reading books and more social, cultural activities, like go-ing to the movies or playgo-ing music in a band, is necessary to control for potential overlap between these constructs and to distinguish between rather creative or receptive ac-tivities (Cuypers et al. 2011).
Conclusion
Our findings support and supplement the existing litera-ture on lifestyle and mental health, indicating that life-style behaviours, including physical and mental activity, alcohol consumption, smoking, life rhythm and body mass index are individually predictive of life satisfaction, depression, anxiety, and stress. The number of healthy lifestyle choices also predicts lower psychological distress and greater life satisfaction. Healthy lifestyle behaviours seem to have an additive effect on mental health.
Competing interests
The authors declare that they have no competing interests.
Authors’contributions
All authors read and approved the final manuscript. JV was the lead author and undertook the statistical analyses with the collaboration of AHM and XCZ. KLL, SS and SSC supervised the paper and gave advice on paper structure and language editing. JM was the project director. He oversaw the data analyses, interpretation of the results and provided editorial contribution to this paper. All authors read and approved the final manuscript.
Acknowledgements
The current study was financially supported through the Alexander von Humboldt Professorship awarded to Prof. Dr. Jürgen Margraf by the Alexander von Humboldt-Foundation.
Author details
1Faculty of Psychology, Department of Clinical Psychology and
Psychotherapy, Mental Health Research and Treatment Center, Ruhr-Universität Bochum, Massenbergstrasse 9-13, D-44787 Bochum, Germany.2Department of Psychology, University of Basel, Basel, Switzerland.
Received: 14 August 2014 Accepted: 9 December 2014
References
Afifi, T, Cox, B, & Enns, M. (2006). Mental health profiles among married, never-married, and separated/divorced mothers in a nationally representative sample.Social Psychiatry and Psychiatric Epidemiology, 41(2), 122–129. Becker, ES, Margraf, J, Turke, V, Soeder, U, & Neumer, S. (2001). Obesity and
mental illness in a representative sample of young women.International Journal of Obesity & Related Metabolic Disorders, 25, 5–9.
Bygren, LO, Konlaan, BB, & Johansson, SE. (1996). Attendance at cultural events, reading books or periodicals, and making music or singing in a choir as determinants for survival: Swedish interview survey of living conditions.
BMJ: British Medical Journal, 313(7072), 1577–1580.
Bygren, LO, Weissglas, G, Wikström, BM, Konlaan, BB, Grjibovski, A, Karlsson, AB, Andersson, SO, & Sjöström, M. (2009). Cultural participation and health: a randomized controlled trial among medical care staff.Psychosomatic Medicine, 71(4), 469–473.
Chaney, EH, Chaney, JD, Wang, MQ, & Eddy, JM. (2007). Lifestyle behaviors and mental health of American adults.Psychological Reports, 100(1), 294–302. Conry, MC, Morgan, K, Curry, P, McGee, H, Harrington, J, Ward, M, & Shelley, E.
(2011). The clustering of health behaviours in Ireland and their relationship with mental health, self-rated health and quality of life.BMC Public Health, 11(1), 692.
Cuypers, K, Knudtsen, MS, Sandgren, M, Krokstad, S, Wikström, BM, & Theorell, T. (2011). Cultural activities and public health: research in Norway and Sweden. An overview.Arts & Health, 3(01), 6–26.
Cuypers, K, Krokstad, S, Lingaas Holmen, T, Skjei Knudtsen, M, Bygren, LO, & Holmen, J. (2012). Patterns of receptive and creative cultural activities and their association with perceived health, anxiety, depression and satisfaction with life among adults: the HUNT study, Norway.Journal of Epidemiology & Community Health, 66(8), 698–703.
Diener, E, Emmons, RA, Larsen, RJ, & Griffin, S. (1985). The satisfaction with life scale.Journal of Personality Assessment, 49(1), 71–75.
Fogelholm, M. (2010). Physical activity, fitness and fatness: relations to mortality, morbidity and disease risk factors. A systematic review.Obesity Reviews, 11(3), 202–221.
Gmel, G, & Rehm, J. (2004). Measuring alcohol consumption.Contemporary Drug Problems, 31, 467.
Gorber, SC, Tremblay, M, Moher, D, & Gorber, B. (2007). A comparison of direct vs. self-report measures for assessing height, weight and body mass index: a systematic review.Obesity Reviews, 8(4), 307–326.
Grandin, LD, Alloy, LB, & Abramson, LY. (2006). The social zeitgeber theory, circadian rhythms, and mood disorders: review and evaluation.Clinical Psychology Review, 26(6), 679–694.
Hamer, M, Stamatakis, E, & Steptoe, A. (2009). Dose–response relationship between physical activity and mental health: the Scottish Health Survey.
British Journal of Sports Medicine, 43(14), 1111–1114.
Harrington, J, Perry, IJ, Lutomski, J, Fitzgerald, AP, Shiely, F, McGee, H, Barry, MM, van Lente, E, Morgan, K, & Shelley, E. (2010). Living longer and feeling better: healthy lifestyle, self-rated health, obesity and depression in Ireland.The European Journal of Public Health, 20(1), 91–95.
Harriss, DJ, Atkinson, G, Batterham, A, George, K, Tim Cable, N, Reilly, T, Haboubi, N, & Renehan, AG. (2009a). Lifestyle factors and colorectal cancer risk (2): a systematic review and meta-analysis of associations with leisure-time physical activity.
Colorectal Disease, 11(7), 689–701.
Harriss, DJ, Atkinson, G, George, K, Tim Cable, N, Reilly, T, Haboubi, N, Zwahlen, M, Egger, M, & Renehan, AG. (2009b). Lifestyle factors and colorectal cancer risk (1): systematic review and meta-analysis of associations with body mass index.Colorectal Disease, 11(6), 547–563.
He, FJ, Nowson, CA, & MacGregor, GA. (2006). Fruit and vegetable consumption and stroke: meta-analysis of cohort studies.The Lancet, 367(9507), 320–326. Headey, B, Muffels, R, & Wagner, GG. (2013). Choices which change life
satisfaction: similar results for Australia, Britain and Germany.Social Indicators Research, 112(3), 725–748.
Henry, JD, & Crawford, JR. (2005). The short-form version of the Depression Anxiety Stress Scales (DASS-21): construct validity and normative data in a large non-clinical sample.British Journal of Clinical Psychology, 44(2), 227–239. Herring, MP, O’Connor, PJ, & Dishman, RK. (2010). The effect of exercise training
on anxiety symptoms among patients: a systematic review.Archives of Internal Medicine, 170(4), 321–331.
Herrman, H, Saxena, S, & Moodie, R (Eds.). (2005).Promoting Mental Health: Concepts, Emerging Evidence, Practice. Geneva, Switzerland: World Health Organization.
Holt-Lunstad, J, Birmingham, W, & Jones, B. (2008). Is there something unique about marriage? The relative Impact of marital status, relationship quality, and network social support on ambulatory blood pressure and mental health.Annals of Behavioral Medicine, 35(2), 239–244.
Jagannath, A, Peirson, SN, & Foster, RG. (2013). Sleep and circadian rhythm disruption in neuropsychiatric illness.Current Opinion in Neurobiology, 23(5), 888–894.
Jonsdottir, IH, Rödjer, L, Hadzibajramovic, E, Börjesson, M, & Ahlborg, G. (2010). A prospective study of leisure-time physical activity and mental health in Swedish health care workers and social insurance officers.Preventive Medicine, 51(5), 373–377.
Kelly, SJ, Daniel, M, Dal Grande, E, & Taylor, A. (2011). Mental ill-health across the continuum of body mass index.BMC Public Health, 11(1), 765.
Khaw, KT, Wareham, N, Bingham, S, Welch, A, Luben, R, & Day, N. (2008). Combined impact of health behaviours and mortality in men and women: the EPIC-Norfolk prospective population study.PLoS Medicine, 5(1), e70.
Kinnunen, T, Haukkala, A, Korhonen, T, Quiles, ZN, Spiro, A, & Garvey, AJ. (2006). Depression and smoking across 25 years of the Normative Aging Study.The International Journal of Psychiatry in Medicine, 36(4), 413–426.
Lieverse, R, de Vries, R, Hoogendoorn, AW, Smit, JH, & Hoogendijk, WJG. (2013). Social support and social rhythm regularity in elderly patients with major depressive disorder.The American Journal of Geriatric Psychiatry, 21(11), 1144– 1153.
Lorant, V, Deliège, D, Eaton, W, Robert, A, Philippot, P, & Ansseau, M. (2003). Socioeconomic inequalities in depression: a meta-analysis.American Journal of Epidemiology, 157(2), 98–112.
Lovibond, PF, & Lovibond, SH. (1995). The structure of negative emotional states: comparison of the Depression Anxiety Stress Scales (DASS) with the Beck Depression and Anxiety Inventories.Behaviour Research and Therapy, 33(3), 335–343.
Mammen, G, & Faulkner, G. (2013). Physical activity and the prevention of depression: a systematic review of prospective studies.American Journal of Preventive Medicine, 45(5), 649–657.
McClung, CA. (2007). Circadian genes, rhythms and the biology of mood disorders.Pharmacology & Therapeutics, 114(2), 222–232.
McClung, CA. (2013). How might circadian rhythms control mood? Let me count the ways.Biological Psychiatry, 74(4), 242–249.
Milton, K, Bull, FC, & Bauman, A. (2011). Reliability and validity testing of a single-item physical activity measure.British Journal of Sports Medicine, 45(3), 203–208. Molarius, A, Berglund, K, Eriksson, C, Eriksson, HG, Linden-Bostrom, M, Nordstrom,
E, Persson, C, Sahlqvist, L, Starrin, B, & Ydreborg, B. (2009). Mental health symptoms in relation to socio-economic conditions and lifestyle factors–a population-based study in Sweden.BMC Public Health, 9(1), 302. Monk, TH, Kupfer, DJ, Frank, E, & Ritenour, AM. (1991). The social rhythm metric
(SRM): measuring daily social rhythms over 12 weeks.Psychiatry Research, 36, 195–207.
Myers, E, Startup, H, & Freeman, D. (2011). Cognitive behavioural treatment of insomnia in individuals with persistent persecutory delusions: a pilot trial.
Journal of Behavior Therapy and Experimental Psychiatry, 42(3), 330–336. Myint PK, Luben RN, Wareham NJ, Bingham SA, Khaw KT. (2009) Combined effect
of health behaviours and risk of first ever stroke in 20 040 men and women over 11 years’follow-up in Norfolk cohort of European Prospective Investigation of Cancer (EPIC Norfolk): prospective population study.BMJ: British Medical Journal,338, b349
Olesen, J, Gustavsson, A, Svensson, M, Wittchen, HU, & Jönsson, B. (2012). The economic cost of brain disorders in Europe.European Journal of Neurology. 19(1), 155–162.
Pavot, W, & Diener, E. (2008). The satisfaction with life scale and the emerging construct of life satisfaction.The Journal of Positive Psychology, 3(2), 137–152. Rodgers, B, Korten, AE, Jorm, AF, Christensen, H, Henderson, S, & Jacomb, PA.
(2000). Risk factors for depression and anxiety in abstainers, moderate drinkers and heavy drinkers.Addiction, 95(12), 1833–1845.
Rohrer, JE, Rush Pierce, J, & Blackburn, C. (2005). Lifestyle and mental health.
Preventive Medicine, 40(4), 438–443.
Ronksley PE, Brien SE, Turner BJ, Mukamal KJ, Ghali WA. (2011) Association of alcohol consumption with selected cardiovascular disease outcomes: a systematic review and meta-analysis.BMJ: British Medical Journal.342, d671 Sattelmair, J, Pertman, J, Ding, EL, Kohl, HW, Haskell, W, & Lee, IM. (2011). Dose
response between physical activity and risk of coronary heart disease a meta-analysis.Circulation, 124(7), 789–795.
Scarborough, P, Nnoaham, KE, Clarke, D, Capewell, S, & Rayner, M. (2012). Modelling the impact of a healthy diet on cardiovascular disease and cancer mortality.Journal of Epidemiology & Community Health, 66, 420–426. Schane, RE, Ling, PM, & Glantz, SA. (2010). Health effects of light and intermittent
smoking a review.Circulation, 121(13), 1518–1522.
Scott, KM, Bruffaerts, R, Simon, GE, Alonso, J, Angermeyer, M, de Girolamo, G, Demyttenaere, K, Gasquet, I, Haro, JM, Karam, E, Kessler, RC, Levinson, D, Medina Mora, ME, Oakley Browne, MA, Ormel, J, Villa, JP, Uda, H, & Von Korff, M. (2008). Obesity and mental disorders in the general population: results from the world mental health surveys.International Journal of Obesity, 32(1), 192–200.
Shea, TL, Tennant, A, & Pallant, JF. (2009). Rasch model analysis of the Depression, Anxiety and Stress Scales (DASS).BMC Psychiatry, 9(1), 21.
Wittchen, HU, Jacobi, F, Rehm, J, Gustavsson, A, Svensson, M, Jönsson, B, Olesen, J, Allgulander, C, Alonso, J, Faravelli, C, Fratiglioni, L, Jennum, P, Lieb, R, Maercker, A, van Os, J, Preisig, M, Salvador-Carulla, L, Simon, R,
& Steinhausen, HC. (2011). The size and burden of mental disorders and other disorders of the brain in Europe 2010.European Neuropsychopharmacology, 21(9), 655–679.
Xu, Q, Anderson, D, & Courtney, M. (2010). A longitudinal study of the relationship between lifestyle and mental health among midlife and older women in Australia: findings from the healthy aging of women study.Health Care for Women International, 31(12), 1082–1096.
Submit your next manuscript to BioMed Central and take full advantage of:
• Convenient online submission
• Thorough peer review
• No space constraints or color figure charges
• Immediate publication on acceptance
• Inclusion in PubMed, CAS, Scopus and Google Scholar
• Research which is freely available for redistribution