R E S E A R C H
Open Access
Albayzín-2014 evaluation: audio
segmentation and classification in broadcast
news domains
Diego Castán
1*, David Tavarez
2, Paula Lopez-Otero
3, Javier Franco-Pedroso
4, Héctor Delgado
5,
Eva Navas
2, Laura Docio-Fernández
3, Daniel Ramos
4, Javier Serrano
5, Alfonso Ortega
1and Eduardo Lleida
1Abstract
Audio segmentation is important as a pre-processing task to improve the performance of many speech technology tasks and, therefore, it has an undoubted research interest. This paper describes the database, the metric, the systems and the results for the Albayzín-2014 audio segmentation campaign. In contrast to previous evaluations where the task was the segmentation of non-overlapping classes, Albayzín-2014 evaluation proposes the delimitation of the presence of speech, music and/or noise that can be found simultaneously. The database used in the evaluation was created by fusing different media and noises in order to increase the difficulty of the task. Seven segmentation systems from four different research groups were evaluated and combined. Their experimental results were analyzed and compared with the aim of providing a benchmark and showing up the promising directions in this field.
Keywords: Audio segmentation, Broadcast news, Albayzín-2014 evaluation
1 Introduction
Automatic audio segmentation aims at providing bound-aries to delimit portions of audio with homogeneous acoustic content. The resulting segments are classified in different acoustic types according to the final applica-tion, such as different speakers, languages, speech/non-speech portions, or acoustic events among others. In most cases, automatic audio segmentation is considered a pre-processing tool to improve the performance of the subsequent system related with speech technologies. For example, in very large multimedia repositories, the speech is usually found along with music or environmental noise. The presence of these acoustic classes must be accu-rately labeled because it is critical for the subsequent sys-tems to be successful. Thus, the development of accurate Audio Segmentation Systems is essential to allow post-processing systems, such as automatic speech recognition (ASR) or spoken document retrieval (SDR), to perform adequately in real-world environments.
*Correspondence: dcastan@unizar.es
1ViVoLab, Universidad de Zaragoza, Zaragoza, Spain
Full list of author information is available at the end of the article
Audio segmentation systems can address the problem in different fields or contexts. In the first works of automatic segmentation, the goal was the challenging segmentation of sports material and commercials. The studies focused on speech/music segmentation from radio stations as in [1] and [2] showing the importance of the audio seg-mentation to improve ASR systems. The following studies dealt with the recognition of broad classes to produce an adaptation of the ASR models. For example, Srinivasan [3] classified the audio of a video into mixed classes such as music with speech or speech with background noise using a combination of acoustic and perceptual features. Nowa-days, most of the studies focus on the robust and generic segmentation of broad classes [4] and the segmentation of acoustic events [5] for audio retrieval in large multimedia databases.
A specific task with large multimedia databases is the segmentation of broadcast news (BN) recordings. This task is very challenging because the audio contains differ-ent kinds of sequences with a very heterogeneous style. Several international evaluation campaigns, such as the TREC NIST evaluations for SDR [6], the ESTER eval-uation campaigns for rich transcription (RT) in French [7], and the COST278 evaluation for segmentation and
speaker clustering in a multi-lingual domain [8], have already been proposed to face this task in the past.
Nowadays, the amount of audio documents is expo-nentially increasing due to the audio-sharing websites or the audio-on-demand systems. Users around the world can upload and share their contents and, for that rea-son, the variability of the acoustic conditions is extremely high. As a result, systems must be able to adapt their role in high-variability data spaces, providing robust perfor-mance in different conditions. Due to the importance of audio segmentation and the need to develop robust sys-tems capable of operating over a rich variety of audio conditions, the Albayzín-2014 campaign was proposed as an international evaluation to measure the performance of segmentation systems for different databases and different contexts. This segmentation evaluation, which is part of an open set of evaluations organized by the RTTH1every 2 years, compares systems and approaches from different research institutions in an independent way.
In contrast to previous evaluations such as Albayzín-2010 [9], where five unambiguous acoustic classes were defined, the Albayzín-2014 evaluation proposed the delimitation of the presence of speech, music and/or noise that can be found simultaneously. Another relevant dif-ference was the composition of the database: while in previous evaluations the databases were composed of a unique BN media (TV in Albayzín-2010 mostly in Catalan [9] or radio in Albayzín-2012 [10] mostly in Spanish), the Albayzín-2014 database was a combination and fusion of three different databases with TV, radio, and noise record-ings. This composition increased the difficulty of the task since the resulting database introduced more variability, presenting more realistic conditions over a wide variety of acoustic sources.
The remainder of the paper is organized as follows: the database and the metric used for Albayzín-2014 segmen-tation evaluation are presented in Section 2. Section 3 briefly describes the submitted systems. The results of the evaluation and the fusion of the systems are presented and discussed in Section 4. Finally, the summary and the conclusions are presented in Section 5.
2 Database and evaluation metric
The proposed evaluation consisted of segmenting a broadcast audio document and assigning labels for each segment indicating the presence of speech, music, and/or noise. That is, two or more classes could be found simul-taneously in audio segments and the goal was to indicate if one, two, or the three aforementioned classes were present for a given time instant. For example, music could be overlapped with speech, or noise could be found in the background when someone was speaking. Therefore, the presence of these three classes involve the definition of eight non-overlapping classes: silence, speech, music,
noise, speech with music, speech with noise, music with noise, and speech with music and noise. In this evaluation, Speech was present every time that a person was speaking but not in the background or singing. Music was under-stood in a general sense and noise was considered every time some acoustic content was present different than speech and music (including speech in the background, which usually comes from a crowd).
The goal was to segment and label audio docu-ments indicating where speech, music, and/or noise were present. Unlike 2010 evaluation criteria [9], no prior classes were defined (speech, music, speech with noise in background, speech with music in background, other) and a multiple layer labeling approach was proposed instead. In summary, the goal was to segment the incom-ing audio into three (possibly overlapped) acoustic classes: speech, music, and noise, where the audio was drawn from different databases that have been merged or even over-lapped, thus dramatically increasing the difficulty of the task with regard to previous evaluations.
2.1 Database
The database for this evaluation is a combination of three databases defined below:
The first dataset is the Catalan broadcast news database from the 3/24 TV channel proposed for the Albayzín-2010 Audio Segmentation Evaluation [9]. This database was recorded by the TALP Research Center of the Polytech-nic University of Catalonia in 2009 under the Tecnoparla project [11] funded by the Government of Catalonia. The Corporació Catalana de Mitjans Audiovisuals (CCMA), owner of the multimedia content, allows its use for tech-nology research and development. The database consists of around 87 h of recordings in which speech can be found 92 % of the time, music is present 20 % of the time, and noise in the background is present 40 % of the time. Another class calledotherswas defined which can be found 3 % of the time. Regarding the overlapped classes, speech can be found along with noise 40 % of the time and along with music 15 % of the time.
The second dataset is the Aragón Radio database from the Corporación Aragonesa de Radio y Televisión (CARTV) which was used for the Albayzín-2012 Audio Segmentation Evaluation [10]. As the owner of the audio content, Aragón Radio and the Corporación Aragonesa de Radio y Televisión allow the use of these data for research purposes.
The last dataset is composed of environmental sounds from Freesound.org [12] and HuCorpus [13]. These sounds were merged with segments from the 3/24 TV and Aragón Radio databases.
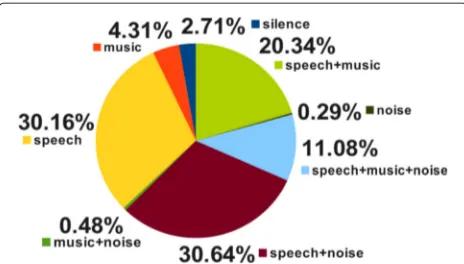
Fig. 1Distribution of the different audio classes in the training set of the Albayzín-2014 evaluation
were used for the training set and 15 h were used for the test set. The distribution of the audio classes in the train-ing set is presented in Fig. 1. The chart shows that the classes containing speech represent more than 92 % of the total time. There are two residual classes, isolated noise and music with noise, that represent less than 0.5 and 0.3 % of the total time, respectively.
2.2 Evaluation metric
As in the NIST RT Diarization evaluations [14], the seg-mentation error score (SER) was used to measure the performance of the proposed systems. SER is computed as the fraction of class time that is not correctly attributed to that specific class (speech, noise, or music). The SER score was computed over the entire file to be processed, including regions where more than one class was present (overlap regions).
The overall SER score is defined as the ratio of the over-all segmentation error time to the sum of the durations of the segments that are assigned to each class in the file.
Given the dataset to evaluate , each document is divided into contiguous segments at all “class change points” which occur each time any reference class (oracle) or system class (hypothesis) starts or ends. Thus, the set of active reference classes and/or system classes does not change during any segment. The segmentation error time for each segmentnis defined as
E(n)=T(n)maxNref(n),Nsys(n)
−NCorrect(n)
(1)
where T(n) is the duration of segment n, Nref(n) is the number of reference classes that are present in segmentn, Nsys(n)is the number of system classes that are present in segmentn, andNCorrect(n)is the number of reference classes in segmentncorrectly assigned by the segmenta-tion system.
SER=
n∈
E(n)
n∈
(T(n)Nref(n))
(2)
The segmentation error time includes the amount of time that is assigned to the wrong class, missed class time, and false alarm class time:
• Class error time: The class error time is the amount of time that has been assigned to an incorrect class. This error can occur in segments where the number of system classes is greater than the number of reference classes but also in segments where the number of system classes is lower than the number of reference classes whenever the number of system classes and the number of reference classes are greater than zero.
• Missed class time: The missed class time refers to the amount of time that a class is present but not labeled by the segmentation system in segments where the number of system classes is lower than the number of reference classes.
• False alarm class time: The false alarm class time is the amount of time that a class has been labeled by the segmentation system but is not present in segments where the number of system classes is greater than the number of reference classes.
The forgiveness collar defines a no-score area around reference segment boundaries. Typically, the collar is 250 ms for speaker diarization tasks [14] and 1 s for segmenta-tion tasks [9]. A forgiveness collar of 1 s, before and after each reference boundary, was considered in order to take into account both inconsistent human annotations and the uncertainty about when a class begins or ends. This collar is enough for the purpose of this segmentation task where the goal is to identify the areas with speech and their background to allow the adaptation of models for other systems as ASR. The implementation of the collar was provided by scoring tool of the NIST RT Diarization evaluations [14].
3 Segmentation systems
3.1 General description of audio segmentation systems The general scheme of an audio segmentation system can be divided into two basic steps: the feature extrac-tion method and the segmentaextrac-tion/classificaextrac-tion strategy. Lavner in [15] and more recently Theodorou in [16] pro-vide good reviews of the features and the classification methods used in the literature.
10 and 30 ms) and are commonly used in speech-related tasks where the signal can be considered stationary over that frame.Mel Frequency Cepstrum Coefficients(MFCC) orPerceptual Linear Prediction(PLP) coefficients are gen-erally used asframe-basedfeatures as proposed in [17–22] among a great collection of works.Frame-basedfeatures have also been proposed for segmenting and classifying BN audio into broad classes. As an example, two pitch-density-based features are proposed in [23], the authors use short-time energy(STE) in [1, 24, 25], andharmonic featuresare used in [26–28]. Theframe-basedfeatures can be directly used in the classifier. However, some classes are better described by the statistics computed over longer periods of time (from 0.5 to 5 s long). These characteris-tics are referred in the literature assegment-basedfeatures [29, 30]. For example, in [31], a content-based speech dis-crimination algorithm is designed to exploit the long-term information inherent in the modulation spectrum; and in [32], authors propose two segment-based features: the variance of the spectrum flux(VSF) and thevariance of the zero crossing rate(VZCR).
Once the feature vectors are computed, the next step deals with the detection and the classification of the segments. The segmentation/classification strategies can be divided into two different groups depending on how the segmentation is performed. The first group detects the break-points in a first step and then classifies each delimited segment in a second step. We refer to them as segmentation-and-classification approaches but they are also known in the literature as distance-based tech-niques. These algorithms have the advantage that they do not need labels to delimit the segments because the segmentation is based on a distance metric estimated for adjacent segments. When the distance between two adjacent segments is greater than a certain threshold, a break-point is set and identified as an acoustic change-point. The resulting segments are clustered or classified in a second stage. TheBayesian Information Criterion(BIC) is a well-known distance-based algorithm. It is widely employed in many studies, such as [33], to generate a break-point for every speaker or environment/channel condition change in the BN domain and also, in [34] and [35], to identify mixed-language speech and speaker changes, respectively. The second group of segmenta-tion/classification strategies is known as segmentation-by-classification or model-based segmentation. In contrast to the segmentation-and-classification algorithms, these algorithms classify consecutive fixed-length audio seg-ments and, therefore, segment labels are required in a training step because each class of interest is described by a model. The segmentation is produced directly by the classifier as a sequence of decisions. This sequence is usually smoothed to improve the segmentation per-formance, since the classification of frames produces
some spurious labels because adjacent frames are poorly considered.
A good and common approach to this procedure can be found in [36] where the author combines different features with a Gaussian Mixture Model (GMM) and a maximum entropy classifier. In [37], the authors use a factor analysis approach to adapt a universal GMM model to classify BN in five different classes. The final decisions of both sys-tems are smoothed with a Hidden Markov Model (HMM) to avoid sudden changes.
Both segmentation/classification strategies were used by participants in the Albayzín-2014 Audio Segmen-tation Evaluation: three participating groups chose segmentation-by-classification algorithms with different model strategies and one participating group chose a segmentation-and-classification algorithm based on BIC for the first stage and on different classification systems for the second stage. A brief description of the features and the systems is given below.
3.2 Description of the participating systems
Four research groups participated in this evaluation with seven different systems: Aholab-EHU/UPV (University of the Basque Country), GTM-UVigo (University of Vigo), ATVS-UAM (Autonomous University of Madrid), and CAIAC-UAB (Autonomous University of Barcelona). Each participant had 3 months to design the segmentation system with the training data. After that time, participants were given 1 month to process the test data. The partici-pants had to submit their results with hard-segmentation labels (in RTTM format from NIST) along with a techni-cal description of the submitted systems. All participant teams had to submit at least a primary system but they could also submit up to two contrastive systems. Also, for fusion purposes, participants were required to sub-mit the frame-level scores for each non-overlapping audio class. Groups are listed in the order in which their primary systems were ranked in the evaluation. A more detailed description of the systems can be found in theAdvances in Speech and Language Technologies for Iberian Languages proceedings [38].
3.2.1 Group 1
This group presented a single primary system where two different segmentation-by-classification strategies were fused to build a robust system.
The second strategy consisted of a GMM presegmen-tation and a speech label refinement by means of i-vector classification via multilayer perceptron (MLP). Six GMMs with 32 components for silence, music, noise, clean speech, speech with noise, and speech with music were used in a Viterbi segmentation. Twelve MFCCs with first- and second-order derivatives were used for the clas-sification (the energy-related coefficient was not used in this case). Once the speech segments were identi-fied, the i-vector extraction process was carried out. A sliding window was used to extract the i-vectors corre-sponding to each speech segment. Then, an MLP was used to classify each i-vector as clean speech, speech with noise, speech with music, or speech with music and with noise.
The outputs of both subsystems were post-processed to discard too short segments. Finally, a label fusion algo-rithm based on the confusion matrices of the systems involved in the fusion was applied to combine the results of both subsystems and maximize the precision of the final labels.
3.2.2 Group 2
Group 2 presented a primary system and two con-trastive systems, all of them with a segmentation-and-classificationstrategy.
The segmentation stage was common for all the systems and consisted of a Bayesian Information Criterion (BIC) approach using 12 MFCCs plus energy and featuring a false alarm rejection strategy: the occurrence of acoustic change-points was supposed to follow a Poisson process, and a change-point was discarded with a probability that varied in function of the expected number of occurrences in the time interval going from the previous change-point to the candidate change-point.
The classification stage was different for each system. The primary system was developed using i-vector rep-resentations of the segments obtained from the previous step with logistic regression classification. Perceptual lin-ear prediction (PLP) analysis was used to extract 13 cep-stral coefficients, which were combined with two pitch features and augmented with their delta features.
The classification in contrastive system 1 consisted of a Gaussian mean supervector representation of the seg-ments obtained from the previous step through the adap-tation of a Universal Background Model (UBM) with 256 components. Classification was performed employing a support vector machine (SVM) with a linear kernel. The feature vectors used in this classifier were 12 MFCCs plus energy as in the segmentation stage, augmented with their delta and delta-delta coefficients.
The contrastive system 2 used a classic GMM maximum likelihood classification with 512 components performed by doing MAP adaptation of a UBM with full-covariance
matrices. The set of features was the same that was used in the primary system.
3.2.3 Group 3
Group 3 presented a single primary system based on three independent GMM-UBM detectors of broad acous-tic classes (speech, music, and noise in every possible context) with asegmentation-by-classificationstrategy.
The system was based on MFCC feature vectors including shifted delta coefficients to capture the time dependency structure of the audio. Acoustic classes were modeled through 1024-component MAP-adapted GMMs. Each detector performed a frame-by-frame scoring obtaining one log likelihood stream per acous-tic class. These score-streams were smoothed through an average filter over a sliding window in order to deal with the high variability of frame scores. Finally, the smoothed frame-level scores were independently cali-brated for each acoustic class by means of linear logistic regression.
3.2.4 Group 4
Group 4 presented a primary system and a contrastive system with asegmentation-by-classificationstrategy for both of them.
The proposed system was based on a “binary key” (BK) modeling approach originally designed for speaker recog-nition [39] and later applied successfully in a speech activ-ity detection task [40]. The approach provided a compact representation of a class model through a binary vector (vector only containing zeros and ones) by transform-ing the continuous acoustic space into a discrete binary one. This transformation was done by means of a UBM-like model called Binary Key Background Model (KBM). Once the binary representation of the input audio was obtained, subsequent operations were performed in the binary domain, and calculations mainly involve bit-wise operations between pairs of binary keys. Segment assign-ment was done by comparing each segassign-ment BK with the N BKs (previously estimated using the KBM and training data) for each of the N target audio classes. Two alterna-tives to compute the similarity between two binary keys were proposed, one for the primary system and other for the contrastive system, respectively.
4 Experimental results
This section presents and analyzes the results of the Albayzín-2014 Audio Segmentation Evaluation for all the primary and contrastive systems of each group.
Table 1Segmentation error rate of participating systems
Primary Contrastive 1 Contrastive 2
Group 1 20.68 -
-Group 2 20.80 29.13 22.52
Group 3 30.67 -
-Group 4 31.59 33.93
-systems obtained very similar performance even though the systems represent very different strategies to per-form the segmentation: the primary system of group 1 is based on a fusion of two segmentation-by-classification approaches while the primary system of group 2 is based on asegmentation-and-classification approach. The pri-mary systems of group 3 and group 4 also show similar performance (around 31 %), but they are far from the pri-mary systems of groups 1 and 2. It is apparent that, for all groups, the primary systems outperform the contrastive systems, indicating that the choice of the main strategy of each group was done properly.
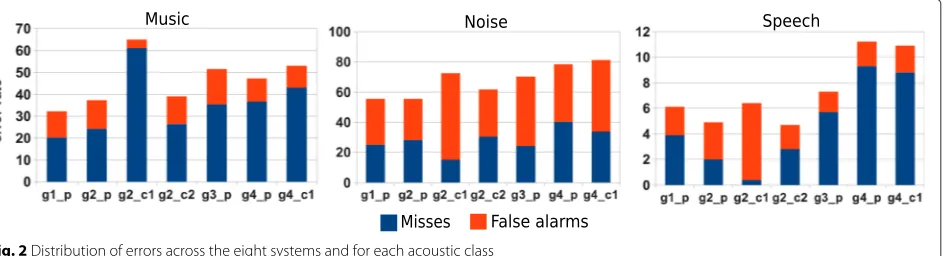
Figure 2 compares the misses (blue columns) and the false alarms (orange columns) of the participating systems for the overlapped acoustic classes individually (music, noise, and speech). Each system is represented by agX_Y notation whereX indicates the group index andY indi-cates if the system is primary (p) or contrastive (c). The main source of the segmentation error comes from the noise detection, but the music detection also presents a considerably high error rate. This is because the music and noise classes are rarely presented alone but instead mixed with speech. Also, the lack of data for these iso-lated classes makes very difficult to train suitable models to detect them. Note that the two best systems (the pri-mary systems of group 1 and group 2) have almost the same error rate coming from the detection of the noise class and both are much lower than those of the rest of the systems. The main difference between the systems sub-mitted by groups 1 and 2 is that the former detects the music class better than the latter while the latter detects the speech classes slightly better than the former.
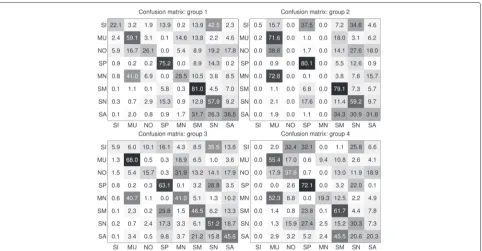
To accurately analyze the source of the errors, Fig. 3 presents the confusion matrices of the primary systems. The matrices show the percentage of the reference classes (rows) associated to hypothesized non-overlapping acous-tic classes (columns). The classes are represented as SI for “silence,” MU for “music,” NO for “noise,” SP for “speech,” MN for “music+noise,” SM for “speech+music,” SN for “speech+noise,” and SA for “speech+music+noise.” The matrices clearly show that the most common errors are the confusions between “speech+music+noise” with “speech+noise” or “speech+music” and also between “speech+noise” and “speech.” In addition, there is a com-mon error in all the systems with “music+noise” being classified as “music.” Note that the systems of group 2 and group 4 incur in a non-negligible error rate coming from the detection of the “silence” class since these sys-tems do not implement a silence detector and, therefore, false alarms are produced.
A fusion of different systems usually improves the final result because the information comes from various sources [41]. For that purpose, the participants provided frame-level scores for each non-overlapping audio class for the training and test datasets. Table 2 shows the seg-mentation error rate when the scores of the primary systems are combined. The fusion was done with different combinations of the primary systems: group 1 and group 2 in the first row of the table; groups 1, 2, and 3 in the second row; group 1, 2, and 4 in the third row; and a combina-tion of all the systems in the fourth row of the table. We used a set of techniques to combine the scores. Firstly, one Gaussian distribution is estimated with class-dependent full covariance and mean with maximum likelihood on the training data for each class. This technique is known as Gaussian Back-End (GBE) and the results are shown in the first column of the table. We trained the fusion model with the scores computed over the training dataset, and we used the test dataset to compute the SER. To smooth the decisions, a Viterbi algorithm was chosen to deter-mine the maximum likelihood transitions among classes. The segments are delimited by the transitions given by the Viterbi algorithm (second column of Table 2). On the
Fig. 3Confusion matrices of the primary systems for the non-overlapped classes: SI (silence), MU (music), NO (Noise), SP (speech), MN (music and noise), SM (speech with music), SN (speech with noise), and SA (speech with music and noise)
other hand, we used the segments provided by the group 2 since the approach of this group is based on a previous unsupervised segmentation stage with BIC. In this case, we accumulated the log likelihood of each frame within the same segment, which was given the label of the class with the highest accumulated log likelihood. The results of this approach can be seen in the third column of the table. The best performance was attained when fusing the primary systems of groups 1, 2, and 3. Finally, the last col-umn of the table gives us an idea about the performance of the fusion if the segmentation was perfect. It clearly shows a degradation between 4 and 5 % in the segmenta-tion stage with regard to the oracle segmentasegmenta-tion, because occasionally the delimitation boundaries among segments may be fuzzy. However, the fusion reduces the segmenta-tion error rate for all the approaches compared with the winning primary system.
Table 2Segmentation error rate of several score-level fusions of the primary systems. The result of the system G1 is 20.68 for comparison purposes
GBE GBE GBE GBE
Viterbi AccumLLkGTM Seg. Oracle Seg.AccumLLk
G1+G2 19.60 19.41 19.30 14.36
G1+G2+G3 19.56 19.31 19.16 14.30
G1+G2+G4 19.94 19.77 19.64 15.58
G1+G2+G3+G4 19.86 19.67 19.62 15.31
5 Conclusions
This article presents the Albayzín-2014 Audio Segmen-tation Evaluation, including the main features of the database, an overview of the participating systems and evaluation and post-evaluation results. The new Albayzín-2014 audio segmentation database combines data from two different media (TV and radio), with added noises of diverse nature, thus increasing the difficulty of the task. Using this database an audio segmentation task was proposed, where the systems were required to identify the presence of speech, music and/or noise, either isolated or overlapped. The Albayzín-2014 Audio Segmentation Evaluation contributed to the evolution of the audio seg-mentation technology in broadcast news domains by pro-viding a more general and realistic database, compared to those used in the Albayzín-2010 and -2012 Audio Seg-mentation Evaluations [10, 30]. The main features of the approaches and the results attained by seven segmen-tation systems from four different research groups have been presented and briefly analyzed. Three of the systems were based on a segmentation-and-classification strategy, while the rest of them were based on a segmentation-by-classification strategy.
the rest of the systems are based on a segmentation-by-classification strategy. Most of the systems used com-mon speech recognition features, such as MFCC, LFCC, or PLP.
The two best systems attained a segmentation error rate (SER) of around 20 %, following two different strategies but with a common classification approach based on i-vectors, showing the competitiveness of this technique. Both systems revealed that the main source of segmen-tation error was the detection of the noise class, mainly due to the low energy of noise signals. The results were analyzed using the non-overlapping classes through the confusion matrices of the primary systems. The matrices showed that the most common errors were the confusions between “speech+music+noise” with “speech+noise” or “speech+music” and also between “speech+noise” and “speech.” Finally, the participating systems were combined under different approaches, yielding a relative improve-ment of up to 7.35 % SER.
Endnote
1Spanish Thematic Network on Speech Technologies:
http://www.rthabla.es.
Abbreviations
AC: acoustic classes; BN: broadcast news; HMM: hidden Markov model; GMM: Gaussian mixture model.
Competing interests
The authors declare that they have no competing interests.
Acknowledgements
This work has been partially funded by the Spanish Government and the European Union (FEDER) under the project TIN2011-28169-C05-02 and supported by the European Regional Development Fund and the Spanish Government (‘SpeechTech4All Project’ TEC2012-38939-C03).
Author details
1ViVoLab, Universidad de Zaragoza, Zaragoza, Spain.2Aholab, Universidad del
País Vasco, Bilbao, Spain.3Multimedia Technologies Group (GTM), AtlanTIC
Research Center, Universidade de Vigo, Vigo, Spain.4ATVS, Universidad
Autónoma de Madrid, Madrid, Spain.5CAIAC, Universitat Autònoma de
Barcelona, Barcelona, Spain.
Received: 10 April 2015 Accepted: 16 November 2015
References
1. J Saunders, in1996 IEEE International Conference on Acoustics, Speech, and Signal Processing Conference Proceedings. Real-time discrimination of broadcast speech/music, vol. 2 (IEEE Atlanta, 1996), pp. 993–996 2. E Scheirer, M Slaney, Construction and evaluation of a robust multifeature
speech/music discriminator. 1997 IEEE International Conference on Acoustics, Speech, and Signal Processing.2, 1331–1334 (1997) 3. S Srinivasan, D Petkovic, D Ponceleon, inProceedings of the Seventh ACM
International Conference on Multimedia. Towards robust features for classifying audio in the CueVideo system (ACM New York City, NY, 1999), pp. 393–400
4. S Kiranyaz, AF Qureshi, M Gabbouj, A generic audio classification and segmentation approach for multimedia indexing and retrieval. IEEE Trans. Audio Speech Lang. Process.14(3), 1062–1081 (2006)
5. Z Huang, Y-c Cheng, K Li, V Hautamaki, C-h Lee, inProc. Interspeech. A blind segmentation approach to acoustic event detection based on i-vector (ISCA Lyon, 2013), pp. 2282–2286
6. NIST, TREC NIST Evaluations. http://www.itl.nist.gov/iad/mig//tests/sdr/ Accessed 23 Nov 2015
7. S Galliano, E Geoffrois, D Mostefa, inInterspeech. The ESTER phase II evaluation campaign for the rich transcription of French broadcast news (ISCA Lisbon, 2005), pp. 3–6
8. J Zibert, F Mihelic, J Martens, H Meinedo, J Neto, L Docio, C Garcia-Mateo, P David, E Al, inInterspeech. The COST278 broadcast news segmentation and speaker clustering evaluation-overview, methodology, systems, results (ISCA Lisbon, 2005)
9. T Butko, CN Camprubí, H Schulz, inII Iberian SLTech. Albayzin-2010 audio segmentation evaluation: evaluation setup and results (FALA Vigo, 2010), pp. 305–308
10. A Ortega, D Castan, A Miguel, E Lleida, The Albayzin 2012 Audio Segmentation Evaluation (2012). http://dcastan.vivolab.es/wp-content/ papercite-data/pdf/ortega2012.pdf Accessed 23 Nov 2015
11. Tecnoparla, Tecnoparla Project. http://www.talp.upc.edu/tecnoparla 12. F Font, G Roma, X Serra, inProceedings of the 21st ACM International
Conference on Multimedia. Freesound technical demo (ACM Barcelona, Spain, 2013)
13. G Hu, 100 non-speech environmental sounds. http://www.cse.ohio-state. edu/dwang/pnl/corpus/HuCorpus.html Accessed 23 Nov 2015 14. NIST, The 2009 (RT-09) Rich transcription meeting recognition evaluation
plan. http://www.itl.nist.gov/iad/mig/tests/rt/2009/docs/rt09-meeting-eval-plan-v2.pdf Accessed 23 Nov 2015
15. Y Lavner, D Ruinskiy, A decision-tree-based algorithm for speech/music classification and segmentation. EURASIP J. Audio Speech Music Process.
2009, 1–15 (2009)
16. T Theodorou, I Mporas, N Fakotakis, An overview of automatic audio segmentation. I.J. Inf. Technol. Comput. Sci.1, 1–9 (2014)
17. S Imai, inIEEE International Conference on Acoustics, Speech, and Signal Processing Conference Proceedings. Cepstral analysis synthesis on the mel frequency scale (IEEE Boston, 1983), pp. 93–96
18. R Vergin, D O’Shaughnessy, V Gupta, inIEEE International Conference on Acoustics, Speech, and Signal Processing Conference Proceedings. Compensated mel frequency cepstrum coefficients, vol. 1 (IEEE Atlanta, 1996), pp. 323–326
19. R Vergin, Generalized mel frequency cepstral coefficients for
large-vocabulary speaker-independent continuous-speech recognition. IEEE Trans. Speech and Audio Process.7(5), 525–532 (1999)
20. E Wong, S Sridharan, inInternational Symposium on Intelligent Multimedia, Video and Speech Processing. Comparison of linear prediction cepstrum coefficients and mel-frequency cepstrum coefficients for language identification (Kowloon Shangri-La Hong Kong, 2001), pp. 95–98 21. M Hasan, M Jamil, M Rahman, inInternational Conference on Computer and
Electrical Engineering. Speaker identification using Mel frequency cepstral coefficients (Dhaka, 2004), pp. 28–30
22. P Dhanalakshmi, S Palanivel, V Ramalingam, Classification of audio signals using AANN and GMM. Appl. Soft Comput.11(1), 716–723 (2011) 23. L Xie, W Fu, Z-H Feng, Y Luo, Pitch-density-based features and an SVM
binary tree approach for multi-class audio classification in broadcast news. Multimedia Syst.17(2), 101–112 (2011)
24. D Li, I Sethi, N Dimitrova, T McGee, Classification of general audio data for content-based retrieval. Elsevier, Pattern Recogn. Lett.22, 533–544 (2001) 25. L Lu, H Zhang, H Jiang, Content analysis for audio classification and
segmentation. IEEE Trans. Speech Audio Process.10(7), 504–516 (2002) 26. TL Nwe, H Li, inIEEE International Conference on Acoustics, Speech and
Signal Processing. Broadcast news segmentation by audio type analysis, vol. 2 (IEEE Philadelphia, 2005), p. 1065
27. A Hauptmann, R Baron, M Chen, inProc. TRECVID. Informedia at TRECVID 2003: analyzing and searching broadcast news video (NIST Gaithersburg, 2003)
28. S Dharanipragada, M Franz, Story segmentation and topic detection in the broadcast news domain. DARPA Broadcast News Workshop, 1–4 (1999). http://www.itl.nist.gov/iad/mig/publications/proceedings/ darpa99/html/abstract.htm Accessed 23 Nov 2015
29. A Gallardo-Antolín, J Montero, Histogram equalization-based features for speech, music, and song discrimination. Signal Process. Lett.17(7), 659–662 (2010)
31. M Markaki, Y Stylianou, Discrimination of speech from nonspeech in broadcast news based on modulation frequency features. Speech Commun.53(5), 726–735 (2011)
32. R Huang, J Hansen, Advances in unsupervised audio classification and segmentation for the broadcast news and NGSW corpora. IEEE Trans. Audio Speech Lang. Process.14(3), 907–919 (2006)
33. SS Chen, PS Gopalakrishnan, inProc. DARPA Broadcast News Workshop. Speaker, environment and channel change detection and clustering via the Bayesian information criterion (Lansdowne, 1998)
34. Y Wu, C-h Chiu, Automatic segmentation and identification of mixed-language speech using delta-BIC and LSA-based GMMs. IEEE Trans. Audio Speech Lang. Process.14(1), 266–276 (2006)
35. M Kotti, E Benetos, C Kotropoulos, Computationally efficient and robust BIC-based speaker segmentation. IEEE Trans. Audio Speech Lang. Process.
16(5), 920–933 (2008)
36. A Misra, inProc. Interspeech. Speech/Nonspeech Segmentation in Web Videos (ISCA Portland, 2012)
37. D Castán, A Ortega, A Miguel, E Lleida, Audio segmentation-by-classification approach based on factor analysis in broadcast news domain. EURASIP J. Audio Speech Music Process.34, 1–13 (2014) 38. A Mesa, JLN Ortega, A Teixeira, EH Pérez, PQ Morales, AR Garcia, IG
Moreno, IberSPEECH 2014: VIII Jornadas en Tecnologías del Habla and IV Iberian SLTech Workshop (2014). http://iberspeech2014.ulpgc.es/index. php/online Accessed 23 Nov 2015
39. X Anguera, J Bonastre, inINTERSPEECH 2010, 11th Annual Conference of the International Speech Communication Association, Makuhari, Chiba, Japan, September 26-30, 2010. A novel speaker binary key derived from anchor models (ISCA Makuhari, Chiba, Japan, 2010), pp. 2118–2121 40. H Delgado, C Fredouille, J Serrano, inINTERSPEECH 2014, 15th Annual
Conference of the International Speech Communication Association, Singapore, September 14–18, 2014. Towards a complete binary key system for the speaker diarization task (ISCA Singapore, 2014), pp. 572–576 41. J Kittler, Combining classifiers: A theoretical framework. Pattern Anal.
Appl.1(1), 18–27 (1998)
Submit your manuscript to a
journal and benefi t from:
7 Convenient online submission 7 Rigorous peer review
7 Immediate publication on acceptance 7 Open access: articles freely available online 7 High visibility within the fi eld
7 Retaining the copyright to your article