Issues
ISSN: 2146-4138
available at http: www.econjournals.com
International Journal of Economics and Financial Issues, 2016, 6(4), 1429-1435.
Forecasting Population and Demographic Composition of Kuwait
Until 2030
Osman Gulseven*
Department of Math & Statistics, American University of the Middle East in Kuwait, Kuwait. *Email: [email protected]
ABSTRACT
State of Kuwait is one of the richest countries in the world. Thanks to its oil reserves, the country hosts millions of foreign workers whose numbers have outpaced the Kuwaiti population. This article aims to forecast the future population of Kuwait using regional and nationality-gender based population data. Both linear and exponential population projections are used to obtain the most reliable estimates with the least forecasting error. Using the data between 1998 and 2015, I forecast the population of distinct administrative regions, expatriate and Kuwaiti population as well as the overall population of Kuwait. The results suggest that the population of Kuwait is likely to reach 5 million by 2020, and 7 million in 2030. The growth in expatriate population particularly male expat workers will dominate the population growth. It is recommended that state policies should consider such demographic and geographical imbalances in planning the future growth of Kuwait.
Keywords: Population Forecasting, Demographics, Geographic Analysis, Linear Extrapolation, Exponential Extrapolation, Kuwait
JEL Classifications: J10, J15
1. INTRODUCTION
In the second half of the last century, the vast lands of Arabian Peninsula have experienced an incredible transformation. After gaining their independence, the states in the Gulf region have witnessed dramatic increase in oil wealth which spiked
an equally magnificent population increase in the region. The
State of Kuwait is no exception. This tiny nation in the North of Arabian Gulf became one of the wealthiest and fastest growing
states in the world. In Kuwait, there are both financial and
social rewards that encourage large family structures among the
citizenry (Gulseven, 2015). This policy of social and financial
reward system, accompanied by religious motivations have resulted in one of the highest fertility rates in the world, reaching
as high as 6-7 children per family during the 1980s (Kohli and Al-Omain, 1993). While population growth has since slowed
down, it is still very common to see Kuwaiti families with a large number of children. The current crude birth rate is 29 for
every 1000 citizens.
Interestingly the indigenous fertility is not the primary reason for the population growth in Kuwait. The primary source of population
growth in Kuwait is due to increasing number of expatriate workers. During the past two decades, Kuwait has imported a substantial amount of blue-collar labor force from Asian countries – mostly from Indian subcontinent. There is also a substantial population of expatriates from Philippines, and from other Arabian countries who are very visible in Kuwait’s service sector. The growth in the expatriate population is not just organic population growth. Every year, there are more guest workers entering through Kuwait airport than those who are leaving the country. According to the latest statistics from the Kuwait Public Authority for Civil
Information (PACI), the population of Kuwait hosts about 2.83
million expatriates compared to a local population of about 1.31
million citizens. As of January 2016, expatriates form 67% of the population where Kuwait citizens form 31% of the population. About 2% of the population has unidentified origins.
Kuwait’s dependence on guest workers has created both opportunities and challenges for the country. The economic
benefits have been tremendous. Thanks to the readily available
guest workers, the tiny state of Kuwait has transformed from a
workers from advanced countries and unskilled workers from
poorer regions (Malecki and Ewers, 2007).
The guest workers are visible at almost every economic activity ranging from high-tech engineering projects to simple daily transactions. However, the unexpectedly high growth in population has resulted in demographic imbalances particularly when it
comes to the gender ratio. While female-to-male ratio is 1.03 among Kuwaitis, this ratio declines to 0.54 among expatriates. The imbalanced demographics have prompted the state officials
to designate many regions in Kuwait as family only regions. As there are also strict rules on family visas, these policies resulted in de facto segregation between Kuwaitis and expat population. Naturally, some regions have experienced exponential growth, resulting in strains in infrastructure systems.
To understand the future population dynamics of the society and plan accordingly, it is essential to estimate the future population growth in a concise manner. Forecasting the population for small areas can serve as a reliable tool for decision making such as
school planning (Hansen, 2010). Al-Munais and Al-Otaibi (2008)
states that accurately projecting the population is also important for growth in water demand. In this article, I project the future
population of Kuwait until 2030 using the population data from 1998 until 2015. First, exponential and linear modeling techniques
are applied separately to regional and nationality-gender based data. Next, using the most robust estimates for the disaggregated data, I calculated the aggregated overall population in Kuwait.
The rest of the paper is organized as follows. Section 2 discusses the relevant literature on population forecasting; Section 3 introduces the data and presents some basic statistics on Kuwait population; Section 4 explains the models used in population forecasting and the forecast results. Finally, last section concludes
with a summary of the findings and some policy recommendations.
2. LITERATURE REVIEW
There is a large and growing research on several aspects of demographic forecasting. I refer to here only the population
forecasting research that is most relevant to our paper. While there
are many ways to classify the research on population forecasting,
following Smith (1997) and Ahlburg (1995) we classify them
as sophisticated techniques versus simple techniques. For an extensive review of the existing literature on other aspects of the
demographic forecasting (Booth, 2006).
The sophisticated techniques include variety of cohort-component models and probabilistic/structural equation models. The distinction between these models is ambiguous where differentiated approaches apply somewhat similar techniques. The
cohort-component models such as Carter and Lee (1992) model has
been widely applied in the literature albeit with several variations
Wiśniowski et al. (2015). Those models implement information regarding the age-specific fertility, mortality, and to some extend migration data. Martins et al. (2014) apply a multi-state
cohort-component model to make projections for Portugal. However,
the cohort-component models have a tendency to underestimate fast-growing populations and overestimate slow-growing ones
(Cameron and Poot, 2011). Hanafiah and Jemain (2013) apply the Lee-Carter model to forecast the age-specific fertility curves in
Malaysian Peninsula. Probabilistic approaches are also commonly
used in the literature. Wilson (2013) applied a probabilistic model to Greater Sydney region in Australia. Raftery et al. (2012) apply
Bayesian method for probabilistic population projections for all
nations covered by United Nations. The authors find that UN
estimates underestimate the uncertainty in population projections.
Structural models are based on econometric analyses of relationships between several socio-economic and/or socio-demographic variables and their effects on the population structure. These structural equation models have wide applications in
population-based decision making. Tsai and Yang (2015), Lin and Tsai (2015)
apply structural models to estimate the mortality rates. Mikhaylova
et al. (2015) apply a similar model to Russian Federation. Auto
regressive methods can also be used in population projections.
Tayman et al. (2007) use autoregressive integrated moving average
methodology to forecast US population trajectories.
Simple extrapolation techniques are considered to be as reliable as the sophisticated models. The reliability provided by the
sophisticated methods are ambiguous (Duchêne and Wanner, 1999) and as stated by Chi and Voss (2011), simple extrapolation methods
work at least well as the spatio-temporal regression approaches.
Another article by Chi et al. (2011) reinforces the argument that
simple extrapolation techniques even works better for small area forecasts. At county levels, empirical based trend extrapolation
techniques are more effective in planning (Rayer et al., 2009). Another line of research in demographic analysis tries to figure out which model is the best choice for the given data. Rayer (2008)
provides a very clear primer on population forecast errors. The
author suggests that mean absolute percentage errors (MAPE) and mean algebraic percentage errors (MALPE) are the most
commonly used standards to determine the precision and the bias
in population projections. However, Tayman et al. (1999) state that
MAPE might overstate the error as it tends to be right skewed.
Therefore, I also calculated the mean square errors (MSE) to
determine the best forecasts for each data segment.
In the literature, there are a few studies analyzing the Kuwaiti population structure. The data from Public Authority for Civil
Information (PACI) is the golden standard when it comes to analyzing Kuwaiti social statistics. Shah et al. (2014) use the PACI data and they find that unmarried men and women have higher mortality rates. Khorshid (1990) applied a dynamic model to Kuwaiti data, and found
out that the growth in population is likely to outpace the economic growth, resulting in decreased per capita gross domestic product in Kuwait. As majority of the Kuwait population constitutes of non-nationals, some consider this as a challenge for the Kuwaiti society
(Russell and Al-Ramadhan, 1994). However, 87% of the Kuwaiti
families employ at least one domestic helper which is increasing over
2020. Their estimates based on average cumulative past population
growth have grossly underestimated the population growth in Kuwait.
Their projection for 2020 is 3.8 million and the authors estimated the population to be 3.5 million by 2015, but it already reached 4.3 million by that time. In a recent article Younis et al. (2012) stated that the population of Kuwait is expected to increase by 17.5% and reach 3.3 million by 2025. The authors also underestimated the Kuwaiti population for 2050 by claiming that the population will increase by 82.26% to reach 5.1 million by 2050.
3. DATA
The data on population statistics comes from PACI. PACI is the authority that issues electronic civil IDs for Kuwaitis and non-Kuwaitis living in Kuwait. The personal civil IDs have to be renewed annually and the applicant has to provide his/her passport as well as proof of residence taken from the landlord. PACI collects this data and transforms it into well-organized time series which is available through www.paci.gov.kw. The data includes gender, nationality, and regional location for each resident. For this
research I use the annual data between 1998 and 2015.
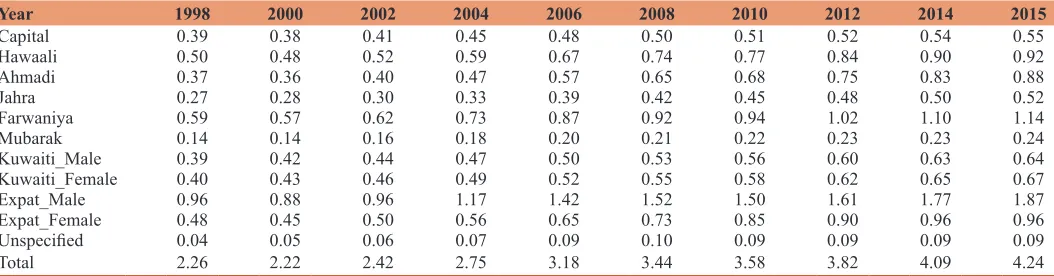
The statistics suggest that Kuwait has experienced an incredible population growth in the last decades thanks to favorable macroeconomic conditions and fertility promoting government
policies. While the total population was 2.26 million in 1998, it has increased to 4.24 million by 2015, an annual growth rate of 3.7%. The pace of growth among expats was higher
than that of Kuwaitis. Given the already high rate of expat population, this resulted in an imbalanced population in Kuwait.
The ratio of Kuwaitis have fallen from 35% in 1998 to 31% in 2015. This population imbalance also prompted some sort of
segregation among neighborhoods where some regions became expat-friendly locations whereas some regions are implicitly reserved for Kuwaitis only. Therefore, different regions in Kuwait experienced different rates of growths. Table 1 shows population growth based on regional and nationality-gender based disaggregation.
The State of Kuwait has 6 administrative districts. The population is concentrated mostly on the coastal side of the country. The regions of Farwaniya and Hawaali is located in the center of the country. These areas have traditionally been densely-populated areas and they are still the most populated regions in Kuwait. They
have experienced about 4% annual population growth. Ahmadi
area is in the South of Kuwait stretching from the central area all the way down to Saudi Arabian borderline. This area has been the
fastest growing region with an annual growth rate of about 5.5%.
The Capital district hosts the government buildings and it is also considered as the business district of Kuwait where skyscrapers dominate the skyline. The construction is limited to public works with limited residential zones. As such, its population growth
have been stable around 2% annually. Jahra is the region where
considerable amount of agricultural activity is done. This area has
experienced an annual growth rate of 4%. Finally, Mubarak region, experienced an annual growth rate of 3% over the past 17 years.
Figure 1 shows the regional population growth between 1998 and
2015 in the State of Kuwait.
One of Kuwait’s distinctive population structure is the separation in the society based on nationality and gender. Expatriate male workers form the majority of the population. Between 1998 and
2015, the population of male expats have doubled from 0.96 million to 1.87 million. Currently, this group forms 44% of the
population in Kuwait. The population of female expatriates have also followed a similar pattern to that of expat males. Following
an annual growth rate of 4%, the population of female expats doubled from 0.48 million to 0.96 million over the same period. The female expats forms about 22% of the population.
While, Kuwait has one of the highest national fertility rates experiencing an annual population growth of 3%, Kuwaitis are minorities in their country. The Kuwaiti population in 2015 is 1.31 million, where female Kuwaitis form 0.67 million and the size of male Kuwaitis is 0.64 million. There are also about 0.1 million people with unspecified ethnicity in Kuwait. Most of them are
known as Bedouins, a unique stateless group in Kuwait. Their population has been more or less stable in the past decade. Figure 2 shows the growth of population by origin in the state of Kuwait.
4.
MODELI apply two different extrapolation techniques to the population data disaggregated according to regions and gender-nationality based
decomposition. The first technique is linear trend extrapolation.
Here, it is assumed that the population will change by the same number of people as it changed annually during the base period.
According to linear trend extrapolation technique, the population in future is forecasted using the below equation:
0
( )
ˆt f t f t
P P x P P
t
+ = + −
Here t is the last year in the base period where f is the number of years until the forecasting year.Pˆt f+ is the population forecast for the year t + f, Pt is the population in the last year of the base year and P0 is the population at the first year of the base year.
The second technique is exponential trend extrapolation. The exponential forecasting technique assumes that the population will change at the same rate as it changed annually during the base period. According to exponential forecasting technique, the population in future is forecasted as below:
0 ln /
ˆ PP tt
t f t
P Pe
+ =
Before I perform these forecasting techniques, I first test these two
methods for accuracy and potential bias using the past population
data. I take the year 1998 as the first period in our base period, where
the population of 1998 is represented as P0. 2010 is chosen as the last year in the base period, where the population of 2010 is represented
as P12. After defining the base period, I forecast the population for 2011, 2012, 2013, 2014, and 2015
(
P P P P Pˆ13 14 15 16 17, , , ,ˆ ˆ ˆ ˆ)
.Thus, in the sample test estimation, I use 1998 as the base year and
and 2015. The forecast errors are calculated according to MAPE, MSE, and MALPE which are defined as follows:
MALPE is used to check for potential bias. A positive MALPE value estimates overestimation whereas a negative MALPE value indicates underestimation by the forecasting method.
ˆ
1 t t 100%
t
P P MALPE
n P
− =
Σ
×Where, n is the number of forecasted periods. MAPE and MSE are also commonly used indicators to test for validity of the population forecasts. MAPE is calculated as follows:
ˆ
1 t t
t
P P MAPE
n P
− =
Σ
MSE is calculated as follows:
(
)
21 ˆ 1 0% 0
t t
MSE Y Y
n
=
Σ
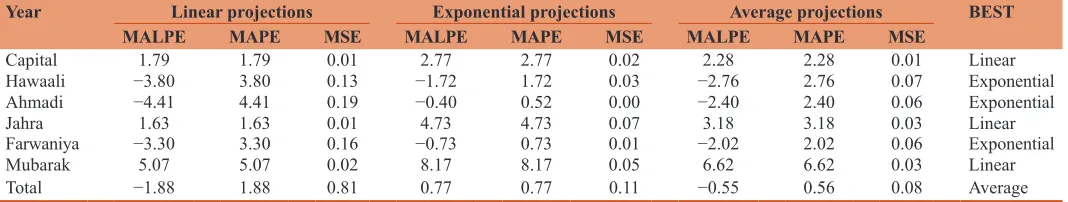
− ×Table 2 below shows the resulting forecasts and forecast errors based on linear and exponential forecasting techniques according to location-based regional analysis.
Based on the above MALPE, MAPE, MSE calculations, it is observed that linear projection method offers the best estimates for Capital, Jahra, and Mubarak regions. These regions have relatively lower growth rates and less populated than other regions. MALPE values are all positive; there is a tendency to overestimate the population growth for these regions. For Hawaali, Ahmadi, and Farwaniya regions exponential projection method offers the lowest error terms. These regions have relatively higher growth rates and more populated than other regions. As negative MALPE values are observed, there is a tendency to underestimate the population growth for these regions.
As for the overall population of Kuwait, the linear projections have a tendency to underestimate, whereas exponential projections have a tendency to overestimate the population. The average method where we take the average of linear and exponential forecasts offers better population forecasts albeit with slight underestimation. To improve the estimates I also applied another cumulative forecasting technique where forecasts are based on the best estimation technique for each region. Thus, using linear interpolation for Capital, Ahmadi, Mubarak regions and exponential interpolation for Hawaali, Ahmadi, Farwaniya regions one can get better forecasts and forecast errors. The results for this method are shown in Table 3.
As shown in Table 3, the accumulated forecasts based on the best of linear versus exponential technique gives very close forecasts
compared to the actual population numbers between 2011 and 2015. The underestimation bias have almost disappeared and the
MSE values became negligible after applying the best of linear versus exponential technique. Applying the BEST Technique to
Table 1: Population disaggregated according to region and nationality-gender combinations
Year 1998 2000 2002 2004 2006 2008 2010 2012 2014 2015
Capital 0.39 0.38 0.41 0.45 0.48 0.50 0.51 0.52 0.54 0.55
Hawaali 0.50 0.48 0.52 0.59 0.67 0.74 0.77 0.84 0.90 0.92
Ahmadi 0.37 0.36 0.40 0.47 0.57 0.65 0.68 0.75 0.83 0.88
Jahra 0.27 0.28 0.30 0.33 0.39 0.42 0.45 0.48 0.50 0.52
Farwaniya 0.59 0.57 0.62 0.73 0.87 0.92 0.94 1.02 1.10 1.14
Mubarak 0.14 0.14 0.16 0.18 0.20 0.21 0.22 0.23 0.23 0.24
Kuwaiti_Male 0.39 0.42 0.44 0.47 0.50 0.53 0.56 0.60 0.63 0.64
Kuwaiti_Female 0.40 0.43 0.46 0.49 0.52 0.55 0.58 0.62 0.65 0.67
Expat_Male 0.96 0.88 0.96 1.17 1.42 1.52 1.50 1.61 1.77 1.87
Expat_Female 0.48 0.45 0.50 0.56 0.65 0.73 0.85 0.90 0.96 0.96
Unspecified 0.04 0.05 0.06 0.07 0.09 0.10 0.09 0.09 0.09 0.09
Total 2.26 2.22 2.42 2.75 3.18 3.44 3.58 3.82 4.09 4.24
Figure 1: Population growth by region
the regional population data in Table 4 gives us the following
population forecasts between 2016 and 2030:
Regional population forecasts suggest that by 2030, Farwaniya
will still be the most populated region with a population of 1.98 million. Ahmadi will take the second place with a population
of 1.80 million, followed by Hawaali with a population of 1.5
million. Jahra, Capital, and Mubarak regions are projected to
achieve populations of 0.72 million, 0.68 million, and 0.33 million.
Assuming that the same trends will continue, the overall population
of Kuwait is projected to pass 5 million by 2020, and 7 million by 2030. Figure 3 visualizes the regional population growth. 4.1. Nationality-gender Based Forecasting
Below is the resulting forecast errors based on linear and exponential forecasting techniques according to nationality-gender
combination. Similar to regional forecasting, first I forecast the population growth between 2011 and 2015 to determine which type of forecasting technique is a better fit to the data. Table 5
gives the result of this forecast.
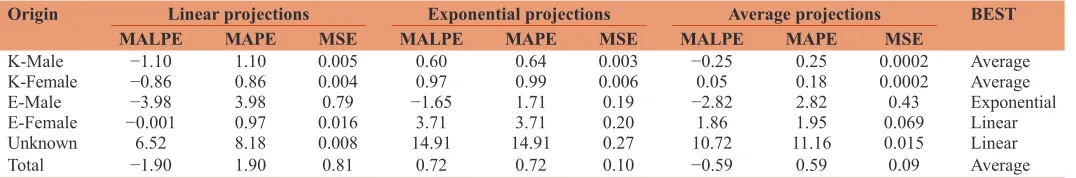
Based on the above MALPE, MAPE, MSE calculations, the average of linear and exponential projections offer the best forecasts for both male and female Kuwaitis. The growth in the Kuwaiti population is organic and can easily be estimated by smoothing different estimation techniques. Compared to expat population, Kuwaiti population has experienced lower growth rates. Linear projections tend to underestimate, whereas exponential projections tend to overestimate overall the population growth. However, the
averaging method apparently smoothed those irregularities. We
observe a diversity regarding gender-based growth among the
expat population. Exponential projections fit well with for the male expat population, whereas linear projections fit better for the female expat population. For the unspecified category, linear projection is the best fit albeit with an overestimation bias. As for
the overall population of Kuwait, the linear projections have a tendency to underestimate, whereas exponential projections have a tendency to overestimate the population. The average method where we take the average of linear and exponential forecasts offers better population forecasts albeit with slight underestimation bias. To improve the estimates I also calculated the forecasts that are based on the best estimation technique for each population category. Thus, using average method for Kuwaiti males and females, exponential interpolation for expat males and linear projection for expat females, we expected to get better forecasts and forecast errors. However, our BEST method did not suggest any improvement over the simple averaging technique.
As shown in Table 6, the accumulated forecasts based on the best of linear versus exponential versus average technique did not suggest any better forecasts then simple averaging technique. Nevertheless, it still gives very close forecasts compared to the
actual population numbers between 2011 and 2015. Applying the BEST Technique to the categorical population data in Table 7 gives the following population forecasts between 2016 and 2030:
The nationality-gender based estimates suggest a more conservative forecast for the population of Kuwait compared to regional population forecasts. Nationality-gender based population
forecasts suggest that by 2030, if the same trends continue the expat population will reach 4.65 million whereas the Kuwaiti population
Table 3: Kuwait population forecasts and forecast errors for 2011-2015
Year 2011 2012 2013 2014 2015 MALPE MAPE MSE
Actual 3.70 3.82 3.97 4.09 4.24 0.08 0.13 0.003
Forecast 3.70 3.83 3.96 4.10 4.24
MALPE: Mean algebraic percentage errors, MAPE: Mean absolute percentage errors, MSE: Mean square errors
Figure 3: Regional population projections until 2030
Table 2: Regional population forecast errors for 2011-2015
Year Linear projections Exponential projections Average projections BEST
MALPE MAPE MSE MALPE MAPE MSE MALPE MAPE MSE
Capital 1.79 1.79 0.01 2.77 2.77 0.02 2.28 2.28 0.01 Linear
Hawaali −3.80 3.80 0.13 −1.72 1.72 0.03 −2.76 2.76 0.07 Exponential
Ahmadi −4.41 4.41 0.19 −0.40 0.52 0.00 −2.40 2.40 0.06 Exponential
Jahra 1.63 1.63 0.01 4.73 4.73 0.07 3.18 3.18 0.03 Linear
Farwaniya −3.30 3.30 0.16 −0.73 0.73 0.01 −2.02 2.02 0.06 Exponential
Mubarak 5.07 5.07 0.02 8.17 8.17 0.05 6.62 6.62 0.03 Linear
Total −1.88 1.88 0.81 0.77 0.77 0.11 −0.55 0.56 0.08 Average
MALPE: Mean algebraic percentage errors, MAPE: Mean absolute percentage errors, MSE: Mean square errors
Table 4: Regional population projections until 2030
Location 2016 2018 2020 2022 2024 2026 2028 2030
Capital 0.56 0.57 0.59 0.61 0.63 0.64 0.66 0.68
Hawaali 0.95 1.01 1.08 1.15 1.23 1.32 1.41 1.50
Ahmadi 0.92 1.01 1.11 1.23 1.35 1.48 1.63 1.80
Jahra 0.53 0.56 0.59 0.61 0.64 0.67 0.69 0.72
Farwaniya 1.18 1.27 1.37 1.47 1.59 1.71 1.84 1.98
Mubarak 0.25 0.26 0.27 0.28 0.29 0.31 0.32 0.33
will be about 1.88 million. Besides the imbalance in the country of origin, there will be a wider gender gap in the population. Expat
males who currently form 44.4% of the population will form 45.7% of the population by 2020. This ratio is expected to increase to almost 50% by 2030. (Figure 4) visualizes the results.
5. CONCLUSION AND POLICY
IMPLICATIONS
In this article I estimated the Kuwait population based on two distinct data sets; one based on regional analysis and another based on nationality-gender segmentation. In the estimates, I followed
Armstrong et al. (2015) who suggested that being conservative is
the golden rule of forecasting. The results imply both theoretical outcomes for the population forecasting research and practical
outcomes for the State of Kuwait. From a theoretical perspective I found that extrapolation method works very well for small scale data but there is no unanimity regarding the choice of extrapolation method.
For some regions linear method works best, whereas for some others exponential works better. Also, simply averaging both
methods works fine when the data is disaggregated according to nationality-gender basis. Those results are in line with Wilson (2015) who states that at a small area scale, simple methods are
the easiest to employ.
In order to forecast the Kuwait population I used the best extrapolation method for each segmented data. The results show that the best technique works very well for regional analysis, but the simpler averaging technique works as well as the best technique for nationality-gender based analysis. According to the regional analysis the population in State of Kuwait is expected to reach
7 million by 2030, which is slightly higher that the nationality-gender based aggregated forecast of 6.67 million by 2030. The almost 50% rise in expected population is due to both organic
growth and international immigration. As discussed by Fargues
(2011) the non-nationals have been instrumental in utilizing the
oil wealth which induced high fertility among nationals and high immigration rates for guest workers.
On a negative side, the rapid growth in population are putting strains in the region’s capacity to cope with the overwhelming
infrastructural transformation (Roudi-Fahimi and Kent, 2007).
The urban growth has also contributed to the air pollution and
road traffic in Kuwait (Al-Bassam and Khan, 2004). The rapid
modernization and population increase started threatening
Kuwait’s desert and coastal ecosystems (Shuaib, 1998).
Baker et al. (2014) state that small-area demographic forecasts
suffer from several limitations. The demographic forecasting applied in this article using Kuwait data has several limitations as well. First, as with all extrapolation techniques, the assumption that past trends are likely to continue in the future may be happen particularly for expatriate workers. As discussed by Al-Rukaibi
and Al-Mutairi (2013) national income and labor force are among
the main factors why people travel to Kuwait. The high volatility in oil prices have substantial effects on the local economy which
might reverse the influx of guest workers in Kuwait. Also, Al-Qudsi (1998) finds out that high level of female educational
attainment has a negative effect on fertility. As State of Kuwait heavily invests in education of its citizens, the higher education
Table 6: Kuwait population forecasts and forecast errors for 2011-2015
Year 2011 2012 2013 2014 2015 MALPE MAPE MSE
Actual 3.70 3.82 3.97 4.09 4.24 −0.61 0.61 0.09
Forecast 3.69 3.82 3.94 4.06 4.18
MALPE: Mean algebraic percentage errors, MAPE: Mean absolute percentage errors, MSE: Mean square errors
Table 5: Forecast errors by nationality-gender for 2011-2015
Origin Linear projections Exponential projections Average projections BEST
MALPE MAPE MSE MALPE MAPE MSE MALPE MAPE MSE
K-Male −1.10 1.10 0.005 0.60 0.64 0.003 −0.25 0.25 0.0002 Average
K-Female −0.86 0.86 0.004 0.97 0.99 0.006 0.05 0.18 0.0002 Average
E-Male −3.98 3.98 0.79 −1.65 1.71 0.19 −2.82 2.82 0.43 Exponential
E-Female −0.001 0.97 0.016 3.71 3.71 0.20 1.86 1.95 0.069 Linear
Unknown 6.52 8.18 0.008 14.91 14.91 0.27 10.72 11.16 0.015 Linear
Total −1.90 1.90 0.81 0.72 0.72 0.10 −0.59 0.59 0.09 Average
MALPE: Mean algebraic percentage errors, MAPE: Mean absolute percentage errors, MSE: Mean square errors
Table 7: Nationality-gender based population projections until 2030
Year 2016 2018 2020 2022 2024 2026 2028 2030
Kuwaiti-Male 0.66 0.69 0.72 0.76 0.80 0.83 0.87 0.91
Kuwaiti-Female 0.68 0.72 0.76 0.80 0.84 0.88 0.92 0.97
Expat-Male 1.94 2.09 2.26 2.43 2.62 2.82 3.04 3.28
Expat-Female 0.99 1.05 1.10 1.15 1.21 1.26 1.31 1.37
Unspecified 0.10 0.10 0.11 0.11 0.12 0.13 0.13 0.14
Total 4.37 4.65 4.94 5.25 5.58 5.92 6.28 6.66
levels might unintentionally induce lower local fertility. Also, our best method was tested according to the estimation results based
on last 5 years. Therefore, one should be cautious when using forecasts beyond 5 years.
REFERENCES
Ahlburg, D.A. (1995), Simple versus complex models: Evaluation, accuracy, and combining. Mathematical Population Studies, 5(3), 281-290.
Al-Bassam, E., Khan, A. (2004), Air pollution and road traffic in Kuwait. WIT Transactions on the Built Environment, 75, 741-750.
Al-Jarallah, K.F., Moussa, M.A.A., Hakeem, S.K., Al-Khanfar, F.K. (2009), The nursing workforce in Kuwait to the year 2020. International Nursing Review, 56(1), 65-72.
Al-Munais, W.A., Al-Otaibi, O.S. (2008), Water, population and urban growth of Kuwait city: A study of two master plans (1970, 2003). Journal of the Social Sciences, 36(2), 42-64.
Al-Qudsi, S. (1998), The demand for children in Arab countries: Evidence from panel and count data models. Journal of Population Economics, 11(3), 435-452.
Al-Rukaibi, F., Al-Mutairi, N. (2013), Forecasting air travel demand of Kuwait: A comparison study by using regression vs. Artificial intelligence. Journal of Engineering Research, 1(1), 113-143. Armstrong, J.S., Green, K.C., Graefe, A. (2015), Golden rule of
forecasting: Be conservative. Journal of Business Research, 68(8), 1717-1731.
Baker, J., Alcántara, A., Ruan, X., Watkins, K., Vasan, S. (2014), Spatial weighting improves accuracy in small-area demographic forecasts of urban census tract populations. Journal of Population Research, 31(4), 345-359.
Booth, H. (2006), Demographic forecasting: 1980 to 2005 in review. International Journal of Forecasting, 22(3), 547-581.
Cameron, M.P., Poot, J. (2011), Lessons from stochastic small-area population projections: The case of Waikato subregions in new Zealand. Journal of Population Research, 28(2-3), 245-265. Carter, L.R., Lee, R.D. (1992), Modeling and forecasting U.S. Mortality.
Journal of the American Statistical Association, 87(419), 659-671. Chi, G., Voss, P.R. (2011), Small-area population forecasting: Borrowing
strength across space and time. Population, Space and Place, 17(5), 505-520.
Chi, G., Zhou, X., Voss, P.R. (2011), Small-area population forecasting in an urban setting: A spatial regression approach. Journal of Population Research, 28(2-3), 185-201.
Duchêne, J., Wanner, P. (1999), Uncertainty in demographic projections and its consequences for the user. Statistical Journal of the United Nations Economic Commission for Europe, 16(4), 267-279. Fargues, P. (2011), Immigration without inclusion: Non-nationals in
nation-building in the Gulf states. Asian and Pacific Migration Journal, 20(3-4), 273-292.
Gulseven, O. (2015), Challenges to employing Kuwaitis in the private sector. Gulf Affairs, 1, 13-16.
Hanafiah, H., Jemain, A.A. (2013), Structural Modeling of age Specific Fertility Curves in Peninsular Malaysia: An Approach of Lee Carter Method. Paper Presented at the AIP Conference Proceedings, 1571. p1062-1068.
H a n s e n , H . S . ( 2 0 1 0 ) , S m a l l - a r e a P o p u l a t i o n Projections - A Key Element in Knowledge Based e-Governance. DOI:10.1007/978-3-642-15172-9_4.
Khorshid, M. (1990), A dynamic macroeconomic model for Kuwait.
Analysis of the medium-term path. Energy Economics, 12(4), 289-301.
Kohli, K.L., Al-Omain, M.H. (1993), Fertility in Kuwait: 1970-1985. Genus, 49(3-4), 55-69.
Lin, T., Tsai, C.C. (2015), A simple linear regression approach to modeling and forecasting mortality rates. Journal of Forecasting, 34(7), 543-559.
Malecki, E.J., Ewers, M.C. (2007), Labor migration to world cities: With a research agenda for the Arab gulf. Progress in Human Geography, 31(4), 467-484.
Martins, M.O., Rodrigues, I., Rodrigues, T. (2014), Multistate projections by level of education for Portugal, 2011-2031. Journal of Population Research, 31(4), 317-343.
Mikhaylova, S.S., Mkhitaryan, V.S., Sarycheva, T.V., Bakumenko, L.P. (2015), Long-term forecasting of the number of labor pensioners in the region. Mediterranean Journal of Social Sciences, 6(3), 351-360. Raftery, A.E., Li, N., Ševčíková, H., Gerland, P., Heilig, G.K. (2012),
Bayesian probabilistic population projections for all countries. Proceedings of the National Academy of Sciences of the United States of America, 109(35), 13915-13921.
Rayer, S. (2008), Population forecast errors: A primer for planners. Journal of Planning Education and Research, 27(4), 417-430.
Rayer, S., Smith, S.K., Tayman, J. (2009), Empirical prediction intervals for county population forecasts. Population Research and Policy Review, 28(6), 773-793.
Roudi-Fahimi, F., Kent, M.M. (2007), Challenges and opportunities - The population of the middle East and North Africa. Population Bulletin, 62(2), 1-19.
Russell, S.S., Al-Ramadhan, M.A. (1994), Kuwait’s migration policy since the gulf crisis. International Journal of Middle East Studies, 26(4), 569-587.
Shah, N.M., Shah, M.A., Chowdhury, R.I., Menon, I. (2002), Foreign domestic workers in Kuwait. Who employs how many. Asian and Pacific Migration Journal, 11(2), 247-269.
Shah, N.M., Thalib, L., Al-Ateeqi, A. (2014), Mortality differences according to marital status among men and women in Kuwait. Asian Population Studies. DOI:10.1080/17441730.2014.942944. Shuaib, H.A. (1988), Oil, development, and the environment in Kuwait.
Environment, 30(6), 18-44.
Smith, S.K. (1997), Further thoughts on simplicity and complexity in population projection models. International Journal of Forecasting, 13(4), 557-565.
Tayman, J., Smith, S.K., Lin, J. (2007), Precision, bias, and uncertainty for state population forecasts: An exploratory analysis of time series models. Population Research and Policy Review, 26(3), 347-369. Tayman, J., Swanson, D.A., Barr, C.F. (1999), In search of the ideal
measure of accuracy for subnational demographic forecasts. Population Research and Policy Review, 18(5), 387-409.
Tsai, C.C.L., Yang, S. (2015), A linear regression approach to modeling mortality rates of different forms. North American Actuarial Journal, 19(1), 1-23.
Wilson, T. (2013), Quantifying the uncertainty of regional demographic forecasts. Applied Geography, 42, 108-115.
Wilson, T. (2015), New evaluations of simple models for small area population forecasts. Population, Space and Place, 21(4), 335-353. Wiśniowski, A., Smith, P.W.F., Bijak, J., Raymer, J., Forster, J.J. (2015),
Bayesian population forecasting: Extending the Lee-Carter method. Demography, 52(3), 1035-1059.