International Journal of Green Pharmacy • Oct-Dec 2017 (Suppl) • 11 (4) | S774
Analytical procurement of pharmaceutical
development of preparation with thioctic
acid in the form of injectable solution
E. S. Nazarova
1, Verbova Yu. M.
1, L. G. Almakaeva
2, L. O. Bobrytska
2,
N. L. Bereznyakova
1, T. I. Ivko
31State Enterprise “State Scientific Center for Drugs and Medical Products,” Kharkov, Ukraine, 2Department of Industrial Technology of Drugs, National University of Pharmacy, Kharkov, Ukraine, 3Department of Pharmacy, National Pirogov Memorial Medical University, Vinnytsya, Ukraine
Abstract
Aim: The aim of this study is to carry out analytical supplying of pharmaceutical development and standardization of methods of quality control of the drug with thioctic acid (α-TA) by the main indices in accordance with the requirements of the State Pharmacopoeia of Ukraine (harmonized with the European Pharmacopoeia) for parenteral medicinal products, namely, injectable solutions. Materials and Methods: The analytical research has been conducted by the method of liquid chromatography on the chromatograph of the firm “Waters 2487” (USA); thin-layer chromatography (TLC) method; method of potentiometry on рН-meter “МР-512” using electronic scales “Sartorius BA 210S;” and measuring dishes of А class. Results and Discussion: The analytical procurement of pharmaceutical development and standardized methods of quality control according to the main indices in accordance with the requirements of the State Pharmacopoeia of Ukraine for parenteral medicinal products (solutions for infusions) has been created to develop a combined original drug for the treatment of critical states of different etiologies. The validation of the method of identification and quantitative determination of α-ТА in the final dosage form, using the liquid chromatography method for analytical supplying of pharmaceutical development, has been developed, standardized, and validated. The validation studies performed for the test “quantitative determination” confirm the concordance of such validation characteristics as the forecast of complete uncertainty of the analysis, specificity, linearity, precision, and eligibility criteria. The method developed can be proposed for the determination of α-ТА identification and the concomitant impurities (admixture A and other non-specific impurities) in the injectable solution simultaneously with the quantitative determination of α-ТА. The determining method of the identification of auxiliary substance trometamol by TLC has been tested. The suitability of the method for determining the impurity B (polymerase α-ТА) in the injectable solution by the TLC method has been developed and proved. Conclusion: The method of identifying the subsidiary substance trometamol together with the active substance by TLC method is presented. The applicability of the method for determining the impurity B (thioric acid polymerase) in a solution for injection by TLC has been developed and proved.
Key words: Chromatography method, thioctic acid, validation
Address for correspondence:
T. I. Ivko, Department of Pharmacy, National Pirogov Memorial Medical University, Vinnytsya, Ukraine, Pirogov Street 56, Vinnytsya, Ukraine.
E-mail: [email protected]: +38-0982640560, +38-0968384784.
Received: 29-10-2017 Revised: 25-11-2017 Accepted: 11-12-2017
INTRODUCTION
T
hioctic acid (α-ТА; α-lipoic acid) is essential cofactor (in the form of amide – lipoamide) of multienzyme systems of a cycle of tricarboxylic acids. It is catalyzing decarboxylation α-ketoacids and alpha-ketoglutarate, which formed during the transamination of leucine, isoleucine and valine. Then a modification takes place and the transfer of acetyl to coenzyme A to form the final product of acetyl-CoA, which is a high-energyRESEARCH AR
(macroergic) compound. Also, α-TA is restored (catalyzed by dihydrolipoate dehydrogenase) to form dihydrolipoic acid. In this case, nicotinamide adenine dinucleotide is formed. Amount of α-LK in blood is normally equalled to 1–50 ng/ml.[1]
Both oxidized form and reduced form of α-ТА in the conditions in vitro display direct antioxidative properties, and are trapping for free radicals (RO2•, HOCl, OH•, and ONOOH). And restoring oxygenazed glutathione into reduced one, dehydroascorbate – into acorbate, and promoting regeneration of α-tocopherol from tocopherol radical (directly or through ascorbate).[2] Due to these
properties, α-ТА is reducing oxidizing stress and increasing endogenous antioxidative potential.[1,3,4]
Besides antioxidative, α-ТА displays a series of other effects:[1,5]
• Detoxicant - inactivates salts of heavy metals and is effective in the other poisonings and intoxications; • Hypoglycemic - increases the sensitivity of insulin
receptors and the activity of glucose transporters and intracellular transport of glucose and makes the processes of gluconeogenesis and ketogenesis slow;
• Hypolipidemic - manifests lipotropic activity and facilitates the transfer of acetate and fatty acids from cytosol to the matrix of mitochondria for subsequent oxidation through the increased CoA formation;
• Immunotropic - promotes normalization of cellular immunity;
• Neuroprotective - reduces the intensity of the LPO in the peripheral nerves and improves endoneural blood flow, which leads to an increase in the rate of nerve impulse. In general, the above-mentioned properties of α-TA play an important role in the bioenergetics of liver cells, in the regulation of carbohydrate, protein, and lipid metabolism. The wide range of antioxidant properties of α-TA, the ability to regenerate the other natural antioxidants (glutathione, ascorbate, and α-tocopherol), universal, and multilevel properties of the effect on metabolic processes have led to its use as an effective drug in various fields of medicine,[1,6]
namely, endocrinology, neurology, and gastroenterology. Creation of a new effective drug for parenteral use with TA makes it relevant to conduct analytical procurement for the pharmaceutical development of this drug.
The purpose of this work is to carry out analytical supplying of pharmaceutical development and standardization of methods of quality control of the drug with α-TA by the main indices in accordance with the requirements of the State Pharmacopoeia of Ukraine (harmonized with the European Pharmacopoeia) for parenteral medicinal products, namely, injectable solutions.
MATERIALS AND METHODS
As an object of study, an active pharmaceutical ingredient was studied (APhI) - α-ТА (5-[(3RS)-1,2-Dithiolan-3-yl]pentanoic acid) and a preparation in the form of solution for injection with this APhI. The medicine is a clear, yellowish liquid. The substation α-ТА described in the European Pharmacopoeia 9.0 in monograph “TA.[7]” Appearance: Yellow, crystalline
powder. Solubility: Very slightly soluble in water, very soluble in dimethylformamide, and freely soluble in methanol. For the development of medicine, the substance α-ТА was used, manufactured by “Chengde Miracle Pharmaceutical Co., Ltd.,” China. The level of requirements of this firm manufacturer to the substance meets the requirements of the European Pharmacopoeia.
In which way the standards were applied: TA ЕР CRS, TA containing impurity B ЕР CRS, TA for system suitability ЕР CRS (containing impurity A), and trometamol CRS.
The analytical research has been conducted by the method of liquid chromatography (РХ) (ЕР, 2.2.29, 2.2.46) on the chromatograph of the firm “Waters 2487” (USA) - quantification and determination of contaminants; -ayer chromatography (TLC) method (ЕР, 2.2.27) (determining the impurity B); method of potentiometry (ЕР, 2.2.3) on рН-meter “МР-512” (determining the рН) using electronic scales “Sartorius BA 210S,” and measuring dishes of А class.
Identification of Trometamol and α-ТА
Examine by TLC (2.2.27), using silica gel G R as the coating substance. Wash the plate with methanol R before applying the solutions.
Test solution: Dilute 1.0 mL of trometamol to 10.0 mL with methanol R.
Reference solution: Dissolve 30.0 mg of trometamol CRS and 25.0 mg TA CRS in methanol R and dilute to 10 mL with the same solvent.
Apply to the plate 10 μL of each solution. Develop over a path of 10 cm using a mixture of 10 volumes of dilute ammonia R1 and 90 volumes of 2-propanol R. Dry the plate at 100–105°C. Spray with a 5 g/L solution of potassium permanganate R in a 10 g/L solution of sodium carbonate R. After about 10 min examine in daylight.
Limits:
International Journal of Green Pharmacy • Oct-Dec 2017 (Suppl) • 11 (4) | S776 of spots in the chromatogram obtained with reference
solution (TA, trometamol).
Assay
• Liquid chromatography (2.2.29). • Protect the solutions from light.
Solvent mixture: A mixture of equal volumes of acetonitrile R1 and a 0.7 g/L solution of potassium dihydrogen phosphate R previously adjusted to pH 3.6 with phosphoric acid R. Test solution: 2.0 мл of drugs is placed in a volumetric flask with a capacity of 50 ml, add 20 ml mixture of solvents, 5 ml 15 g/l solution of phosphoric acid concentrated; volume of the solution was adjusted to the mark with solvent and mixed.
Reference solution: Dissolve 50.0 mg of TA CRS in the solvent mixture and dilute to 50.0 mL with the solvent mixture.
Chromatography is carried out on a liquid chromatograph with an ultraviolet (UV) detector under the following conditions:
Column waters Spherisorb ODS2: • Size: l = 0.25 m, Ø = 4.6 mm;
• Stationary phase: Octadecylsilyl silica gel for chromatography R (5 μm);
• Temperature: 35°C.
Mobile phase: Mix 8 volumes of acetonitrile R1, 41 volumes of a 0.7 g/L solution of potassium dihydrogen phosphate R previously adjusted to pH 3.0 with phosphoric acid R, and 51 volumes of methanol R.
• Flow rate: 1.2 mL/min.
• Detection: Spectrophotometer at 215 nm. • Injection: 20 μL.
System suitability:
• The efficiency of the chromatographic column was calculated from the peak of TA on the chromatogram obtained with reference solution, should be not <5000 theoretical plates;
• Symmetry factor: Maximum 2.0 for the peak due to α-TA in the chromatogram obtained with reference solution; • The relative standard deviation (RSD) calculated for the
peak area of TA on three consecutive chromatograms of reference solution, not more than 2.0%.
Limits:
The TA content in mg (Х) to 1 ml of drug is calculated from the following formula:
1 0 1 0
0 0
S ×m ×50×P S ×m ×P
X= = ,
S × 50×2×100 S ×200
Where
S1 = The average value of areas of TA peaks on the chromatogram of test solution;
S0 = The average value of areas of TA peaks on the chromatogram of reference solution;
m0 = Sample weight of TA CRS, in mg; Р = The TA content in TA CRS, percent.
Content C8Н14О2S2 (TA) in 1 ml of the substance should be: At the time of release - from 23.75 mg to 26.25 mg; during storage - from 22.50 mg to 26.25 mg.
Identification α-ТА
Liquid chromatography (2.2.29).
The retention time of the main peak on the chromatogram of test solution in quantitative determination should correspond to the retention time of the main peak on the reference chromatogram.
Related Substances
• Liquid chromatography (2.2.29). • Protect the solutions from light.
• Test solution, solvent mixture, and conditions of the test procedure have described in the method of quantification of TA.
Reference solution (a): Dissolve 5 mg of TA for system suitability CRS (containing impurity A) in the solvent mixture and dilute to 5 mL with the solvent mixture.
Reference solution (b): Dilute 5.0 mL of the test solution to 100.0 mL with the solvent mixture. Dilute 1.0 mL of this solution to 10.0 mL with the solvent mixture.
Blank solution: Solvent mixture.
20 μL of reference solution are being chromatographed (a). Relative retention with reference to TA (retention time = about 10 min): Impurity A = about 2.2.
20 μL of reference solution (b) and test solution are being chromatographed alternatively. Runtime: 2.5 times the retention time of TA. 20 mkl of blank solution are being chromatographed for determination of the system peaks. System suitability:
Limits:
• Correction factor: For the calculation of content, multiply the peak area of impurity A by 0.6;
• Impurity A: Not more than the area of the principal peak in the chromatogram obtained with reference solution (b) (0.5%);
• Unspecified impurities: For each impurity, not more than the area of the principal peak in the chromatogram obtained with reference solution (b) (0.5%);
• Total: Not more than 4 times the area of the principal peak in the chromatogram obtained with reference solution (b) (2.0%);
• Disregard limit: 0.1 times the area of the principal peak in the chromatogram obtained with reference solution (b) (0.05).
Impurity B
TLC (2.2.27). Test solution: 2.7 ml of preparation is being brought by dimethylformamide R to the volume of 10.0 ml. Reference solution: Dissolve 20 mg of TA containing impurity B CRS in dimethylformamide R and dilute to 1.0 mL with the same solvent (3.0% impurity B solution). Plate: TLC silica gel plate R. Mobile phase: 25% V/V solution of ammonia R, water R, ethyl acetate R, propanol R (5:10:40:40 V/V/V/V). Application: 5 µL. Development: Over 2/3 of the plate. Drying: At 50°C for 20 min. Detection: Expose to iodine vapor for 30 min or until the spots appear. System suitability: Test solution The chromatogram shows two clearly separated principal spots due to impurity B (Rf = 0.0) and TA (Rf = about 0.3).
Limit:
• Impurity B: Any spot due to impurity B is not more intense than the corresponding spot in the chromatogram obtained with the reference solution (3.0%);
• Not taking into consideration the spot with Rf of about 0.2, corresponding to trometamol.
Validation
The method of the “assaу” test determination in a solution for injection by liquid chromatography method is validated in accordance with the requirements of the section “validation of analytical techniques and tests” of the State Pharmacopoeia of Ukraine.[8] Range of application of the proposed method
should be not less than + 20% of the nominal content that is from 80% to 120% using the permissible criteria of ±5.0%. The main qualitative and quantitative indicators of the quality of the drug are є “identification,” “assay,” “related substances,” and “impurity B.” This work is devoted to the development of these indicators. Furthermore, the drug has been standardized for all the quality indicators that are necessary for drugs for parenteral use, namely, injection
solutions, in accordance with the requirements of the State Pharmacopoeia of Ukraine.[8]
RESULTS AND DISCUSSION
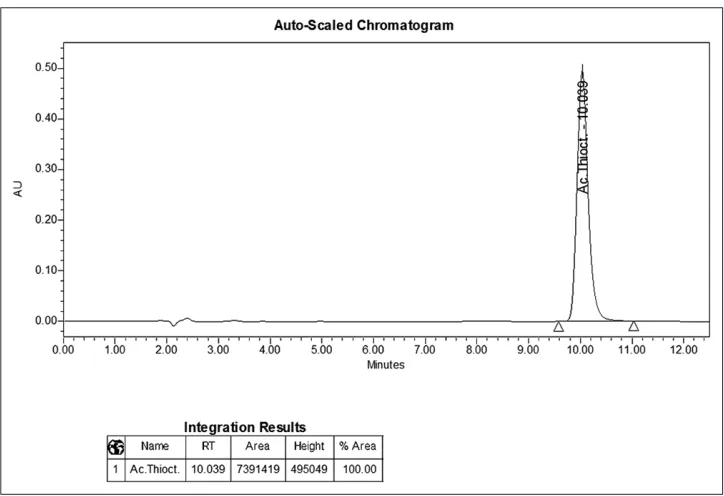
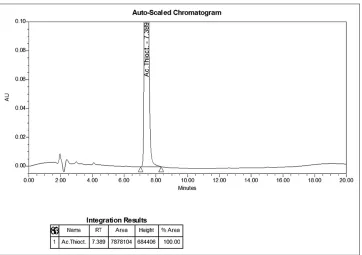
To identify the α-ТА, the LCh method was applied, offered for quantification of the active substance of the preparation. The coincidence of the retention times of α-ТА on chromatograms of the test solution and reference solution confirms the identification of this substance. The retention time of the α-ТА is about 10.0 min. The chromatograms obtained are shown in Figures 1 and 2.
Specificity of the test is confirmed by the fact that:
1. The holding time of the α-ТА peak on the chromatogram of the test solution [Figure 2] coincides with the time of holding this peak on the chromatogram of the reference solution with an accuracy of ±2% [Figure 1];
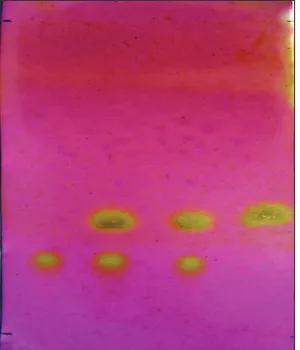
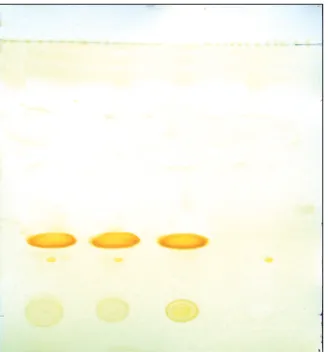
2. The chosen conditions of chromatography allow to separate the peak of α-TK from the peaks of auxiliary substances (“placebo”), as can be seen from Figure 3. For the simultaneous identification of trometamol and α-ТА, the method of TLC was suggested: On chromatogram of the test solution, two yellow spots should be detected on a pink background at the level of spots on the chromatogram of the reference solution. Chromatography was carried out under the same conditions as described in EP 9.0 in the monograph “trometamol” to determine its authenticity. Chromatography was performed on silica gel G R plates; application: Test solution and reference solution, which correspond to 20 μg of trometamol and 25 μg of TA, a chromatographic chamber saturated with a dilute ammonia solvent mixture of R1 - 2-propanol R (10: 90); spots’ detection after drying in a drying cabinet (at a temperature of 100°C–105°C for 5 min) by spraying with 5 g/L solution of potassium permanganate R in a 10 g/L solution of sodium carbonate R and examining in daylight.
It has been found that in the indicated mobile phase, on the indicated plates of the chromatogram of the test solution, two spots of yellow color were detected on a pink background at the level of spots on the chromatogram of the reference solution: Rf of the trometamol spots ~0.2, and α-TK ~0.35. A typical chromatogram is shown in Figure 4.
International Journal of Green Pharmacy • Oct-Dec 2017 (Suppl) • 11 (4) | S778 The chromatograms of the reference solution, the test solution,
and “placebo” are presented in Figures 1-3, respectively. The proof of the suitability of the conditions for chromatographic determination of α-ТА in the preparation is provided by introducing into the method of a test “system suitability,” which includes all the necessary requirements to the analytical system: Efficiency of the chromatographic column calculated for α-ТА peaks should be at least 5000 theoretical plates (actually 8000); coefficient of symmetry of α-ТА peaks should not be more than 1.8 (actually 1.5);
and the RSD calculated for the peak area of α-ТА must meet the requirements of the SPF, 2.2.46[8] (actually RSD ≤0.67).
Hence, obtained results meet the requirements.
Accuracy, Precision, and Linearity
The method of determining the “assaу” test in injectable solution by the LCH method is validated in accordance with the requirements of the SPU section “validation of analytical techniques and tests[8]” based on the fact that the
Figure 1: The chromatogram of the reference solution for identification of the indices “identification” and “assay”
range of application of the proposed methodology should not be less than + 20% of the nominal content, i.e., from 80% to 120%, using the eligibility criteria for content tolerances +5.0%.
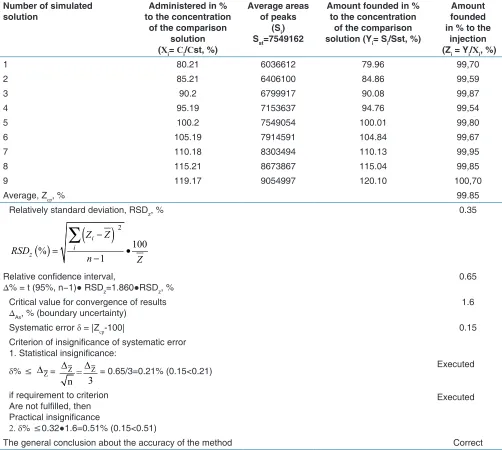
The results of analysis of the simulated mixtures and their statistical processing for the estimation of precision, correctness, and linearity have presented in Table 1. Based on the data presented in these Tables, it can be concluded
that α-ТА method of analysis is characterized by sufficient precision (convergence). The value defined of the relative confidence interval Z (0.65%) is less than the critical value for the convergence of results (1.6%).
The criterion of the insignificance of the systematic error of the method is executed - the systematic error of the method of 0.15% is statistically and practically insignificant, that is, the method of analysis is characterized by sufficient correctness throughout the range of concentrations of 80–120% [Table 1]. Thus, linearity, precision (convergence), and accuracy of α-ТА determination by the method of LC have proved in the range of application from 80% to 120%.
The calculation of parameters of linear dependence Yi = b*Xi + a (according to the Table 1) was carried out by the method of least squares. The results are presented in Table 2, and the linear dependence of peak areas on α-ТA concentration in normalized coordinates is shown in Figure 5 which testify the fulfilment of the requirements for the parameters of linear dependence, that is, the linearity of the method is confirmed throughout the range of concentrations of 80–120%.
Uncertainty of Analysis
The complete uncertainty of the data predicted is 1.27% and does not exceed the critical value (1.6%). Thus, the method will provide with the correct results in other laboratories in reference to the “assaу” indicator by the RH method.
Figure 3: Chromatogram of the “placebo” solution to determine the indices “identification” and “assay”
Figure 4: Chromatogram for determining the indicator
International Journal of Green Pharmacy • Oct-Dec 2017 (Suppl) • 11 (4) | S780 For the product being developed, within the processing
of the quality control, the content of α-TA is proposed to be normalized at a release in the range from 23.75 mg to 26.25 mg in 1 ml of the preparation (from 95.0% to 105.0% of the declared amount of active ingredient) and quality control during the validity period in the range of 22.50–26.25 mg in 1 ml of the drug (90.0–105.0%).
Related Substances
According to EP 9.0, the identified impurity A (β-lipoic acid) is being determined in the substance α-ТА, and it should be no more than 0.2%, any other impurity should be no more than 0.10%, and the total amount of impurities should be no more
than 0.3%. The determination of these impurities is carried out by the method of LC under conditions proposed for the quantitative determination. To determine the suitability of the chromatographic system, the coefficient of the peaks separation of α-TA and the impurity A (not less than 6.0) which are included in the reference solution (a) containing TA for system suitability of EP CRS (containing impurity A) is used.
To determine the foreign impurities in the preparation, we also used the LC method, under the conditions proposed for quantitative determination of α-ТА in the preparation. The conditions for determining and suitability of the chromatographic system are given in the section “Assaу.” It has been established that coefficient of separation of the Table 1: Results of the analysis of the simulated mixtures and their statistical processing for quantitative
determination of TA
Number of simulated
solution to the concentration Administered in %
of the comparison solution
(Хі= Сі/Сst, %)
Average areas of peaks
(Sі)
Sst=7549162
Amount founded in % to the concentration
of the comparison
solution (Yі= Sі/Sst, %)
Amount founded in % to the
injection
(Zі = Yі/Хі, %)
1 80.21 6036612 79.96 99,70
2 85.21 6406100 84.86 99,59
3 90.2 6799917 90.08 99,87
4 95.19 7153637 94.76 99,54
5 100.2 7549054 100.01 99,80
6 105.19 7914591 104.84 99,67
7 110.18 8303494 110.13 99,95
8 115.21 8673867 115.04 99,85
9 119.17 9054997 120.10 100,70
Average, Zср, % 99.85
Relatively standard deviation, RSDz, %
( )
(
)
2 100 % 1 i i z Z Z RSD n Z − = • −∑
0.35Relative confidence interval,
Δ% = t (95%, n−1)● RSDz=1.860●RSDz, % 0.65
Critical value for convergence of results
ΔAs, % (boundary uncertainty) 1.6
Systematic error δ = |Zср‑100| 0.15
Criterion of insignificance of systematic error 1. Statistical insignificance:
δ% ≤ ∆Z= Z = Z
3 n
∆ ∆
= 0.65/3=0.21% (0.15<0.21)
if requirement to criterion Are not fulfilled, then Practical insignificance
2. δ% ≤0.32●1.6=0.51% (0.15<0.51)
Executed
Executed
α-ТА peaks and the impurity A in the chromatogram of the reference solution (a) is more than 6.0 [Figure 6], and hence, the chromatographic system is considered suitable.
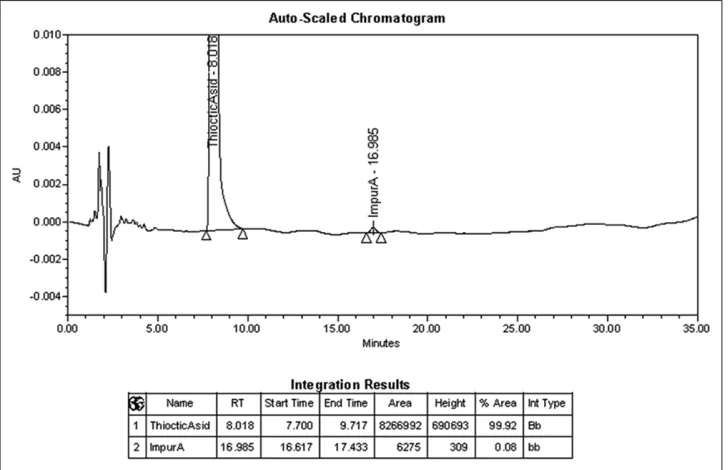
The research has been conducted to compare the chromatographic profile of the developing preparation and the reference preparation Thioctacid® 600 T solution for
intravenous administration of the company “Viatrice GmbH & Co. KG,” Germany. Investigations have shown [Figures 7 and 8] that on the chromatograms of the test solution and of the preparation being developed, one unidentified impurity was found at 0.05% (not taken into account). Furthermore, no impurities were detected on the chromatograms of the test solution of the reference preparation Thioctacid®
600 T solution for intravenous administration. Thus, the chromatographic profiles of the referent and being developed preparations are similar.
Impurity B (Polymerizate of TA)
We used the TLC method (EP, 2.2.27) to determine the impurity B (α-ТА polymerizates) in the preparation. Chromatography was performed on plates of TLC silica gel plate R - Kieselgel 60 (Merck, Germany); mobile phase: 25% V/V solution of ammonia R, water R, ethyl acetate R, propanol R (5: 10: 40: 40 V/V/V/V); detection: Expose to
Figure 5: Linear dependence of the peak area of TA on the
concentration of TA in normalized coordinates
Figure 6: Chromatogram of the reference solution (a) for determination of the test “related substances”
Table 2: Metrological characteristics of linear dependence
Value Amount Criteria (for admissions 95.0–105.0%, g=9) Conclusions
b 1.01805 -
-Sb 0.00916 -
-a −1.91514 1. ≤1.895● Sa=1.75
2. If is not fulfilled 1), then≤2.6 Corresponds
Sa 0.92438 -
-Sr 0.34996
International Journal of Green Pharmacy • Oct-Dec 2017 (Suppl) • 11 (4) | S782 iodine vapor for 30 min or until the spots appear. 5 μl (about
34 μg of TA) of the test solution and 5 μl (1 μg of impurity B, which correspond to 3.0% of the impurity in relation to the content of TA in the test solution) were applied to the line of initiation of the chromatographic plate of the solution of TA containing admixture B CRS. Determination of the content of impurity B was carried out by comparing the spot of impurity B in the chromatogram of the test solution with the spot of
impurity B on the chromatogram of the standard sample of TA containing impurity B CRS in a concentration out of 1.0% of the α-ТА concentration in this solution, which corresponds to 3.0% impurity B in relation to the content of α-ТА in the test solution [Figure 9]. The standardization of impurity В was not more than 3.0%. It was found that the normalization of impurity B is confirmed throughout the validity period, as evidenced by data from the study of stability.
Figure 7: Chromatogram of the test solution for determination of the test “related substances”
Figure 8: Chromatogram of the test solution of the preparation Thioctacid® 600 Т solution for intravenous administration for
CONCLUSION
1. The analytical procurement of pharmaceutical development and standardized methods of quality control according to the main indices in accordance with the requirements of the State Pharmacopoeia of Ukraine for parenteral medicinal products (solutions for infusions) have been created to develop a combined original drug for the treatment of critical states of different etiologies.
2. The validation of the method of identification and quantitative determination of α-ТА in the final dosage form, using the liquid chromatography method for analytical supplying of pharmaceutical development, has been developed, standardized, and validated. The validation studies performed for the test “quantitative determination” confirm the concordance of such validation characteristics as the forecast of complete uncertainty of the analysis,
specificity, linearity, precision, and eligibility criteria. The method developed can be proposed for determination of α-ТА identification and the concomitant impurities (admixture A and other non-specific impurities) in the injectable solution simultaneously with the quantitative determination of α-ТА.
3. The determining method of identification of auxiliary substance trometamol by TLC has been tested.
4. The suitability of the method for determining the impurity B (polymerase α-ТА) in the injectable solution by the TLC method has been developed and proved.
REFERENCES
1. Korpachev V, Shcherbak A. Tioctic acid: Problems and prospects of use. Bull Pharmacol Pharm 2003;3:20-8 2. Halliwell B, Gutteridge JM. Free Radicals in Biology
and Medicine. 3rd ed. Oxford: University Press; 1999.
p. 936.
3. Deneke SM. Thiol-based antioxidants. Curr Top Cell Regul 2000;36:151-80.
4. Self WT, Tsai L, Stadtman TC. Synthesis and characterization of selenotrisulfide-derivatives of lipoic acid and lipoamide. Proc Natl Acad Sci U S A 2000;97:12481-6.
5. Maritim AC, Sanders RA, Watkins JB 3rd. Effects of
alpha-lipoic acid on biomarkers of oxidative stress in streptozotocin-induced diabetic rats. J Nutr Biochem 2003;14:288-94.
6. Yu OS, Ivashkin VT. The use of thioctic acid in gastroenterology. Russ Med J 2000;8:15-6.
7. EDQM. European Pharmacopoeia. 9th ed. Strasbourg:
EDQM; 2017.
8. State Pharmacopoeia of Ukraine: In 3 tons, State Enterprise “Ukrainian Scientific Pharmacopoeia Center for the Quality of Medicines”.-2nd kind. Kharkiv: State
Enterprise “Ukrainian Scientific Pharmacopoeial Center for Quality of Medicines”; 2015. p. Т1-1128.
Figure 9: Chromatogram for determination of the index
“impurity B” by TLC method: 1 - Test solution of the preparation
Тhioktacid® 600 Т solution for intravenous administration
(about 34 mkg of TA), 2 - test solution of the developing solution (about 34 mkg of TA), 3 - reference solution (1 mkg of impurity В, which corresponds to 3.0% of impurity in relevance to the amount of TA in the test solution), 4 - trometamol solution (38 mkg of trometamol)