Resource Concentration and Civil Wars
Massimo Morelliyand Dominic Rohnerz
June 12, 2015
Abstract
This paper highlights the importance of natural resource concentration and ethnic group
regional concentration for ethnic con‡ict. The existence of multiple con‡ict terrains (and hence
multiple threat points) is the source of bargaining failure, similar to the one determined by the
presence of o¤ensive advantages. The theory predicts war to be more likely when resource and
group concentration are high, and the empirical analysis, both at the country level and at the
ethnic group level, con…rms the essential role of geographic concentration variables for civil war.
Keywords: Natural Resources, Civil War, Con‡ict, Secession, Bargaining Failure.
JEL Classi…cation: C72, D74, O12, Q34.
An earlier version of this paper has circulated under the title "Natural Resource Distribution and Multiple Forms of Civil War". We wish to thank the editor Gerard Padro i Miquel and two anonymous referees for very helpful comments. We further thank Peter Van der Windt and David Schoenholzer for excellent research assistance and Dawn Brancati, Lars-Erik Cederman, Oeindrila Dube, Tanisha Fazal, Benedikt Goderis, Matt Jackson, Cathy Hafer, John Huber, Päivi Lujala, Egil Matsen, Guy Michaels, Kalle Moene, Costantino Pischedda, Robert Powell, Rick van der Ploeg, Petros Sekeris, Tommaso Sonno, Jonathan Temple, Mathias Thoenig, Ragnar Torvik, Nicolas van de Sijpe, Peter van der Windt, Fabrizio Zilibotti and seminar and workshop participants in Washington University St. Louis, Geneva, Zurich, Columbia, Bristol, Oxford, York, Purdue, London School of Economics, Gerzensee, Trondheim, UC Berkeley, Mannheim, Namur, Rotterdam, Seattle (APSA), Milano Bicocca, Oslo, Barcelona Summer Forum, and Montpellier for helpful discussions and comments. The usual disclaimer applies.
1
Introduction
This paper provides a theoretical explanation and novel empirical investigation of the importance
of the geography of natural resources for civil war. We …nd that civil wars should be expected to
take place more frequently when the homeland of a concentrated minority group is particularly
resource rich. The paper then tests the predictions of the theory using both panel data at the
country and ethnic group level.
Two things seem to matter in general for civil war incentives: balance of strength and balance of
control on resources. When trying to resolve a con‡ict between two groups over control of resources,
one di¢ culty is that the relative strength of the two groups may di¤er from the relative wealth of
natural resources of the territories they occupy. Having surplus sharing re‡ect relative strength
eliminates the incentives to “nationwide” wars, but “secessionist” wars could then materialize; on
the other hand, making surplus sharing depend on the groups’ relative endowments of natural
resources avoids secession tensions but may cause incentives for the majority group to use their
strength to gain more power.
Recognizing this tension between the two most important determinants of bargaining power,
we have decided to focus attention on a connected observation about bargaining games: while in a
standard bargaining game there is a unique "threat point" (for example a unique type of war that
players could fall into if bargaining breaks down), in reality there are multiple threat points, which
depend on the balance of strength and geographic distribution of natural resources. If an ethnic
group is particularly in‡uential for the government of a country but another group has an important
presence (in terms of population size and rootage to the territory) in a region of the country that
is particularly rich in terms of natural resources, the tensions between the two criteria of surplus
sharing mentioned above are maximized, and are exacerbated by the fact that the two groups have
access to di¤erent threats: the powerful group controlling government forces should typically be
stronger in a nationwide ethnic con‡ict, but the minority group could sustain the secession threat
with guerrilla war and focus its lower total strength on the defense of the area where it is locally
stronger.
We model these tensions in the following way: in a country divided into two regions and
populated by two major groups, we assume that the nationwide stronger group has a realistic
o¤ensive advantage when starting a nationwide con‡ict, while a minority group mostly concentrated
in one region has a probability of winning in a secessionist civil war that exceeds the probability of
winning in a nationwide civil war. When groups are unable to commit not to use their favorite type
put forward in the o¤ensive advantage literature (see e.g. Chassang and Padro i Miquel, 2009).1
The most con‡ict prone situations are shown to be those in which the mineral resources of value
are mostly concentrated in the minority group region, and the risk is especially high in case of low
state capacity, high regional concentration of the minority group in question, and large geographic
distance of the minority region from the capital.
There are many cases where, when the presence of a concentrated ethnic group coincides with
large natural resource abundance concentrated in its region, the concentrated minority group could
be …nancially better o¤ if it were independent and may under some conditions have incentives
to start secessionist rebellion. This corresponds for example to the separatist movement in the
now independent Timor-Leste, and the recent turmoil in the oil-abundant regions of Nigeria. Also
the rebellion of the Aceh Freedom Movement in Indonesia starting in 1976 and the armed …ght
of the Sudan People’s Liberation Army beginning in 1983 can to a large extent be explained by
the abundance of natural resources in these separatist regions.2 Other countries where secessionist
movements have been linked to large local natural resources include Angola, Myanmar, Democratic
Republic of Congo, Morocco and Papua New Guinea. In all these cases an uneven natural resource
distribution has been ampli…ed by ethnic divisions. In contrast, if natural resources are absent or if
natural resources (and political power) are evenly dispersed in a country, there are typically fewer
con‡ict incentives, even when there are ethnic divisions.3 Similarly, when there are large amounts
of natural resources available, but the society is ethnically homogeneous, war incentives are weak.4
In a country level empirical analysis, we study how the unevenness of geographical distribution of
petrol …elds across ethnic groups in a given country a¤ects the likelihood of con‡ict. For this purpose
we have put together a panel of 157 countries with sample period 1960-2008, and have constructed
a new variable, Oil Gini, which captures how unevenly oil holdings are spread between di¤erent
ethnic groups in a country.5 To the best of our knowledge we are the …rst to have constructed such
a measure of inter-ethnic inequality in abundance of petrol …elds. In the regression analysis we
include –in addition to our main, new variable of interest–the standard battery of control variables,
as well as country …xed e¤ects and annual time dummies. We …nd that our novelOil Gini measure
1Ray (2010) also studies multiple threats to peace. However, he focuses on the important issue of multiple cleavages, while in our paper the cleavage is unique (for example an ethnic or religious cleavage), but the groups have di¤erent relative strengths in di¤erent types of con‡ict.
2
For a discussion of these cases see Ross (2004b). 3
This is for example the case of countries like Benin, which has only few natural resources, or of small oil-rich countries like Brunei or Qatar, where natural resources are evenly spread.
4
Examples for this include Chile and Mongolia.
has a statistically signi…cant and quantitatively strong positive e¤ect on the likelihood of civil war
onsets, as predicted by our theory.
Next, we move to a more disaggregated level of analysis: we study the e¤ect of natural resource
unevenness on civil war with a panel datasetat the ethnic group level, covering 1120 ethnic groups
and spanning over the period 1960-2006. This has the advantage that unobserved heterogeneity
problems are reduced, and ethnic group level data allows us to better discriminate between our
theory and competing explanations: our model predicts that con‡icts are fuelled by non-governing
ethnic minority groups living in oil rich regions, while alternative mechanisms (discussed below)
predict con‡ict onsets in the presence of oil-rich ethnic groups that control the government. While
our country level regressions only establish the link between inter-group oil unevenness and civil
war onset, the ethnic group level regressions distinguish such di¤erent mechanisms, and show that
it is indeed oil abundance in the regions mostly inhabited by powerless groups, rather than in the
homelands of governing ethnic groups, that drives civil wars.
Our main, novel independent variable on the ethnic group level is the surface of an ethnic
group’s territory covered with petrol (i.e. oil and gas) as a percentage of the country’s total surface
covered with petrol. To the best of our knowledge we are the …rst to study civil con‡ict using an
ethnic group panel with natural resource variables that vary for di¤erent ethnic groups and over
time.6 We …nd a statistically signi…cant and quantitatively strong positive e¤ect of the relative
resource abundance of a non-governing ethnic group on the likelihood that this group is involved
in a civil war onset. We also …nd that the interaction term of an ethnic group’s relative resource
abundance with its group concentration is positive, very sizeable and statistically signi…cant, which
is in line with our theoretical predictions. The results are robust for very demanding speci…cations
that control for ethnic group …xed e¤ects, annual time dummies, time-varying ethnic group level
controls and all country-level control variables used in the country-level regressions. Indeed civil
war is more likely when resource discoveries happen in regions that are mostly populated by groups
that do not belong to the governing coalition in the country.
Related literature
Natural resources and ethnic divisions are known to be correlated with civil con‡ict in one way or
another (see e.g., Le Billon 2001, Collier and Hoe- er 2004, Ross 2004, Montalvo and Reynal-Querol
2005, Fearon 2005, Lujala, Gleditsch and Gilmore 2005, Humphreys 2005, Lujala 2010, Dube and
6
Vargas 2013, Berman et al. 2014), but the literature does not emphasize the particularly important
role of resource concentration and ethnic concentration, independently and jointly. The existing
theoretical studies about the e¤ect of natural resources on con‡ict, by and large do not relate
to geographic concentration: Caselli and Coleman (2013) focus on the decision of the dominant
ethnic group to exploit or not the other groups in terms of the proceeds from extraction of natural
resources, but do not take into account how the geographic distribution and the economic features
of natural resources a¤ect the risk of ethnic con‡ict of di¤erent kinds; Reuveny and Maxwell (2001)
and Grossman and Mendoza (2003) use a dynamic framework to predict that present resource
scarcity and future resource abundance cause appropriative competition; Hodler (2006) …nds that
natural resources lead to more con‡icts in fractionalized countries; Rohner, Thoenig and Zilibotti
(2013) predict natural resources to have a particularly detrimental e¤ect if initial trust in a country
is low; Fearon (2005) argues that natural resources can foster con‡ict by weakening state capacity;
Besley and Persson (2011) and Bell and Wolford (2014) emphasize that weak institutions, low
income and large natural resources lead to a greater risk of civil war; van der Ploeg and Rohner
(2012) and Rohner (2014) study the two-way interaction between natural resource extraction and
civil war, focusing on depletion speed and optimal investments of windfalls. To repeat, none of
these papers consider geographic concentration of resources and how it overlaps with the geographic
concentration of minority groups.
Horowitz (1985) did make the anecdotal observation that backward concentrated minorities with
resource concentration may have the highest bene…t-cost ratio from rebellion, and Walter (2006b)
proposed a reputation building theory for why governments tend to repress rebellions in areas with
high value of land. However, Walter’s reputation theory predicts that the group secession attempts
that tend to be blocked are in countries where other groups could otherwise make similar attempts
for other resources in other areas. Thus, the explanatory variables with that type of theory would
be the number of other relevant groups in the country and the general value of land, more than
the value of land in that given group’s homelands speci…cally. The current paper shows that the
cases with natural resources concentrated in the homelands of ethnic minorities are exactly those
where bargaining can break down, even without any reputation building factor.
The paper relates also to the literature connecting income and con‡ict incentives. An increase
in income has two countervailing e¤ects: it increases the opportunity cost of …ghting, but it may
also raise the value of the appropriable prize. As shown by Fearon (2007) and Chassang and Padro
i Miquel (2009), when there is only a single source of income, these two countervailing e¤ects
countries that are abundant in natural resources, but have low labor productivity in other sectors,
an increase in the value of natural resources will only a¤ect the appropriable prize, while keeping
the opportunity cost unchanged (Dube and Vargas, 2013; Esteban, Morelli and Rohner, 2015). In
the current model we adopt this distinction between natural resource rents and incomes from other
sectors.
Preemptive and preventive war incentives due to commitment problems are a well established
phenomenon (see e.g. Taylor 1954, Levy 1987, Fearon 1995, Powell 1996 and 2006, Chassang and
Padro i Miquel 2009, and Jackson and Morelli 2011). However, in general this incentive analysis
does not separate or highlight the role of geography or concentration of resources. A traditional
preventive war incentive, due for example to an expected exogenous power shift in the future, could
make a minority group decide to rebel wherever the future enrichment and strengthening of the
majority group is expected to come from. Similarly, recent works on civil war rationalization and
natural resources that emphasize commitment problems, like Besley and Persson (2011), Lei and
Michaels (2014), and Bell and Wolford (2014), focus on the e¤ects of changes in total amounts or
values of resources rather than on distribution and concentration variables. Our focus will instead
be precisely on the role of geographic concentration of groups and concentration of resources.7
While the e¤ect of the total quantity and/or value of oil on con‡ict is ambiguous,8 we are able
to demonstrate that the unevenness of oil has a robust e¤ect. The shadow of the future argument
(related to the fear that an oil discovery could strengthen the government) is equally strong when
the oil discovery is in the region controlled by the government; hence the fact that we …nd a
strong and robust impact of the concentration of resources only in the regions mostly populated
by minority groups speaks in favor of the type of war motivations that we highlight.
Our paper can also be usefully contrasted with the literature in international relations. There
is a common view that preemptive as well as preventive war motivations relate tofear, and not to
greed.9 In our view, preemptive and preventive wars are much more likely if fear goes hand in hand
with greed: in Esteban, Morelli and Rohner (2015) the decision by a minority group to start a war
is preventive, and certainly due to fear of mass killings, but this fear comes up precisely because the
group in power is made more greedy (or is afraid that the minority group will become more greedy
7
Caselli, Morelli and Rohner (2015) …nd that geography, and in particular location of borders and resources, matter a lot also for interstate wars.
8Cotet and Tsui (2013) …nd that there is no robust e¤ect of oil reserves on civil wars when controlling for country …xed e¤ects. In contrast, Lei and Michaels (2014) …nd that oil discoveries lead to more civil wars, perhaps consistently with preventive war motivations.
9
in the future) due to larger amounts of resources. In the current paper, preemptive incentives can be
seen in the possibility of an attack due to the fear of being otherwise involved in a less advantageous
type of con‡ict, but once again this fear would not materialize without the complementary greed
on one side or the other. Moreover, given the existence of multiple con‡ict technologies that we
emphasize, spirals of events or spiral of beliefs are not necessary for the existence of preemptive
war motivations.10
In terms of relationship with other empirical studies on civil war, our …ndings are broadly
consistent with the empirical results of Walter (2006) on the importance of group concentration;
Reynal-Querol (2002), Saideman et al. (2002), and Cederman and Girardin (2007) on the
im-portance of ethnic discrimination;11 Gates (2002) and Buhaug, Gates and Lujala (2009) on the
importance of situations where the rebelling minority group is concentrated in remote peripheral
areas, where its odds of winning a local war are larger and con‡ict tends to be harder to avoid.
As far as the empirical literature on inequality and civil con‡ict is concerned (see e.g. Gurr (2000),
Alesina, Michalopoulos, and Papaioannou (2014) and Huber and Mayoral (2013)), our contribution
is to show that between-group inequality can be expected to fuel civil con‡ict if such inequality
is mostly in terms of control or shares of resource extraction rents, and especially when resource
concentration is interacted with group concentration.
The econometric speci…cation that we use in the analysis at the country level is related to
that in Fearon and Laitin (2003), Collier and Hoe- er (2004), Montalvo and Reynal-Querol (2005),
Cederman and Girardin (2007), Collier and Rohner (2008), and Esteban, Mayoral and Ray (2012).
The paper is organized as follows: In section 2 we present the model framework and characterize
its equilibrium. Then we move to the empirics, with section 3 displaying the country level analysis
…rst, followed by the ethnic group level analysis. Section 4 o¤ers some brief concluding remarks.
Supplementary material and the detailed data description are relegated to the appendix.
1 0
The o¤ense defense balance theory did already allow for the possibility that preemptive wars can occur due to technology, but in that case they talk about countries having advantages in o¤ense technology over defense technology (see e.g. Snyder, 1984), while we focus on di¤erent technological distinctions, more related to geography and motivations.
2
Model
2.1 Setup
Consider a country populated by two ethnic groups, i and j.12 The country is divided in two
clearly de…ned regions,1;2. We allow for di¤erent values of extractable natural resources in regions
1 and 2, labeled R1 and R2, respectively, where R1+R2 R.13 For simplicity, natural resource
extraction and export of such resources is conducted by a unique state …rm. The group in power
can control the sharing of the ensuing surplus.14
There areNi1 andNi2 members of group iin regions 1 and 2 respectively, andNj1; Nj2 of group
j. Assume that the two groups are to some degree concentrated in the two regions, group i in
region 1 and groupj in region 2,Ni1=Nj1> Ni2=Nj2.
We assume that group j controls the government at the beginning of the game, which may
mean that group j is a majority group (Nj = Nj1 +Nj2 > Ni = Ni1 +Ni2) in a democracy, or
simply that j had won some con‡ict for power in a prior period. Groupj in power can choose the
shares ;(1 ) of the total surplus R to be attributed respectively to groups i and j. There is
commitment to this sharing rule conditional on peace, but j is assumed to be unable to credibly
commit to always keep peace (see Powell, 1996). After the choice of by j, each player chooses
between peace and con‡ict.
There are two types of con‡ict, secessionist (s) and nationwide (n) con‡ict.15 The stake in
secessionist con‡ict is region 1, whereas in nationwide con‡ict both regions 1 and 2 are at stake. In
particular, the winner in secessionist con‡ict gainsR1 (with R2 remaining under control of group
j), while the winner in nationwide con‡ict gains R1+R2. We assume without loss of generality
that group ionly has the choice between keeping peace or initiating secessionist con‡ict (s), while
groupj only has the choice between initiating nationwide repression (n) and keeping peace.16
Call ps the probability of winning for i in case they attack the local government guards by
surprise for secession; call pn < ps the probability of winning for i when surprised by an attack
1 2
We call the two groups “ethnic groups”only because we need to focus on societies where the population is divided along some identi…able cleavage, but that cleavage could be religion or anything else. Hence we will never require any speci…c component of the concept of ethnicity in our theory.
1 3The variablesR
1 andR2 capture the total value of rents, corresponding to the product of the amounts extracted times their price. Hence, R1 andR2 increase when there are resource discoveries in the two regions (or when the world demand for the potentially di¤erent natural resources increases).
1 4
Future work could include explicit consideration of the interaction between a government, the minority groups and the extraction companies, rather than assuming state control. For a motivating case study for this future extension, see Morelli and Pischedda (2014).
1 5
See Fearon and Laitin (2003) and Ross (2012).
for nationwide repression byj.17 In line with the o¤ensive advantage framework of Chassang and
Padro i Miquel (2009), if only i chooses con‡ict, it has an o¤ensive advantage, and vice versa. If
both choose con‡ict the probability of winning for iis intermediate between the high probability
when they attack for secession and the low probability when they are surprised by a nationwide
repression attack.18 Letp be the ex ante intermediate probability of success foriin this case. We
can think of p as either a mixture of nationwide repression and secession attempts happening at
the same time or, alternatively, as a probability that one or the other pure type of war will take
place. In order not to carry around too many parameters, let’s assume thatp ps=2 +pn=2.19
Denote by csk the cost of a secessionist war and bycnk the cost of a nationwide war, for player
k =i; j, where csk csyk, and cnk cnyk. The variable yk denotes the income of group k from
all sources of revenue other than natural resource rents, andcs,cn correspond to the percentage of
such income that is lost due to war.20
2.2 Equilibrium
We shall now characterize the subgame perfect Nash equilibrium of the game. Let’s study the
incen-tive compatibility constraints to determine the bounds of the bargaining space, i.e. the threshold
levels of for which a given group would deviate from peace to start its preferred type of war. In
particular, two levels of de…ne the bargaining space:
The minimum to appease i, i.e., to avoid temptations to start surprise secession attacks, is
given by:21
s= (psR1 csi)=(R1+R2):
The maximum that j is willing to concede without temptation to do nationwide repression
1 7This assumption is justi…ed by the empirical …ndings that secessionist con‡ict generally entails a higher winning chance for groupi, i.e. ps> pn(see e.g. Gates (2002) and Buhaug, Gates and Lujala (2009)).
1 8In equilibrium, surprise attacks never occur, but the commitment problem forces the modeler to consider the most pro…table unilateral deviations.
1 9
In Morelli and Rohner (2014) we focused on the second interpretation of intermediate probabilities, but allowed for arbitrary weights, such thatp=ps(1 ) +pn for any 2(0;1).
2 0
We are implicitly assuming here that the destruction of a war concerns exclusively (or mostly) the "other" sectors, leaving unchanged the present discounted value of natural resource extraction rents, ourRvariables. Esteban, Morelli and Rohner (2015) present evidence that civil wars imply mainly and disproportionately destruction of other types of wealth and income prospects (section 6.2): Typically only a small fraction of natural resources to be extracted in the future can be damaged by a war, while a substantial part of the non-resource income and accumulated physical capital is often destroyed, partly because it is a vital input for the capacity of a …ghting group or state in a con‡ict. Oil …elds and diamond mines (and especially their future productivity) "survive" …ghting, while other sectors su¤er considerably from political instability.
2 1This condition follows from the fact that i’s expected payo¤ is (R
1+R2) under peace andpsR1 csi under
corresponds to:22
n=pn+cnj=(R1+R2):
Given these two incentive compatibility constraints, proposition 1 below easily follows.
Proposition 1 The game has a unique subgame perfect Nash equilibrium outcome for every set of
parameters. i) If s < n, then group j selects = s, and peace prevails. ii) If s > n, then
regardless of the selected by groupj in the initial stage both groups select con‡ict in the war-peace
subgame. In other words, con‡ict arises in equilibrium if and only if
(ps pn)R1> pnR2+csi+cnj: (1)
Proof. Omitted.
Given that war is unavoidable for all parameter values such that s> n, we can perform some
interesting comparative statics, making statements about under what economic and geographic
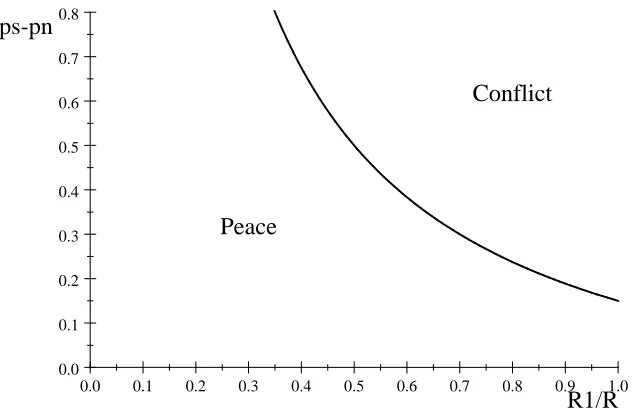
conditions civil war is more likely to be unavoidable.23 IfR1 is su¢ ciently high andR2 and con‡ict
costs su¢ ciently low, war will arise.
Figure 124 displays the zone where a peace equilibrium exists (labelled "Peace") and the zone
where con‡ict can never be avoided (labelled "Con‡ict"). We can see that bargaining failure
happens when the share of a given amount of natural resources that are situated in region 1,
R1=R, is large, and when the group out of power has a substantially larger winning probability in
secessionist than in nationwide con‡ict, i.e. when ps pn is large.
So far ps and pn have been treated as blackboxes. We now analyze the main determinants of
relative strength, and hence of the probability of winning, leading to additional testable
implica-tions.
The probability with which iwins a nationwide con‡ict can be expressed as:
pn=
Niyi Niyi+Njyj+
where measures the extra strength of groupj due to the control of the government and perhaps
the army. In this contest success function (CSF) the ratio of total wealth matters. Like Jackson
2 2This follows from the fact thatj’s expected payo¤ is(1 )(R
1+R2)under peace and(1 pn)(R1+R2) cnj
under nationwide con‡ict.
2 3Note that it would not help to allowjto choose two separate sharing rules,
1; 2, for the two regions: in fact, if the parameters are such that no exists to make peace an equilibrium in the subsequent subgame, then trivially it is not possible to …nd any peace inducing pair 1; 2, since if this were possible then there would exist 0 such that
0(R
1+R2) = 1R1+ 2R2that would work, a contradiction. 2 4
0.0 0.1 0.2 0.3 0.4 0.5 0.6 0.7 0.8 0.9 1.0 0.0
0.1 0.2 0.3 0.4 0.5 0.6 0.7 0.8
R1/R
ps-pn
Peace
Conflict
Figure 1: Zones of parameter values for peace and con‡ict
and Morelli (2007) and Esteban and Ray (2011) we assume a group’s probability of winning to
be increasing in its wealth. Finally, this expression allows for the obvious relevance of population
sizes, especially in traditional warfare that is typical of many civil con‡icts.
Consistently, group i’s winning probability in secessionist con‡ict can be expressed as follows:
ps=
Ni1yi
Ni1yi+Nj1yj+ =(1 + )
where the government’s advantage of controlling a standing army ( ) is discounted by(1 + ), and
is a non-negative parameter that is an increasing function of the geographical distance between
the secessionist homelands and the capital. This is in line with the idea that the military power
of the government decays when projected at a large distance (see e.g. Boulding, 1962). It is also
consistent with the literature …nding that geographical remoteness and ideological recruitment
provide a larger advantage for groupiin secessionist than in nationwide wars (see e.g. Gates, 2002;
Buhaug, Gates and Lujala, 2009). The parameter also depends on various factors that a¤ect the
scope for hide-and-ambush guerrilla insurgency. Note also that in case of a secessionist con‡ict the
men used are only those in the con‡ict region.25 Using the explicit dependence of ps and pn on
the distribution of populations of the di¤erent groups in the territory, the condition for bargaining
failure becomes
Ni1yi
Ni1yi+Nj1yj+ =(1 + )
Niyi Niyi+Njyj+
!
R1>
Niyi Niyi+Njyj+
R2+csyi+cnyj: (2)
This reveals that for various possible parameter values civil war is on average more likely when the
minority groupiis very concentrated (large N1
i) and the corresponding region relatively homoge-neous (lowNj1). All the relevant comparative statics are summarized as follows:
Corollary 1 Con‡ict occurs for a larger set of the other parameters when
1. more natural resources are located in the region of the powerless group for any …xed total
amount of natural resources;
2. the di¤ erence between the probabilities of winning in secessionist and nationwide con‡ict for
the group out of power is larger;
3. war is less destructive;
4. the powerless group is more concentrated in a relatively homogeneous region, i.e. Ni1=Nj1 and
N1
i=Ni2 are larger;
5. the region of the group out of power is further away from the capital, i.e. is greater.
No clear and unambiguous comparative statics result can instead be given with respect to yi
andyj, since for example an increase inyimay increase the left-hand-side of (2) looking at the …rst
term in the presence of group concentration, but a¤ects of course the cost part as well, hence the
sign of the e¤ect depends on many parameters.
3
Empirical Analysis
The existing empirical literature on natural resources and civil war has two main weaknesses: First,
it only studies the e¤ects of the totalamountof natural resources and not of theirgeographical
dis-tribution. Second, it studies the impact of natural resource abundance mostly on the country level
rather than on the ethnic group level. On such an aggregate level of analysis there is more
unob-served heterogeneity in the data, and some of our predictions relate to ethnic group characteristics,
which calls for a test on this disaggregated level.
To address these concerns, we will now perform our own empirical analysis. First, we will use
panel data on the country level and construct our novel oil inequality measure. Based on
how unevenly petrol …elds are spread between di¤erent ethnic groups in a given country. Using a
standard speci…cation of control variables and including country …xed e¤ects, we will demonstrate
that petrol unevenness has a positive and signi…cant e¤ect on the likelihood of civil con‡ict.
Afterwards, we will move to a panel on the ethnic group level. Using a variety of control
variables, as well as country …xed e¤ects / ethnic group …xed e¤ects, it will be shown that indeed
the ethnic groups out of power who are relatively oil rich with respect to the rest of the country
will be signi…cantly more likely to be involved in civil con‡ict. We also …nd that the interaction
terms between oil abundance and group concentration, resp. distance from capital are positive and
signi…cant, pointing out that indeed civil wars are more likely whenR1=(R1+R2) and ps pn are
both large, as predicted by our theory.
3.1 Empirical Analysis: Country Level
Our goal in this section is to analyze how the unevenness of geographical distribution of petrol
…elds across ethnic groups in a given country impacts on the likelihood of con‡ict. For this purpose
we have put together a panel of 157 countries with sample period 1960-2008, and have constructed
a novel variable, Oil Gini, which we will describe in more detail below. In our regressions we use
–in addition to our main, new variable of interest– the standard battery of control variables, as
well as country …xed e¤ects and annual time dummies. Below we start by describing the data in
some detail.
3.1.1 Data and Speci…cation
Given that our theory focuses on bargaining failure to avoid con‡ict outbreaks, a natural choice of
dependent variable is the onset of civil con‡icts. The source of the civil war data is "UCDP/PRIO
Armed Con‡ict Dataset" (UCDP, 2012), which is the most commonly used standard data source
for civil wars at the country level26. We focus on the widely used standard de…nition of civil war,
counting a country and year as having a civil war when at least 1000 casualties are recorded in a
given year. Our con‡ict onset variable takes a value of 1 when a new civil war starts, is coded as
missing during wars (where by de…nition a war cannot newly start), and is coded as 0 for peace.
In a robustness check we will also show that our results are robust when focusing on war incidence
as dependent variable (where ongoing wars are also coded as one).27
2 6This dataset has been used, among others, by Besley and Persson (2011) and Esteban, Mayoral and Ray (2012). 2 7
To construct our main novel Oil Gini measure, we started out from the ethnic group level.
First, we constructed a panel dataset on the ethnic group and year level using the sample of ethnic
groups in the "Geo-referencing of ethnic groups" (GREG) dataset (Weidmann, Rod and Cederman,
2010).28 Relying on maps from the classical "Soviet Atlas Narodov Mira" from 1964 (Bruk and
Apenchenko, 1964), which is still very extensively used for the construction of ethnolinguistic
fractionalization (ELF) indices, GREG is a geo-referenced dataset containing the coordinates of
the group boundaries of 1120 ethnic groups.
One major advantage of this dataset is that it provides a global coverage of ethnic groups for the
whole world, containing relatively precise information on the geographical location of groups, which
enables us to merge it with other geo-referenced group-level data using Geographical Information
Systems (GIS). In contrast, the main alternative datasets on ethnic groups like the "Minorities at
Risk" (Minorities at Risk, 2009), the "Ethnologue" (Lewis, 2009), and the lists of ethnic groups
from Alesina et al. (2003), resp. Fearon (2003) lack detailed geographical information on the
location of ethnic groups in all countries.29
The fact that the GREG data is a non-time varying snapshot from the early 1960s has both
advantages and disadvantages. On the negative side, it implies that in some instances the group
boundaries are not fully accurate in recent decades, although thankfully group borders generally
evolve very slowly over time. The fact that the group border information is not time-varying lowers
accuracy and hence adds noise to our estimations, which biases the magnitude of coe¢ cients and
the signi…cance levels downwards, while there seems to be no other obvious bias of the results. This
means that using GREG will tend to bias the results against us and this attenuation bias makes
them appear less strong than they are in reality.
On the positive side, using ethnic group borders from the beginning of our sample –which hence
pre-date the con‡ict observations in our regressions– has the advantage to alleviate concerns of
ethnic group locations being endogenous to the wars that we want to explain. Still, there remains
the possibility that past wars and existing oil …elds had some impact on location patterns of ethnic
groups –although such concerns are of course alleviated by the fact that ethnic group homelands
2 8Throughout the database construction we use the country borders from the time-varying, geo-referenced "CShapes" dataset (Weidmann, Kuse, and Gleditsch, 2010).
are very stable. To address such remaining concerns we control for past con‡ict in all regressions
and we include additional robustness tables in the appendix showing that our results also hold for
a restricted sample that includes only observations of countries that did not have oil in 1964 when
the "Soviet Atlas Narodov Mira" underlying GREG was put together.
Using GIS-Software (ArcGIS) we have then merged the GREG data with the geo-referenced
petroleum dataset (PETRODATA) from Lujala, Rod and Thieme (2007), which documents where
oil …elds lie. Given that discovery dates of oil …elds are available, this allowed us to construct a
time-varying map of oil …elds. Combining this information with the ethnic group data we were able
to compute for every country and year the area occupied by a given ethnic group and also the area
occupied by oil …elds lying in the ethnic group’s territory. Using this information, and the standard
formula of the GINI inequality index, we were able to compute a novel, time-varying measure of
the unevenness of oil …eld distribution across ethnic groups for a given country and year, which
we call the Oil Gini variable.30 Focusing on the inequality of oil …elds between the homelands of
ethnic groups, this measure captures well the logic of our model. For secession incentives it does
not only matter who currently controls oil revenues, but even more important is the distribution
of oil money between ethnic groups after a potential secession.
It is important to note the limits of the Oil Gini measure. Given that we lack data on the
amounts of oil produced by ethnic groups, and only have data on the territory covered by oil, our
novel Oil Gini variable is not a perfect measure of oil unevenness, but rather an imperfect proxy.
However, the statistical noise of this measure does not appear biased in any particular direction.
Hence, we expect our results to be conservative estimates su¤ering from attenuation bias, which
makes our …ndings appear weaker that they are in reality.
Note also that for constructing the Oil Gini measure and the underlying ethnic group level
measure of R1=R we take oil discoveries as exogenous. While it has indeed been stressed in the
literature that oil discoveries have a very important random element (see Lei and Michaels, 2014),
it could still be that in productive and well-governed countries mining companies are keener to
invest (which would bias downward the coe¢ cient of variables capturing the total amount of oil).
This concern is alleviated by the fact that we control in all speci…cations for GDP per capita and
democracy scores. Further, given that our results on oil inequality hold when we control for the
total amount of oil, any bias in the total quantity of oil discovered should not bias our results.
In contrast, it would be more problematic if oil inequality was a¤ected by endogenous drilling
e¤orts. It however seems unlikely that investors or governments would deliberately miss out on
opportunities for oil discoveries for strategic reasons. Still, as we show in the ethnic group level
analysis below, what drives the impact of oil inequality on con‡ict are oil …ndings in ethnic minority
homelands (i.e. spikes inR1=R) and it seems particularly unlikely that investors or a government
in a con‡ict-prone environment would strategically favor drilling in an ethnic minority region over
oil extraction in other regions. Hence, we don’t expect an upward bias in our estimates.
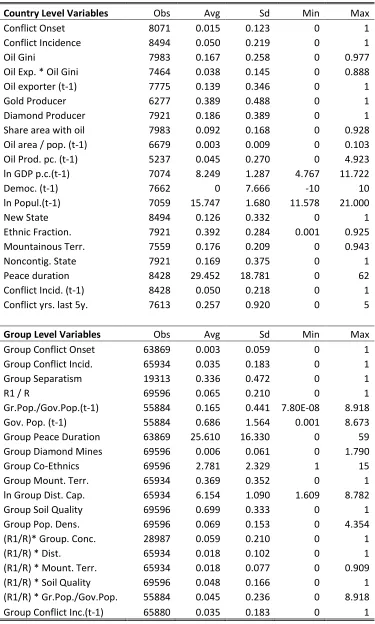
Given that our Oil Gini is a novel measure, we shall now brie‡y describe its main summary
statistics. First of all, we should point out that this new measure is only weakly correlated to other
key covariates of con‡ict. To just mention two particularly important ones, the correlation of Oil
Gini with the per capita oil production (from Humphreys, 2005) is -0.042, while the correlation of
Oil Gini with GDP per capita (from Heston, Summers, and Aten, 2011) is -0.145.
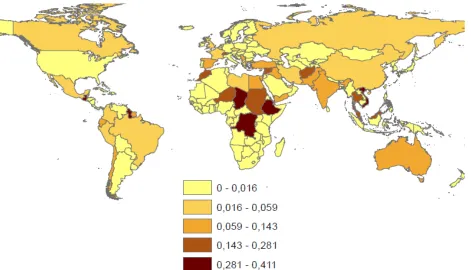
In Figure 2 in the Appendix we display the country means ofOil Gini over the sample duration
(1960-2008). There is quite some heterogeneity across countries, with the highest Oil Gini values
found in African and Asian countries. This is intuitive: while in places with little oil (e.g. Europe)
or huge amounts of oil (e.g. the Arabic peninsula) oil inequality is on average low, it is much higher
in places like Africa or Asia where there are substantial oil …elds, which however are scattered and
punctual rather than covering the whole territory, as often the case in the Gulf states.
Similarly, in Figure 3 in the Appendix we display the country-level standard deviation over the
sample period. Strikingly, the variance in Oil Gini is biggest in Africa (and some parts of Asia)
where many of the new oil discoveries of the past decades took place. Interestingly, Africa and Asia
are also the two continents where the risk for civil war onsets was the highest in the past decades
(the average risk of new civil war onsets was 2.4 percent per year in Africa-Asia, while it was only
0.6 percent in the rest of the world).
In our regression analysis we use a standard battery of control variables, which results in a
speci…cation that is extremely close to the core speci…cations run by Fearon and Laitin (2003),
Collier and Hoe- er (2004), Montalvo and Reynal-Querol (2005), Cederman and Girardin (2007),
Collier and Rohner (2008), and Esteban, Mayoral and Ray (2012). Like these papers, we control for
natural resource abundance (i.e., an updated version of Fearon and Laitin’s (2003) "oil exporter"
variable), GDP per capita, democracy, population size, whether a state was recently created, ethnic
fractionalization, geography (mountainous terrain and noncontiguous states), and peace duration.
In robustness checks we control for alternative war persistence measures (lagged war incidence, the
number of war years in the last …ve year period), and alternative natural resource measures (gold
producer, diamond producer, oil production per capita etc). All these variables are described in
more detail in Appendix B. To account for omitted variable bias and unobserved heterogeneity
the robust standard errors to be clustered at the country level. We will as default run linear
probability models, which have the advantage of providing easily interpretable coe¢ cients and of
allowing for clustered standard errors in the presence of country …xed e¤ects. We will however
show in a robustness check that the results go through when using conditional logit.
To summarize, we estimate the following main speci…cation (see column 3 of Table 1):
W arc;t= Oil_Ginic;t+X0c;t +Yc0 +Z0t +uc;t
where X0c;t is a vector of time-varying and country-varying control variables, Y0c is a vector of country …xed e¤ects, Z0
t is a vector of annual time dummies, and uc;t is the error term. The coe¢ cient of interest is , which our theory predicts to be of positive sign.
3.1.2 Results
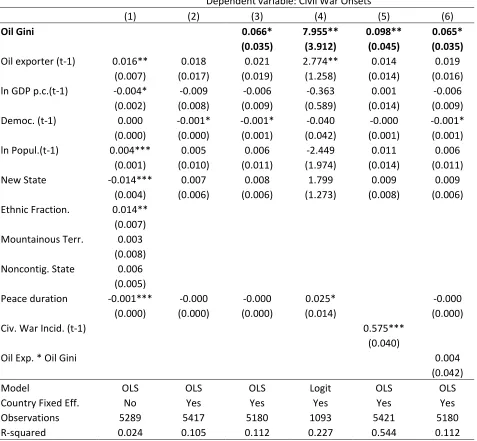
In Table 1 we display the results of the country level regressions. In the …rst column we run a linear
probability model with just the battery of standard controls, but without our newOil Gini measure.
For comparability with most papers in the existing literature (e.g. the classic article of Fearon and
Laitin, 2003) we focus on a speci…cation without country and time …xed e¤ects, where standard
errors are left unclustered. Besides the "New State" variable, all other variables have the expected
sign. In line with the existing literature (see e.g. Fearon and Laitin (2003), Collier and Hoe- er
(2004), Montalvo and Reynal-Querol (2005), Cederman and Girardin (2007), Collier and Rohner
(2008), and Esteban, Mayoral and Ray (2012)), we …nd that oil abundant, ethnically fractionalized
and very populated states with low GDP per capita and a track record of past violence are more
likely to experience civil war onsets.
In column 2 we add country …xed e¤ects and annual time dummies, and allow for robust
standard errors to be clustered at the country level, in the goal of addressing omitted variable bias
and unobserved heterogeneity. As noted in the literature (Fearon and Laitin, 2003; Collier and
Hoe- er, 2004; Sambanis, 2004; Collier, Hoe- er and Rohner, 2009) adding country …xed e¤ects
tends to remove the signi…cance of most variables in such civil war regressions. In column 3 we
now add our new Oil Gini measure, which has the expected sign and is signi…cant at the 10%
level. Its e¤ect is quantitatively important: Moving a country from full ethnic oil equality to full
oil inequality increases the risk of war onsets by 6.6 percentage points, which is more than four-fold
the baseline risk of 1.5 percentage points.
In columns 4 and 5 it is shown that the e¤ect of Oil Gini is robust to running logit regressions
Dependent variable: Civil War Onsets
(1) (2) (3) (4) (5) (6)
Oil Gini 0.066* 7.955** 0.098** 0.065*
(0.035) (3.912) (0.045) (0.035)
Oil exporter (t-1) 0.016** 0.018 0.021 2.774** 0.014 0.019
(0.007) (0.017) (0.019) (1.258) (0.014) (0.016)
ln GDP p.c.(t-1) -0.004* -0.009 -0.006 -0.363 0.001 -0.006
(0.002) (0.008) (0.009) (0.589) (0.014) (0.009)
Democ. (t-1) 0.000 -0.001* -0.001* -0.040 -0.000 -0.001*
(0.000) (0.000) (0.001) (0.042) (0.001) (0.001)
ln Popul.(t-1) 0.004*** 0.005 0.006 -2.449 0.011 0.006
(0.001) (0.010) (0.011) (1.974) (0.014) (0.011)
New State -0.014*** 0.007 0.008 1.799 0.009 0.009
(0.004) (0.006) (0.006) (1.273) (0.008) (0.006)
Ethnic Fraction. 0.014**
(0.007)
Mountainous Terr. 0.003
(0.008)
Noncontig. State 0.006
(0.005)
Peace duration -0.001*** -0.000 -0.000 0.025* -0.000
(0.000) (0.000) (0.000) (0.014) (0.000)
Civ. War Incid. (t-1) 0.575***
(0.040)
Oil Exp. * Oil Gini 0.004
(0.042)
Model OLS OLS OLS Logit OLS OLS
Country Fixed Eff. No Yes Yes Yes Yes Yes
Observations 5289 5417 5180 1093 5421 5180
R-squared 0.024 0.105 0.112 0.227 0.544 0.112
Notes: Dependent variable: Civil war onset (unless in column 5 where the dependent variable is Conflict incidence). The dependent variable is coded as 1 if a conflict causing at least 1000 fatalities is starting in a given year. Sample period: 1960-2008. Number of countries for which observations are available: 157. From column 2 onwards unreported country fixed effects and annual time dummies are included, and robust standard errors are allowed to be clustered at the country level (unless in the conditional logit regression of column 4 where clustering of standard errors is not possible). Significance levels: * p<0.1, ** p<0.05, *** p<0.01.
variable: In both columns,Oil Gini has a positive sign and is signi…cant at the 5 percent level.
In column 6 we also include an interaction term of Oil Gini and our dummy variable taking a
value of 1 for big oil exporting countries. The coe¢ cient ofOil Gini remains positive and signi…cant,
while the interaction term also has the expected positive sign, but is not statistically signi…cant.31
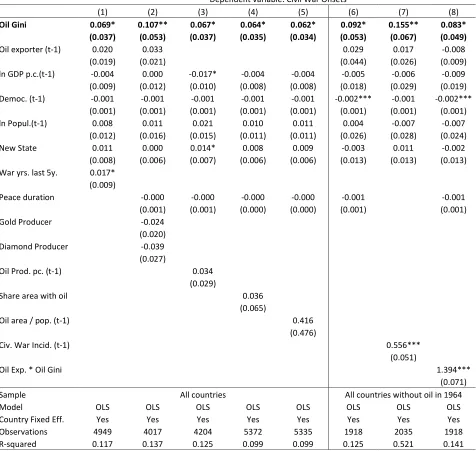
In Table 3 in Appendix A we provide some additional results. First, columns 1-5 show that Oil
Gini continues to be statistically signi…cant and to have a coe¢ cient of similar magnitude when
we control for an alternative war persistence variable and for other natural resource measures (gold
producer, diamond producer, oil production per capita, share of a country’s area covered with oil,
and oil area / population). In columns 6-8 we re-run the main regressions of columns 3, 5 and 6
of Table 1, but restricting the sample to observations from countries that did not have oil in 1964
when the "Atlas Narodov Mira" (Bruk and Apenchenko, 1964) –which is the primary source for
our geo-referenced ethnic group location dataset–was put together. This restriction of the sample
serves the purpose of alleviating concerns that oil abundance could have a¤ected the location of
ethnic groups. Even in these very demanding regressions run on a restricted sample our main Oil
Gini variable has the expected sign and is statistically signi…cant. Interestingly, also the interaction
term of Oil Gini with Oil Exporter in column 8 is of the expected positive sign and statistically
signi…cant.
3.2 Empirical Analysis: Ethnic Group Level
To test the predictions of our theory on the impact of the relative oil richness of the ethnic groups
on civil war onsets, we have put together a panel dataseton the ethnic group level, covering 1120
ethnic groups and spanning over the period 1960-2006. In particular, we include all ethnic groups
of the "Geo-referencing of ethnic groups" (GREG) dataset (Weidmann, Rod and Cederman, 2010),
and construct group level variables that capture closely the expressionR1=(R1+R2) of the model,
as explained above. There is a small number of papers in the literature that study civil war on
the ethnic group level (e.g., Walter, 2006; Cederman, Buhaug and Rod, 2009), but these papers
typically either ignore natural resources or use a natural resource abundance variable at the
country-level, which does not allow to capture unevenness of natural resource distribution.32 Hence, to the
3 1
Note that while the focus of this paper lies on oil inequality, an auxiliary implication of the model is that –for a …xed resource inequality– a general increase in resources is expected to increase the con‡ict risk. The empirical support for this auxiliary implication of our model is rather weak. In Table 1, for example, the resource abundance variable "Oil exporter" has always the expected positive sign, but is only statistically signi…cant in two out of six columns. One potential explanation for the weak direct e¤ect of oil abundance is the inclusion of country …xed e¤ects that are indispensable for a tight identi…cation strategy, but which remove all cross-sectional variation in oil abundance.
3 2
best of our knowledge we are the …rst ones to study civil war using a panel of all ethnic groups
with natural resource variables that vary for di¤erent ethnic groups.
Looking at this disaggregated level of analysis has several advantages: With more …ne grained
data typically unobserved heterogeneity and omitted variable problems are reduced. Further,
study-ing group level data also allows us to better discriminate between our mechanism and others. Our
theory predicts that con‡icts become more likely to break out if a powerless ethnic minority group
becomes very oil rich. In contrast, alternative theories may predict con‡ict onsets when the oil
abundance of the governing ethnic group’s homelands rises. So far, our country level regressions
only established the link between inter-ethnic oil unevenness and civil war onsets, without being
able to distinguish between our theory and alternative theories stressing for example war triggered
by oil rich governing groups. In contrast, the ethnic group level regressions below will be able
to distinguish between such di¤erent mechanisms, and assess whether the dangerous type of oil
unevenness is indeed the one where powerless groups are oil abundant, as predicted by our theory.
3.2.1 Data and Speci…cation
The main dependent variable is civil war onset at the group level and is taken from Cederman,
Buhaug and Rod (2009). It varies on the ethnic group and year level and takes a value of 1 when
in a given year a civil war newly starts that involves a given ethnic group. It is coded as missing
for ongoing wars, and as 0 if the ethnic group is not involved in a civil war in a given year.
Our main independent variable is the surface of an ethnic group’s territory covered with oil
and gas as a percentage of the country’s total surface covered with oil and gas. This proxies
well R1=(R1 +R2). To construct this measure, we used as starting point all ethnic groups in
the "Geo-referencing of ethnic groups" (GREG) dataset (Weidmann, Rod and Cederman, 2010),
which allowed us to know the geographical coordinates of where a given ethnic group is located.
Then we merged this with the geo-referenced petroleum dataset (PETRODATA) from Lujala, Rod
and Thieme (2007), which documents where oil …elds lie and when they have been discovered.
Combining this information we were able to compute a variable measuring which part of the
territory occupied by a given ethnic group contains oil. Expressing this in terms of the total
surface containing oil in the country, we obtain a quite precise, time-varying measure of how
relatively petrol-rich the homelands of a given ethnic group are.
We also include various control variables on the ethnic group level. In particular, we include
two time-varying demographic controls, Group Population / Governing Groups’ Population and
Governing Groups’Population from Cederman, Buhaug and Rod (2009). Note that while the
pop-ulation estimates of each ethnic group are not time varying, the composition of groups controlling
the government is time varying, which makes these measures time-varying. Further, we construct
di¤erent war persistence measures (Group Peace Duration, and lagged Group War Incidence). In
addition, we control for several time-invariant geographical and demographic factors, i.e. Group
Diamond Mines (constructed using raw data from Gilmore et al., 2005), Group co-ethnics abroad
(constructed based on the GREG dataset), Group’s share of mountainous terrain and ln group’s
distance to capital (from Cederman, Buhaug and Rod, 2009),Group’s soil quality (constructed
us-ing the Harmonized World Soil Database from Fischer et al., 2008), and Group population density
(constructed using the geo-referenced population density data from the Socioeconomic Data and
Applications Center at Columbia University, see Sedac, 2012).
Further, we also include in some speci…cations interaction terms of our main independent
vari-ableR1=(R1+R2)with, among others, a group concentration measure constructed using raw data
from Alesina and Zhuravskaya (2011), and with a group distance from capital measure (as described
above). All these variables are described in more detail in Appendix B.
Finally, we also include –but do not report–all country-level standard control variables included
in the country-level regressions above and annual time dummies. Like in the country-level
regres-sions above we allow robust standard errors to be clustered at the country level. As above, we also
run as main speci…cations linear probability models, but show that the results are robust to the
use of conditional logit estimators.
To summarize, we estimate the following main speci…cation (corresponding to column 3 of Table
2):
W are;t= (R1=R)e;t+W0e;t +X0c;t +Y0e +Z0t +ue;t
where W0e;t is a vector of time-varying and ethnic group-varying control variables, X0c;t is a vector of time-varying and country-varying control variables, Y0e is a vector of ethnic group …xed
e¤ects,Z0tis a vector of annual time dummies, andue;tis the error term. The coe¢ cient of interest is , which our theory predicts to be of positive sign.
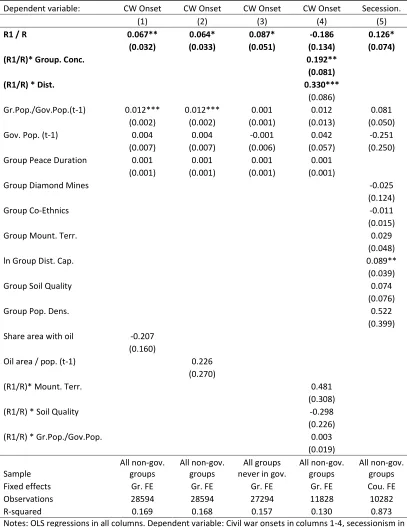
3.2.2 Results
The focus of our empirical analysis is to assess whether con‡ict indeed becomes more likely when
is large, as predicted by the theory. Hence, for most of our regressions, namely in the main table
2, in the Appendix Table 4 and in the …rst four columns of the Appendix Table 5, we will use the
sample of all ethnic groups that are out of power, which corresponds to the largest part of all ethnic
groups (i.e. on average about 83% of all ethnic groups are non-governing groups).33 As discussed
in more detail below, in the columns 5-6 of the Appendix Table 5 we run as Placebo test the main
regressions on a sample of governing groups.
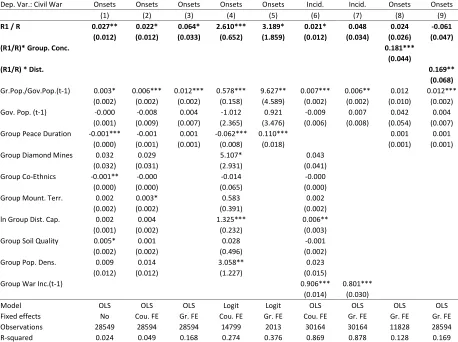
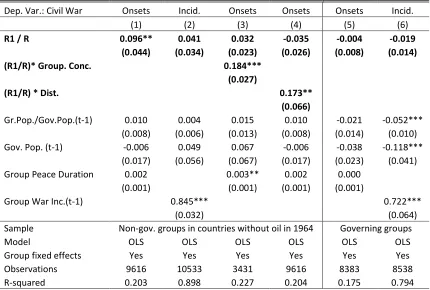
In the …rst column of table 2 we regress for a pooled panel our main dependent variable, Civil
War Onsets, on the main independent variable R1=R (where R R1+R2) and on all controls
mentioned above. Our main variableR1=R has the expected positive sign and is signi…cant at the
5% level. The e¤ect is sizeable: If an initially oil-less ethnic group has after a discovery all the
country’s oil …elds on its territory, the risk of being involved in a civil war onset is increased by 2.7
percentage points, which is about 8-times larger than the relatively small baseline risk for a group
to be involved in a con‡ict onset, which is of 0.3 percentage points.
About half of the control variables are signi…cant. Larger ethnic groups and groups occupying
valuable soils are more likely to be involved in con‡ict onsets, while groups with a peaceful past
and ethnic groups with co-ethnics in many other countries are less likely to be involved in civil war
onsets.
In column 2 we run the same speci…cation, but now including country …xed e¤ects. Our main
variable R1=R remains signi…cant, with a coe¢ cient of similar size. In column 3 we now include
group …xed e¤ects. This is a very demanding speci…cation, as all time-invariant group characteristics
are controlled for by the group …xed e¤ects (which implies that all time-invariant variables drop
from the speci…cation) and the results are purely driven by within-group changes of relative resource
abundance over time. Even in this very demanding speci…cation our main independent variable
R1=Rremains statistically signi…cant (the p-value is 0.053), with now a somewhat larger coe¢ cient.
In columns 4 and 5 we show that the results of columns 2 and 3 are robust to running conditional
logit estimations with country, respectively group …xed e¤ects, instead of the linear probability
models used before.
In columns 6 and 7 we run the same regressions like in columns 2 and 3, but with civil war
incidence rather than civil war onsets as dependent variable. While our main variableR1=Rremains
signi…cant in the presence of country …xed e¤ects, it drops below the 10% signi…cance threshold
when group …xed e¤ects are included. This suggest that indeed our theory is better at predicting
the break-outs of wars due to bargaining failure rather than war duration, which also depends on
3 3
additional factors.
Our theory predicts that not only R1=R will be a main driving factor of bargaining failure
to prevent war, but that also the di¤erence between the winning prospects in secessionist versus
in nationwide wars, ps pn, matters. As shown in Corollary 1, the wedge between ps and pn is
typically larger when a given ethnic group is very concentrated and located far from the capital.
In column 8 we hence interact our main variable of relative resource abundance, R1=R, with a
measure of group concentration ranging from 0 to 1, constructed with raw data from Alesina and
Zhuravskaya (2011). While this is the most precise available data for our purpose, it only covers
a subset of our ethnic groups, leading to a drop in the sample size. It is also a time-invariant
variable, meaning that the baseline group concentration variable drops from the speci…cation as
we include group …xed e¤ects, and only its interaction withR1=Rremains in the speci…cation. We
…nd a quantitatively strong e¤ect of the interaction term that is signi…cant at the 1% level, and
also R1=Rand (R1=R) * Group Concentration are jointly statistically signi…cant at the 1% level.
This highlights that indeed civil con‡ict outbreaks are most likely whenR1=Randps pnare both
large, as shown in Corollary 1 and displayed graphically in Figure 1.
In column 9 we include the interaction of our R1=R variable with a dummy of above-median
distance from the capital. In line with Corollary 1 we again expect this interaction term to be
positive. Indeed, we …nd a quantitatively large, positive coe¢ cient of this interaction term that is
statistically signi…cant at the 5% level. The variablesR1=Rand (R1=R)* Distance from capital are
jointly signi…cant at the 5% level. These …ndings are consistent with our theory’s prediction that
indeed civil con‡ict outbreaks are most likely whenR1=Rand ps pc are both large.
In the Appendix Table 4 we perform several robustness checks. In column 1 we control for
the percentage of the country’s area covered by oil. The variable of interestR1=Rcontinues to be
signi…cant at the 5% level, while this new control variable is not statistically signi…cantly di¤erent
from zero. Similarly, in column 2 we have as additional control variable the country’s oil area per
capita. While this new control is not statistically signi…cant, our variable of interestR1=Ris still
statistically signi…cant.34
One potential concern of our analysis could be that oil discoveries and con‡ict may a¤ect the
likelihood of a given ethnic group to reach power. Hence, in column 3 we replicate the baseline
speci…cation of column 3 of Table 2, but only including in the sample ethnic groups thatnever reach
3 4
Dep. Var.: Civil War Onsets Onsets Onsets Onsets Onsets Incid. Incid. Onsets Onsets
(1) (2) (3) (4) (5) (6) (7) (8) (9)
R1 / R 0.027** 0.022* 0.064* 2.610*** 3.189* 0.021* 0.048 0.024 -0.061
(0.012) (0.012) (0.033) (0.652) (1.859) (0.012) (0.034) (0.026) (0.047)
(R1/R)* Group. Conc. 0.181***
(0.044)
(R1/R) * Dist. 0.169**
(0.068) Gr.Pop./Gov.Pop.(t-1) 0.003* 0.006*** 0.012*** 0.578*** 9.627** 0.007*** 0.006** 0.012 0.012***
(0.002) (0.002) (0.002) (0.158) (4.589) (0.002) (0.002) (0.010) (0.002)
Gov. Pop. (t-1) -0.000 -0.008 0.004 -1.012 0.921 -0.009 0.007 0.042 0.004
(0.001) (0.009) (0.007) (2.365) (3.476) (0.006) (0.008) (0.054) (0.007) Group Peace Duration -0.001*** -0.001 0.001 -0.062*** 0.110*** 0.001 0.001
(0.000) (0.001) (0.001) (0.008) (0.018) (0.001) (0.001)
Group Diamond Mines 0.032 0.029 5.107* 0.043
(0.032) (0.031) (2.931) (0.041)
Group Co-Ethnics -0.001** -0.000 -0.014 -0.000
(0.000) (0.000) (0.065) (0.000)
Group Mount. Terr. 0.002 0.003* 0.583 0.002
(0.002) (0.002) (0.391) (0.002)
ln Group Dist. Cap. 0.002 0.004 1.325*** 0.006**
(0.001) (0.002) (0.232) (0.003)
Group Soil Quality 0.005* 0.001 0.028 -0.001
(0.002) (0.002) (0.496) (0.002)
Group Pop. Dens. 0.009 0.014 3.058** 0.023
(0.012) (0.012) (1.227) (0.015)
Group War Inc.(t-1) 0.906*** 0.801***
(0.014) (0.030)
Model OLS OLS OLS Logit Logit OLS OLS OLS OLS
Fixed effects No Cou. FE Gr. FE Cou. FE Gr. FE Cou. FE Gr. FE Gr. FE Gr. FE
Observations 28549 28594 28594 14799 2013 30164 30164 11828 28594
R-squared 0.024 0.049 0.168 0.274 0.376 0.869 0.878 0.128 0.169
Notes: Dependent variable: Civil war onsets (unless when specified differently in row 1). Sample period: 1960-2006. Number of non-governing ethnic groups for which observations are available: 930. In all columns the unreported set of country level controls of Table 1 and annual time dummies are included, and robust standard errors are allowed to be clustered at the country level (unless in the conditional logit regressions of columns 4-5 where clustering of standard errors is not possible). Significance levels: * p<0.1, ** p<0.05, *** p<0.01.
power (i.e. which are never part of the government coalition during the entire sample period). Also
for this sample our main variableR1=Rremains signi…cant.35
In column 4 we replicate our …ndings on the interaction terms of (R1=R) with group
concen-tration and distance from capital, respectively, but including a further set of controls variables.
In particular, we include as additional controls the interaction of (R1=R) with the share of
moun-tainous terrain in the ethnic group’s homelands, with soil quality, and with the ratio of group
population over government population. The coe¢ cients of (R1=R) * Group Concentration and
(R1=R) * Distance from capital are still positive and signi…cant as expected.
Finally, column 5 shows that our main variableR1=Rcan also explain the presence of separatist
movements in a given ethnic group. Given that this variable is ethnic group speci…c, but not
time-varying, we are only able to include country …xed e¤ects, but not group …xed e¤ects.
The Appendix Table 5 provides additional results. In order to alleviate concerns of oil abundance
a¤ecting ethnic group location, we restrict in columns 1-4 the sample to groups from countries that
did not have oil in 1964, which is the year when our primary ethnic group location data was put
together. Column 1 replicates the main regression of column 3 of Table 2 for this restricted sample
…nding still a positive coe¢ cient of comparable size that is signi…cant at the 5% level. Also the
regression of column 2 –which mirrors the war incidence regression of column 7 of Table 2– …nds
like before in Table 2 a positive coe¢ cient that however is not quite statistically signi…cant. Like
before in the columns 8-9 of Table 2, we …nd in columns 3-4 that the interaction terms of R1=R
and group concentration, resp. distance from capital are statistically signi…cant.
The columns 5-6 re-run the main regressions of columns 2 and 7 of Table 2, but this time for
governing rather than for non-governing groups. According to our theory the expression R2=R
that captures resource abundance of the governing group should –if anything–decrease the risk of
civil war. We …nd indeed a negative coe¢ cient which is however imprecisely estimated and not
statistically signi…cant. This is unsurprising given the smaller sample size. Still, running such a
regression on a sample of governing groups and …nding a non signi…cant coe¢ cient of interest being
of opposite, negative sign alleviates concerns that our main results could be driven by some other
channel outside our model leading mechanically to more con‡ict in resource rich groups.
3 5
4
Conclusion
This paper employs a simple model to capture how the geographical distribution of natural resources
within a country can a¤ect the risk of civil war. We have allowed for uneven resource abundance
and two di¤erent forms of con‡ict, secessionist and nationwide, and found that bargaining fails to
prevent costly con‡ict if an ethnic minority group is located in a region that is particularly rich in
natural resources (relative to the rest of the country) and if its winning probability for the case of
secessionist con‡ict is substantially larger than for nationwide con‡ict. This leads to the presence
of two relevant threat points for war, which cannot be addressed at the same time by bargaining.
This rationale for bargaining breakdown due to multiple types of civil war is not only interesting
per se, but it is also shown to …t with most existing empirical …ndings and with the estimations
on our newly constructed data sets with detailed geographic information about ethnic groups and
resources.
The analysis of the conditions under which discovery of new resources in a developing country
can lead to development without con‡icts is still incomplete. This paper has highlighted the
signi…cance of resource concentration and group concentration for civil war, but of course the
elimination of the resource curse in terms of violent incentives also requires checking that
inter-state wars and other forms of violence and discriminations can be avoided. An integrated study of
the role of natural resources for violent incentives of all kinds is left as next step in our research
agenda.
References
Alesina, Alberto, Arnaud Devleeschauwer, William Easterly, Sergio Kurlat, and Romain Wacziarg
(2003): "Fractionalization", Journal of Economic Growth 8: 155-194.
Alesina, Alberto, Stelios Michalopoulos and Elias Papaioannou (2014): “Ethnic Inequality,”
forth-coming inJournal of Political Economy.
Alesina, Alberto and Ekaterina Zhuravskaya (2011): "Segregation and the Quality of Government
in a Cross Section of Countries",American Economic Review 101: 1872–1911.
Basedau, Matthias, and Thomas Richter (2011): "Why Do Some Oil Exporters Experience Civil
War But Others Do Not? A Qualitative Comparative Analysis of Net Oil-Exporting Countries",