Issues
ISSN: 2146-4138
available at http: www.econjournals.com
International Journal of Economics and Financial Issues, 2017, 7(1), 31-36.
The Effect of Financial Crisis and Macroeconomic Factors on
Foreign Direct Investment in Developing Countries
Anita Hasli
1*, Nurhani Aba Ibrahim
2, Catherine S. F. Ho
31Faculty of Business Management, Universiti Teknologi MARA, Malaysia, 2Faculty of Business Management, Universiti Teknologi MARA, Malaysia, 3Faculty of Business Management, Universiti Teknologi MARA, Malaysia. *Email: anita@sarawak.uitm.edu.my
ABSTRACT
Developing countries needs Foreign direct investment (FDI) to be at par with the progress of developed countries. The dearth of study on the effects of
financial crisis on FDI justifies the objective which is to examine the potential effect of financial crisis inclusive of macroeconomic factors as control variables on FDI in dataset 23 developing countries for the period 1993-2013. This study includes descriptive analysis, correlation test, stationary test and regression analysis. The random effects (RE) generalized least square estimator is used in the regression to examine the potential effect of financial crisis and macroeconomic factors on the inflow of FDI. Foremost, the US financial crisis has a positive significance to the inflow of FDI which validates Krugman’s theory on fire-sale FDI. However, country specific economic recession, lending rates and natural resources discourage inflow of FDI. Nonetheless, trade openness, domestic currency, money supply and domestic fixed investment encourage FDI in developing countries. Keywords: Foreign Direct Investment, Financial Crisis, REM, Developing Countries
JEL Classifications: C33, F21, G01, P52
1. INTRODUCTION
Foreign direct investment is a significant issue in the global
demand for capital. The growth in Foreign direct investment (FDI) is essential for countries to sustain and escalate economic growth and also improve the social welfare of a country. Developing countries in their pursuit to be at par with developed countries needs a consistent growth in FDI. Foreign investors through
FDI brings benefits to the developing countries growth in terms
of technology transfer, employment opportunities for the local
residence, efficiency in management and marketing, access to
raw materials, increased productivity and competitiveness and
economies of scale (Moosa, 2002).
On that note, growth of FDI has significant positive consequences
on the development of a developing country in terms of economic, social and political elements. Therefore the presence and growth of FDI is clearly important for the growth and social welfare of
a developing country. However, a developing country’s financial crisis (economic recession) could deter the inflow of FDI. Hence,
this study is motivated by the necessity to determine the effect of
financial crisis and country specific economic recession inclusive of macro-economic factors as control variables on the inflow of
FDI in developing countries.
2. LITERATURE REVIEW
One of theories that is prominent in the literature of FDI is the eclectic theory by Dunning (1977, 1979, and 1988) which postulates that ownership, internalization and location factors
will influence foreign direct investment. This theory and other FDI theories (Weber, 1929; Mundell, 1957; Vernon, 1966; 1974; 1979; Kindleberger, 1969; Aliber, 1970, 1971; Caves, 1971; 1982; Hymer, 1976; Buckley and Casson, 1976; Rugman, 1975;
1977; Dunning, 1977;1979;1988; Kojima, 1978; Lessard, 1976;
Agmon and Lessard, 1977; Schneider and Frey, 1985; Froot and
Stein, 1991) have been repeatedly tested and the literature on the determinants of FDI has reported various methodologies and
empirical results. In addition, the studies on the effect of financial crisis, either global financial crisis or country specific economic
In different parts of the world, the studies on the effect of financial crisis on the inflow of FDI in developing countries has generated mix findings. Stoddard and Noy (2015) conducted a study on 40 emerging/developing countries for the period 1987 until 2008
using the generalized method of moment (GMM) and found that
financial crisis had a negative significance on the inflow of FDI. (Depalcitra and Dai, 2012) conducted a study of the effect of the global financial crisis on a panel data from 1992-2008 of ASEAN countries in which it was found that the global financial crisis has had no significance on ASEAN countries. Thangavelu et al. (2009) conducted a study of the effect of the Asian Financial Crisis on selected Asian countries using the fixed effects model for the period 1998 until 2007. The study found that the Asian Financial Crisis had a negative significance to inflow of FDI.
As for the studies on the effect of macroeconomic factors on FDI,
the findings of these studies vary from region to region. Peltonen et al. (2012) conducted a study on 31 emerging countries using a quarterly panel data set for the period 1990 until 2008. The study
employed: (i) The pooled OLS (dynamic OLS) estimator, (ii) the pooled OLS estimator with time effects, (iii) the pooled OLS with
both time and country effects, (iv) the fixed estimator, (v) the RE
estimator and (vi) the IV/GMM estimator. The study found that
interest rate had a negative significance to inflow of FDI. Angelo et al. (2010) conducted a study in Brazil on the determinants of FDI by using monthly data for the period June 2000 until June 2007 by employing the two stage least square regression analysis. The study found that interest rate had a negative significance to the inflow of FDI. Jadhav (2012) conducted a study on Brazil, Russia,
India, China and South Africa using panel data for the period
2000 until 2009 by employing the multiple regression analysis. The study found that trade openness had a positive significance to the inflow of FDI. Liargovas and Skandalis (2011) conducted
a study on the importance of trade openness in attracting foreign
direct investment for the 1990-2008. The sample consisted of
36 developing economies using a set of cross country panel
data. The fixed effect model was used when performing the
regression analysis. The study found that trade openness was
positively significant to the inflow of FDI. Vogiatzoglou (2007) investigated the investments of 10 home countries in the developed region and 9 host countries in Asia from 1994-2003. The study
employed the dynamic GMM estimation method. The degree
of openness had a positive significance to inward foreign direct investment into South and East Asia. Jimenez (2011) conducted
a study on FDI from Spain, France and Italy into 14 countries of North African and CEE countries (Algeria, Bulgaria, Egypt,
Czechoslovakia, Slovenia, Estonia, Hungary, Latvia, Lithuania, Morocco, Poland, the Czech Republic, Romania and Tunisia) for the period 1999-2006. The study found that exchange rate had a positive significance to the inflow of FDI. Liargovas and Skandalis (2011) conducted a study on 36 developing countries for the period 1990 until 2008 by employing the regression analysis based on the fixed effect model. The study found that exchange rate had a positive significance on the inflow of FDI. Vita and Kyaw (2007) in Brazil, Mexico, Korea, the Philippines and South Africa by using quaterly data for the period 1976 until 2001. The objective
was to determine the effect of macro economic variables on capital
flows by employing impulse response and variance decomposition
analyses. The study found that in the short run, money supply had
a positive significance to capital flows which includes FDI. Bond
(1998) conducted a study using time series data from 1984 until
1995 on Thailand and Indonesia. The study employed the ordinary
least square method and instrumental variables to determine the
effect of monetary policy on capital inflows. The study found that monetary policy had a positive significance to capital inflows which includes FDI. Jiang et al. (2013) conducted a study on China by using data from 1985 until 2006 and employing regression
analysis based on the pooled least squares method. The study
found that quality of infrastructure had a positive significance to the inflow of FDI. Kok and Ersoy (2009) conducted a study for
24 developing countries by employing a regression analysis based
on fully modified OLS for the period 1983-2005 and cross section seemingly unrelated regression for the period 1976-2005. The
study found that telephone mainlines and gross capital formation
had a positive significance to the inflow of FDI. Vogiatzoglou (2007) investigated the investments of 10 home countries in the developed region and 9 host countries in Asia from 1994 to 2003.
The study employed the dynamic GMM estimation method. The
availability of natural resources had no significance on inflow of FDI. Asiedu and Lien (2004) conducted a study that covered
East Asia, Latin America, North Africa and Middle East and Sub-Saharan Africa. The analysis covered 96 developing countries over
1970-2000. The fixed-effects panel estimation was employed.
The study found that availability of natural resources had no
significance on inflow of FDI.
3. METHODOLOGY
3.1. Data and Estimation
Historical data of 23 countries from 1993 until 2013 are
collected from the International Financial Statistics and Balance
of Payment of the International Monetary Fund, the World
Bank Open Data database, the United Nations Conference on Trade and Development database and the global market
information database. The 23 countries being examined are China, Hong Kong, India, Kuwait, Malaysia, Pakistan, Philippines, Thailand, Argentina, Chile, Colombia, Guatemala, Mexico, Peru, Uruguay, Venezuela, Bulgaria, Czech Republic, Estonia, Hungary, Latvia, Lithuania and Poland. The reason for the selection of 23 countries being examined is to due to
the non availability of data from other developing countries and subsequently, the panel dataset is set as a balanced panel. The macroeconomic data which are treated as control variables
included are interest rate, trade openness, exchange rate, money supply, gross fixed capital formation (GFCF), natural resources rents (NRR). The macroeconomic data (with the exception of
trade openness, money supply and GFCF), are transformed with natural logarithm to ensure that there is no stationarity problem that is presence of unit root (Table 1). Logarithmic transformations are also a convenient means of transforming
a highly skewed variable into one that is more approximately normal. Preliminary analysis which includes the descriptive
statistics and correlation test are also conducted on the regressors included in the regression model. The macroeconomic factors
Cross-sectional Augmented Dickey Fuller (CADF) stationarity tests. The regression analysis is based on the RE generalized least square (GLS) method. The RE GLS is the appropriate model for this regression as this model caters for time variant and time invariant factors as well as the heterogeneity of the
23 developing countries. In addition, a Hausman test was conducted to ascertain whether the fixed effect or the RE was
the appropriate model.
The results of the Hausman test indicated a non rejection of the null hypothesis (difference in coefficient not systematic) which means that the RE model is the appropriate model. Post diagnostic tests which includes the Breusch and Pagan lagrange multiplier (LM) test for RE, the variance inflation factor (VIF) and the Wald tests
of simple and composite linear hypotheses are performed to ensure
that the model is correctly specified, consistent and efficient. The results of the Breusch and Pagan LM test for Model 2 (Table 2)
shows that the chi square (X2)is 1043.38 with a P-value of χ2<0.01 which indicates a rejection of the null hypothesis of the variance
is equal to zero [Var(µ)= 0]. Therefore this indicates that the
appropriate estimator is the GLS RE model. The results of the VIF
shows that the VIF are <10 for all regressors that are significant in Model 2 (Table 2). The test for coefficient validity which is
the Wald test in which the test carries the null of each parameter
that is β=0. A rejection of the null hypothesis indicates that the coefficient of the parameter is not zero and the results show that the
Wald test X2 is 124.58 for Model 2 with a probability i.e., P-value
<0.01 which indicates a rejection of the null hypothesis. The list
of variables are listed in Table 1 and the results of all the analysis as mentioned above are shown in Section 4.
3.2. Model Specification
A linear regression model is specified to obtain the determinants of the inflow of FDI in 23 developing countries.
The model being estimated in this study is stated as follows:
FDIit=α+β1LRit+β2TOit+β3ERit+β4MSit+β5GFCFit+β6NRRit+ β7Cit+µit+εit (1)
Where FDI= inflow of FDI Per Capita α=The constant term
β=Coefficients of the crisis dummy and macroeconomic factors
LR=Lending rate TO=Trade openness
ER=Exchange rate
MS=Money supply/gross domestic product (GDP) GFCF=Gross fixed capital formation/GDP NRR=Natural resources rents/GDP
C=Financial crisis dummy or economic recession dummy µit=The unit-specific error term
εit=Idiosyncratic error component.
4. EMPIRICAL RESULTS
4.1. Descriptive Analysis
The results and findings of the descriptive analysis and correlation
test are shown below in Tables 3 and 4 respectively. The stationary
test results are shown in Tables 5 and 6 and the random effect GLS
regression results are shown in Table 2.
Referring to Table 3, the standard deviation of the inflow of FDI PC indicates a moderate variation in the inflow of FDI PC among the developing countries. There is a variation in the lending rate of the countries in the panel as expected due to the heterogeneity of the financial system in the panel. With regard
to trade openness, these developing countries adopted similar Table 1: Variables included in the regression model
Variables Measurement Data
transformation FDI Inflow of FDI in USD Natural logarithm
Interest (LR) Lending rate Natural logarithm
TO (Import+export)/GDP None
ER USD Natural logarithm
MS Money supply/GDP None
Infrastructure (GFCF) Gross fixed capital
formation/GDP None
NRR Natural resoucres
rent as a percentage
of GDP
Natural logarithm
Financial crisis and
country specific
economic recession
Dummy one for
occurence of financial
crisis or economic recession
None
FDI: Foreign direct investment, TO: Trade openness, ER: Exchange rate, MS: Money supply, NRR: Natural resources rent, GDP: Gross domestic product
Table 2: Random effects models for financial crisis
Regressors Model 1 Model 2
Lending rate −0.0904b
(0.0458) −0.0912
b
(0.0442)
Trade openness 0.3069a
(0.1068) 0.3072
a
(0.1056)
Exchange rate 0.5053a
(0.1121) 0.4845
a
(0.1121)
Money supply 0.3906a
(0.1443) 0.4027
a
(0.1431) Gross fixed capital formation 0.1613b
(0.0681) 0.1543
b
(0.0678)
Natural resources rents 0.1145a
(0.0366) −0.1139
a
(0.0361) US financial crisis dummy 0.1321b
(0.0591) 0.0997
c
(0.0593)
Recession dummy −0.0489
(0.0482)
Recessiont-1 dummy −0.1092b
(0.0467)
Constant 5.0587 5.0959
R2 (within) 0.1667 0.1752
R2 (between) 0.5844 0.5801
R2 (overall) 0.4684 0.4677
Panel level standard deviation of μi 0.5027 0.5023
Standard deviation of εi 0.4346 0.4324
ρ (fraction of variance due to μi 0.5722 0.5743
Chi-square X2 119.24 124.58
Wald test (Chi-square Χ2) 0.0000 0.0000
Number of observations 483 483
FDI liberalization and trade liberalization policies. Variation in
the exchange rate is expected due to the heterogeneity of the
developing countries domestic currency against the $USD. The variation in the money supply among the developing countries indicates the difference in monetary policies practiced by
each developing country. The variation in the domestic fixed
investment (GFCF) indicates the difference in technological advancement on infrastructure of each country. The variation in its natural resources indicates the variation in each country’s natural resources endowments.
Referring to Table 4, US financial crisis dummy is positively correlated to the inflow of FDI. However, the economic recession is negatively correlated to the inflow of FDI. The lending rate and natural resources are also negatively correlated to the inflow
of FDI. Nevertheless, trade openness and money supply are
moderately positively correlated to inflow of FDI. However, exchange rate and GFCF has no correlation to the inflow of FDI.
4.2. Stationary Test
Tests of stationary were conducted by using the Pesaran’s CIPS developed by Pesaran (2007) and Pesaran’s CADF developed by Pesaran (2003). This procedure is essential to ensure that the regressions produced are not misspecified or spurious in nature.
Also, these tests cater to the heterogeneity and cross-section dependence present in the panel data set.
In Tables 5 and 6, the results of the stationary test showed that all the macro-economic variables are statistically significant to be
included in the estimation of the regression model (Equation 1). Table 3: Descriptive statistics summary of macro-economic regressors
Statistics FDI per capita ($USD million) LR (per cent) TO ER ($USD) M2/GDP GFCF/GDP NRR/GDP (per cent)
Mean 468.5329 16.70316 0.940576 0.616008 0.640887 0.340826 7.335322
Max 14046.87 291.0630 4.583322 30.57080 3.363218 4.472497 62.62358
Min -129.4716 4.248000 0.149701 0.000349 0.076251 0.094212 0.000705
Standard
deviation 1486.507 21.98658 0.705957 1.887378 0.528625 0.600333 11.27381
Note: Number of observation for each of the variable is 483, FDI: Foreign direct investment, LR: Lending rate, ER: Exchange rate, GDP: Gross domestic product, NRR: Natural resources rents, GFCF: Gross fixed capital formation, Number of observation for each of the variable is 483
Table 4: Correlation test results of regressors and inflow of FDI
Variables FDI
PC Lending rate Trade open ness
Exchange
rate Money supply Gross fixed capital formation
Natural resources
rents
US Financial
crisis
Recession Recessiont-1
FDI PC 1
Lending Rate −0.20a 1
Trade Openness 0.66a −0.38a 1
Exchange Rate 0.00 0.12a 0.03 1
Money Supply 0.49a −0.46a 0.74a −0.10b 1
Gross Fixed
Capital formation 0.06 0.12
a −0.11b −0.13a −0.05 1
Natural resources
rents −0.60
a 0.10b −0.65a 0.24a −0.56a −0.06 1
US financial
crisis dummy 0.07 −0.12
a 0.04 −0.02 0.06 0.05 0.04 1
Recession
dummy −0.10
b 0.36a −0.16a 0.01 −0.19a 0.03 0.00 0.05 1
Recessiont-1
dummy −0.13
a 0.25a −0.13a −0.05 −0.18a 0.04 0.01 −0.18a 0.35a 1
Number of observation for each of the variable is 483; adenotes significance level at 1%, bdenotes significance level at 5%; cdenotes significance level at 10%
Table 5: Cross-section augmented Im, Pesaran and Shin (CIPS) Stationary Test
Variable No constant no
trend with (i) Constant with (i) Constant and trend with (i) No constant no trend with (ii) Constant with (ii) trend with (ii)Constant and FDI PC −1.954a(1) −2.247a(1) −2.603c(1) −1.923a(1) −2.188b(1) −2.603c(1)
Lending rate −2.052a(1) −2.551a(1) −2.698b(1) −2.061a(1) −2.626a(1) −2.735b(1)
Trade openness −1.661b(1) −2.268b(1) −2.358(1) −1.720b(1) −2.328a(1) −2.327(1)
Exchange rate −0.545(1) −2.423a(1) −3.366a(1) −0.545(1) −2.423a(1) −3.026a(1)
Money supply −1.792a(1) −2.515a(1) −2.499(1) −1.797a(1) −2.519a(1) −2.516(1)
Gross fixed capital formation −1.521c(1) −2.168b(1) −2.308(1) −1.503c(1) −2.206b(1) −2.289(1)
Natural resources rents −1.403(1) −2.601a(1) −2.852a(1) −1.378(1) −2.583(1) −2.827a(1)
FDI: Foreign direct investment. aDenotes cv1 (significance at 1%), bdenotes cv5 (significance at 5%) and cdenotes cv10 (significance at 10%); the figure in parenthesis denotes the
maximum lag; N, T=(23,21) with 483 observations; the Z[t-bar] statistic parallel to IPS (2003) Z[t-bar] is distributed standard normal under the null hypothesis of non-stationarity;
the dynamics is lags criterion decision general to particular, based on F joint test; individual ti were truncated during the aggregation process; (i) denotes the dynamics in Wald test of
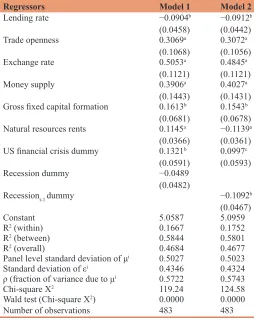
4.3. Regression Results
The next analysis is the regression based on the GLS RE model
and the results are presented in Table 2.
The regression results in Table 2 (Model 2) shows that the US
financial crisis is statistically significant at the 10% significance
level and indicating a positive effect on the inflow of FDI.
Therefore, there is evidence of a fire-sale FDI as theorized and conceptualized by Krugman (2000). According to Krugman (2000), historically, during the Asian financial crisis and Latin America crisis, fire-sale (extreme discounted prices) transactions occurred in these regions. Although there was a flight of short
term capital and sell-offs of foreign equity holdings during these
crises, simultaneously there was an inward flow of foreign direct investment. Policy changes led to abolishment of old policies that detered FDI and the desperation for cash by local firms encouraged FDI. Multinational firms reacted to this attractive and liberalized FDI policies by acquiring companies and assets at fire-sale prices
in these regions during the crises. In contrast, lending rate and
natural resources are affecting the inflow of FDI unfavourably at the 5% significance level and 1% significance level respectively. In
addition, the economic recession at lag 1 affects FDI negatively at
5% significance level. As interest rise up, borrowing is reduced as
well as investment is reduced as high interest rates in a host country
will indicate that debt financing for business operations in the host
country is costly. In the case of natural resources, abundance of natural resources would deter non-resource seeking FDI that seeks developing country’s endowments other than natural resources.
However, trade openness, exchange rate, money supply and GFCF are factors that encourage inflow of FDI at the 1% significance level and 5% significance level as shown in Table 2 (Model 2).
Trade openness indicates a country’s openness to international trade and a higher degree or level of openness would attract
inflow of FDI. The abundance of money supply also attracts more inflow of FDI as this will indicate the efficiency of a developing country’s monetary policy. An expansionary monetary policy
which implies a lowering of interest rates should encourage the
inflow of FDI in developing countries. As for the positive influence of exchange rate on the inflow of FDI, supporting this result is the study by Ouerghi (2013) who conducted a study on the resilience of emerging countries during the global economic crisis of 2008 and found that an adequate exchange rate regime will improve an emerging country resilience during a financial crisis. Referring to
GFCF (domestic investment), a developing country that is well endowed with a developed and technologically advanced physical infrastructure appeals to foreign investors.
5. CONCLUDING REMARKS
The study found that the US financial crisis attracted FDI rather than deter FDI as theorized by Krugman (2000). Therefore, the finding of this study adds to the existing literature on the effect of the US financial crisis on the growth of FDI in developing countries. However, country specific economic crisis (recession) has a negative influence on the inflow of FDI. This implies that
each developing country should work on formulating policies to attract FDI. Strengthening macro-economic management should
reduce the occurrence of a developing country’s financial crisis to attract and sustain the growth of inflow of FDI.
A country specific economic recession is detrimental to the growth
of FDI in developing countries as foreign investors avert from countries that encounters economic meltdowns. Ascertaining the
converging or deterring factors influencing FDI would enable
policy makers to formulate policies such as liberalizing FDI policies, trade policies and improving physical infrastructure
to attract FDI. In addition, country specific differences which
accounts for heterogeneity can be narrowed by partaking in bilateral agreements among developing countries to encourage
the inflow and growth of FDI. Nevertheless, the study is limited
to aggregated macro-economic level secondary data that considers
FDI flows. Also, the study is constraint by the availability of data of each country. It is suggested that FDI stocks and Foreign Portfolio Investment (FPI) are considered in future studies.
REFERENCES
Agmon, T., Lessard, D.R. (1977), Investor recognition of corporate
international diversification. The Journal of Finance, 32(4), 1049-1055.
Angelo, C.F., Eunni, R.V., Fouto, N.M.M. (2010), Determinants of FDI
in emerging markets: Evidence from Brazil. International Journal
of Commerce and Management, 20(3), 14-20.
Aliber, R.Z. (1970), A Theory of Direct Foreign Investment. The International Corporation. Vol. 4. Cambridge, Mass: MIT Press. Aliber, R.Z. (1971), The multinational enterprise in a multiple currency
world. The Multinational Enterprise. London: George Allen &
Unwin. p49-56.
Asiedu, E., Lien, D. (2011), Democracy, foreign direct investment and
natural resources. Journal of International Economics, 84, 99-111.
Bond, T.J. (1998), Capital flows to Asia: The role of monetary policy. Table 6: CADF Stationary test
Variable Lag No truncation1 No
truncation1
Constant Constant and trend
FDI PC Level −2.433a −2.582c
Lag 1 −1.785 −1.926
Lending rate Level −2.551a −2.698b
Lag 1 −3.041a −3.330a
Trade openness Level −2.551a −2.358
Lag 1 −1.902 −1.971
Exchange rate Level −2.423a −3.472a
Lag 1 −1.518 −2.566c
Money supply Level −2.515a −2.499
Lag 1 −2.197b −2.211
Gross fixed capital
formation Level −2.168
b −2.308
Lag 1 −2.655a −2.727b
Natural resources rents Level −2.601a −2.852a
Lag 1 −2.757a −3.028a
aDenotes cv1 (significance at 1%), bDenotes cv5 (significance at 5%) and denotes
cv10 (significance at 10%); the Z[t-bar] statistic parallel to IPS (2003) Z[t-bar] is
distributed standard normal under the null hypothesis of non-stationarity; analogous to
IPS (2003) test, Pesaran’s CADF is consistent under the alternative that only a fraction
of the series is stationary; 1denotes cross-sectional average in first period extracted and
Empirica, 25, 165-182.
Buckley, P.J., Casson, M. (1976), A long-run theory of the multinational
enterprise. In: The Future of the Multinational Enterprise. UK:
Palgrave Macmillan. p32-65.
Caves, R.E. (1971), International corporations: The industrial economics of foreign investment. Economica, 38(149), 1-27.
Delpachitra, S., Dai, P.V. (2012), The determinants of TFP growth in middle income economies in ASEAN: Implication of financial crises.
International Journal of Business and Economics, 11(1), 63-88.
Dunning, J.H. (1977), Trade, location of economic activity and the MNE:
A search for an eclectic approach. In: The International Allocation of
Economic Activity. UK: Palgrave Macmillan. p395-418.
Dunning, J.H. (1979), Explaining changing patterns of international production in defence of the eclectic theory. Oxford Bulletin of Economics and Statistics, 41, 269-295.
Dunning, J.H. (1988), The eclectic paradigm of international production: A restatement and some possible extensions. Journal of International
Business Studies, 19, 1-31.
Froot, K.A., Stein, J.C. (1991), Exchange rates and foreign direct investment: An imperfect capital markets approach. The Quarterly Journal of Economics, 106(4), 1191-1217.
Hymer, S. (1976), The International Operations of National Firms: A
Study of Direct Foreign Investment. Vol. 14. Cambridge, MA: MIT
Press. p139-155.
Jadhav, P. (2012), Determinants of foreign direct investment in BRICS
economies: Analysis of economic, institutional and political factor.
Procedia-Social and Behavioral Sciences, 37, 5-14.
Jiang, N., Liping, W., Sharma, K. (2013), Trends, patterns and
determinants of foreign direct investment in China. Global Business
Review, 14(2), 201-210.
Jimenez, A. (2011), Political risk as a determinant of Southern European
FDI in neighboring developing countries. Emerging Markets Finance
and Trade, 47(4), 59-74.
Kindleberger, C.P. (1969), American business abroad. The International Executive, 11(2), 11-12.
Kojima, K. (1978), Japanese Direct Foreign Investment: A Model of Multinational Business Operations. Tokyo: Charles E. Tuttle Company.
Kok, R., Ersoy, B.A. (2009), Analyses of FDI determinants in developing
countries. International Journal of Social Economics, 36(1-2),
105-123.
Krugman, P. (2000), Fire-sale FDI. In: Edwards, S., editor. Capital Flows
and the Emerging Economies: Theory, Evidence, and Controversies.
Chicago: University of Chicago Press. p43-58.
Liargovas, P.G., Skandalis, K.S. (2011), Foreign direct investment and
trade openness: The case of developing economies. Social Indicators
Research, 106(2), 323-331.
Lessard, D.R. (1976), World, country, and industry relationships in equity returns: implications for risk reduction through international
diversification. Financial Analysts Journal, 32(1), 32-38.
Moosa, I.A. (2002), Foreign Direct Investment: Theory, Evidence and Practice. New York: Palgrave Macmillan.
Mundell, R.A. (1957), International trade and factor mobility. The American Economic Review, 47(3), 321-335.
Ouerghi, F. (2013), Global financial crisis: Did exchange rate politics
help emerging countries to be more resilient? International Journal of Economics and Financial Issues, 3(4), 949-963.
Peltonen, T.A., Sousa, R.M., Vansteenkiste, I.S. (2012), Investment in
emerging market economies. Empirical Economics, 43, 97-119.
Rugman, A.M. (1976), Risk reduction by international diversification. Journal of International Business Studies, 7(2), 75-80.
Rugman, A.M. (1977), Risk, direct investment and international
diversification. Weltwirtschaftliches Archiv, 113(3), 487-500. Schneider, F., Frey, B.S. (1985), Economic and political determinants
of foreign direct investment. World Development, 13(2), 161-175. Stoddard, O., Noy, I. (2015), Fire-sale FDI? The impact of financial crises
on foreign direct investment. Review of Development Economics, 19(2), 387-399.
Thangavelu, S.M., Yong, Y.W., Chongvilaivan, A. (2009), FDI, growth and the Asian financial crisis: The experience of selected Asian countries. The World Economy, 32(10), 1461-1477.
Vernon, R. (1966), International investment and international trade in the
product cycle. The Quarterly Journal of Economics, 80(2), 190-207.
Vernon, R. (1974), The location of economic activity. Economic Analysis and the Multinational Enterprise. London: Allen & Unwin. p89-114. Vernon, R. (1979), The product cycle hypothesis in a new international
environment. Oxford Bulletin of Economics and Statistics, 41(4), 255-267.
Vita, G.D., Kyaw, K.S. (2008), Determinants of capital flows to developing
countries: A structural VAR analysis. Journal of Economic Studies,
35(4), 304-322.
Vogiatzoglou, K. (2007), Vertical specialization and new determinants of
FDI: Evidence from South and East Asia. Global Economic Review,
36(3), 245-266.
Weber, A. (1929), Theory of the Location of Industries. Chicago: