JIEM, 2015 – 8(5): 1547-1575 – Online ISSN: 2013-0953 – Print ISSN: 2013-8423 http://dx.doi.org/10.3926/jiem.1456
Manufacturing Plant Location Selection in Logistics Network
Using Analytic Hierarchy Process
Ping-Yu Chang
1, Hsin-Yi Lin
21
Department of Industrial Engineering and Management, Ming Chi University of Technology,
2Cheng Uei Precision
Industry Co. Ltd., (Taiwan)
[email protected], [email protected]
Received: April 2015
Accepted: November 2015
Abstract:
Purpose:
In recent years, numerous companies have moved their manufacturing plants to
China to capitalize on lower cost and tax. Plant location has such an impact on cost, stocks, and
logistics network but location selection in the company is usually based on subjective preference
of high ranking managers. Such a decision-making process might result in selecting a location
with a lower fixed cost but a higher operational cost. Therefore, this research adapts real data
from an electronics company to develop a framework that incorporates both quantitative and
qualitative factors for selecting new plant locations.
Design/methodology/approach:
In-depth interviews were conducted with 12 high rank
managers (7 of them are department manager, 2 of them are vice-president, 1 of them is senior
engineer, and 2 of them are plant manager) in the departments of construction, finance,
planning, production, and warehouse to determine the important factors. A questionnaire
survey is then conducted for comparing factors which are analyzed using the Analytic Hierarchy
Process (AHP).
responses of the managers indicate usefulness of implementing the proposed model into
reality, which adds to the value of this research.
Practical implications:
The proposed framework can save numerous time-consuming
meetings called to compromise opinions and conflictions from different departments in
location selection.
Originality/value:
This paper adapts the Analytic Hierarchy Process (AHP) to incorporate
quantitative and qualitative factors which are obtained through in-depth interviews with high
rank managers in a company into the location decision.
Keywords:
facility location, Analytic Hierarchy Process (AHP), supply chain management, delphi
method, logistics network
1. Introduction
The increase in the number of orders and changes in supply chain have recently forced companies to expand or move their plants to various locations to improve their competitiveness. Plant locations have such an impact on cost and stocks that it should be thoroughly considered to strengthen the competitiveness of the company. Although the importance of location selection has been recognized in the literature, adjustment of academic findings seem necessary before implementing them into practical cases; This is because academic outcomes usually comprise mathematical modeling based on assumptions. Using mathematical models requires access to advanced solution techniques (such as metaheuristics) or computer equipment to obtain feasible locations in a reasonable time. In addition, mathematical modeling primarily deals with quantitative analysis without incorporating qualitative issues. Using only quantitative analysis will lead to choosing a location with the lowest real estate price or capital involved. Although merely focusing on cost and its minimization can positively affect the company’s fiscal budget by lowering the initial cost, the impact from other factors is simply neglected. For example, a company in China can purchase the usage right of a land for maximum 50 years. China provinces usually waive land cost for companies that locate new plants to stimulate local economy. However, such a selection may result in higher transportation cost, poorer supplier network, and longer customer response time.
respectively. Such conflictions can thwart meetings, and the final decision is then determined by a high ranking manager such as the president or vice president. Such a decision will not take every factor into consideration and will usually result in a biased location choice. Hence, this research tries to propose a framework in determining facility location to avoid time consuming meetings for manufacturing industries with the adaption of the Analytic Hierarchy Process (AHP) to incorporate quantitative and qualitative factors into the decision. There are two objectives in the research. One is to obtain and to categorize main criteria from decision making managers so that future location decision can be made by reviewing these criteria. The second objective is to simplify the decision making process and reduce decision making time with the incorporation of AHP method. AHP was developed by Saaty in 1970 and is known to effectively coordinate the impact of different factors on the same basis. In this research, the procedures of AHP are discussed and implemented in a company to realize its usefulness for location selection. The structure of the research is as follows: Section 1 introduces the motivation and the objective of the research while Section 2 discusses the literature. Section 3 lists the procedures, and Section 4 presents the implementation of the procedures with real data. Sensitivity analysis is also presented in Section 4 and conclusions are made in Section 5.
2. Literature Reviews
Most previous literatures have been devoted to facility location using mathematical models. Randhawa and West (1995) showed that an incorrect location will affect the production rate due to low efficiency of the transportation system, resulting increased costs. Balinski (1965) developed a mathematical model called the Fixed Charge Location Problem (FCLP), which minimized the fixed cost and transportation cost when determining the optimal facility location. Huff (1966) demonstrated a gravity model to determine the optimal facility location considering competition from other companies and uncertainty of customer demand. Church and Revelle (1976) used average travel distance to efficiently find the best location and showed that an increase in average travel distance decreases the efficiency of the location.
alignment and investigated the impact of cultural dimensions on the location of offshore service projects. Their research showed that Western and Asian firms do not have different cultural preferences. McDermott and Stock (2011) analyzed 264,000 patients in cardiology wards of New York State to understand the hospital cost performance. They concluded that focus on one line of service in hospitals can lower costs. Handley and Benton Jr. (2013) conducted research in 102 outsourcing relationships to understand the impact of a task and location specific complexity on costs. They used the hierarchical regression to analyze results and found that the scale of service and the distance between the customer and provider will result in higher level of control and costs.
Marin (2011) balanced the maximum and minimum number of customers allocated to every plant in a discrete facility location problem by developing two mathematical formulations and applied a branch-and-cut algorithm to achieve the optimal solution. Both formulations were tested with different instances and the results showed that large size instances could be solved in a reasonable time frame. Canbolat and von Massow (2011) studied the location problem with random demand point to minimize the expected maximum rectilinear distance. Some properties and a simulation approach to solve complex 2D cases were presented in their research. The simulation approach achieved nearly optimal solutions for the linear case and could be considered for solving location selection problems. Lee and Lee (2012) investigated facility location problem considering customer restrictions and preferences. A mixed integer programming formulation and a heuristic solution procedure using Lagrangian relaxation were proposed in their research; indicating that the solution procedure can achieve feasible solutions in a reasonable computation time frame. Arabani and Farahani (2012) reviewed the literature of aspects and characteristics of dynamics of FLPs. Having provided a broad overview of their mathematical formulations, they drew the possible directions of future research. Gulpinar, Pachamanova and Canakoglu (2013) studied a stochastic facility location problem in which multiple capacitated facilities and a stock out probabilistic requirement are incorporated. They provided robust approximations and numerical experiments to demonstrate the performance of the formula. The results showed that robust strategies outperform non robust strategies in average total cost.
chain risks that meet the supply chain objectives. The results show that the most critical supply chain risks come from careful evaluations of impacts and a consideration of the cause-effect relationships. Dagdeviren, Yavuz and Kilinc (2009) used AHP and TOPSIS in weapon selection. They applied AHP in analyzing the structure of the weapon selection problem and to determine weights of the criteria. The TOPSIS method is then used for obtaining final ranking. A case study in their research has showed the usefulness and effectiveness of the proposed method. Chen and Wang (2010) demonstrated six elements with 20 critical factors using AHP to evaluate information service industry in developing international market. Typical commercial software companies are analyzed and the results showed that product competition is the most effective factor while distribution/channel is the least effective factor. Vidal, Sabin, Martelli, Berhoune and Bonan (2010) applied AHP in selecting anti-cancer drugs within the pharmacy department of a hospital. The proposed method has been applied to the pharmaceutical chemotherapy compounding unit of a hospital in Paris. The weightings in the AHP model are used to identify drugs production on a make-to-stock basis. The results showed that AHP can be extended its usefulness in the health care management. Amiri (2010) used AHP to evaluate and select oil-fields development project. He applied AHP to achieve weights of the criteria and then used fuzzy TOPSIS method to obtain final ranking. The proposed method was applied in an example which demonstrated the usefulness and effectiveness of implementing AHP in decision making.
Ishizaka and Labib (2011) reviewed the main developments in AHP since its inception. Problem modelling, pair-wise comparisons, judgment scales, derivation methods, consistency indices, incomplete matrix, synthesis of the weights, sensitivity analysis, and group decisions are discussed in their research. Vidal, Marie and Bocquet (2011) propose a multi-criteria approach to project complexity evaluation. They conduct AHP on a case study within a start-up firm in the entertainment industry (musicals production). Their concluded that AHP is reliable, user friendly, global independent, and able to highlight project complexity sources. Hong and Xiaohua (2011) performed a study on location selection of multiple objectives by analyzing the construction process of AHP and identifying important factors for location selection of emergency logistics centers. An optimal solution with a feasible solution time frame was achieved. Rad, Naderi and Soltani (2011) considered the problem of clustering and ranking university majors in Iran. The evaluated 177 university majors with eight different criteria using AHP. Their results showed that Management, Mechanical and Information Technology Engineering are three top majors, based on view of the decision makers. After these three majors, engineering majors, such as Industrial and Civil Engineering along with Medicine, Film and Video Production and Law are more influential majors.
and neural network to understand the store performance. The results showed that proposed system is able to provide more accurate result than regression model in accuracy. Partovi (2006) presented a strategic decision making process to facility location problem which incorporates external and internal criteria. A case study was applied to demonstrate the usefulness of the proposed framework. Vahidnia, Alesheikh and Alimohammadi (2009) combined Geographical Information System (GIS) with fuzzy AHP to determine the optimal hospital site in an urban area. The result showed that selected optimal site covers more than 6.5 percent of population than other feasible sites. Choudhary and Shankar (2012) proposed an STEEP-fuzzy AHP based framework for evaluation and selection of optimal locations for thermal power plant. They also concluded that AHP is an appropriate method in location selection other than traditional way of decision making or by political interests. Sánchez-Lozano, García-Cascales and Lamata (2015) determined the best location of a solar thermoelectric power plant using AHP. Their result showed that AHP can deal with quantitative and qualitative criteria in selecting best location. The results validated the quality of the solution obtained by the proposed methodology, since for the 33 best alternatives obtained by AHP and ELECTRE-TRI there are 21 coincident alternatives.
Facility location has a well-developed theoretical background with a variety of models, methodologies, and solution techniques. These models addressed facility locations based on cost and operational analysis which will select location near low cost and high resource area without taking holistic and systematic approach. In addition, facility location selection based on operational analysis will determine the best location entirely from a company’s manufacturing perspective without considering other critical activities of the organization. Therefore, this research adapts AHP method to incorporate both quantitative and qualitative criteria in location analysis.
Zhang, Deng, Wei and Deng (2012) developed a model based on AHP to evaluate E-Commerce security. The weights of the criteria are then combined using Dempster-Shafer theory to realize the evidences and to derive a decision for the degree of E-Commerce security. An example is provided in their research and efficiency of the model is illustrated. Lee, Kim, Kim and Oh (2012) investigate the important intangible priority factors for the transfer of technology through AHP method and correlation analysis. Their results indicate that prioritized factors are in the order of business feasibility (profitability), technological validity, technology licensing office capabilities. The most important criterion is business feasibility and the most important sub-factor for business feasibility is commercialization indicating that productivity, profitability, marketing and working capital funds are critical in buying new technologies.
integrate production-planning with manufacturing partners selection. Fuzzy AHP is applied to determine relative weights of manufacturing partners while GP is used to formulate the integrated production-planning problem. Ho, He, Lee and Emourznejad (2012) developed an integrated quality function deployment (QFD), fuzzy set theory, and AHP to determine the optimal third-party logistics (3PL) service providers. The developed method has been applied to Hong Kong-based enterprises and has outperformed other current approaches. Büyüközkan, Çifçi and Güleryüz (2011) used the SERVQUAL to examine factors of service quality and evaluated the identified factors using a fuzzy AHP. They implemented the proposed framework into a healthcare system to prove its usefulness. Calabrese, Costa and Menichini (2013) proposed a model integrating fuzzy logic and AHP to evaluate Intellectual Capital (IC) management and then applied it to the companies operating in the ICT service industry to realize the usefulness of the methodology. Although fuzzy logic and TOPSIS have been proved their usefulness in multicriteria analysis, this research only adapts AHP in location selection.
3. Methodology
Plant location is normally decided by high ranking managers in the industry. Numerous meetings have been called but cost and supplier network are the only parameters considered in such time-consuming meetings. Although the importance of a supplier network is recognized in the decision-making process, cost reduction rules out the first priority for industries. Therefore, the location with the minimum initial cost is usually selected. On the other hand, intelligent algorithm and simulation tool can be developed and are for sure to achieve optimal solution for location problems. However, these models and algorithms address facility locations based on quantitative indexes which will determine the best location from company’s manufacturing or fiscal perspective without considering other critical activities. In addition, using only quantitative analysis will lead to choosing a location with the lowest real estate price or capital involved. Although merely focusing on cost and its minimization can positively affect the company’s fiscal budget by lowering the initial cost, the impact from other factors is simply neglected (Partovi, 2006; Tzeng et al., 2002; Kuo et al., 2002; Vahidnia, et al., 2009; Choudhary & Shankar, 2012; Sánchez-Lozano et al., 2015).
decision makers (Wu, Lin & Chen, 2007). It includes every decision makers’ evaluation using pair-wise comparisons of factors for alternatives. Four steps are required for AHP analysis. Step 1 is to define the overall goals and step 2 is to construct AHP hierarchy based on the criteria and subcriteria where, at least, three tiers including overall goals, criteria, and alternatives should be constructed. Subcriteria can be inserted between criteria and alternatives for more precise evaluation. Step 3 is to construct the pair-wise comparison matrix A between factors and alternatives in each tier while step 4 checks the consistency of the questionnaires and determines the best strategy based on the calculated weights.
Saaty (1980) suggested use of nine evaluation scales marked at 1, 3, 5, 7, and 9 as “equally important”, “slightly more important”, “strongly more important”, “demonstrably more important” and “absolutely more important”, respectively, for designing the questionnaire. Matrix A is an n × n matrix where n denotes the number of criteria to be compared. Equation (1) shows the parameters within matrix A, aij represents the result between the ith criteria in
rows and the jth criteria in columns and is equal to 1/a
ji. For matrix A, to maintain the
consistency, the relation between weight of ith criteria (w
i) and aij will be equal to wi/wj, for all i
and j. Also, this research uses column vector average shown in equation (2) to approximately calculate wi.
(1)
(2)
To test the consistency of matrix A, Saaty (1990) suggested using eigenvalue λmax within
equation (3) for calculating eigenvector X. The calculation of eigenvalue λmax is demonstrated in
equation (4).
(3)
(4)
The eigenvalue λmax is then applied to achieve Consistency Index (CI) and Consistency Ration
RI is Random Index value developed by Oak Ridge National laboratory and Warton School for the consistency test. Table 1 demonstrates the value of RI in different numbers of criteria (n). If CI and CR are less than 0.1, consistency is sustained for the questionaire.
n 1 2 3 4 5 6 7 8 9 10 11 12 13 14 15
R.I. 0.0 0.0 0.58 0.9 1.12 1.24 1.32 1.41 1.45 1.49 1.51 1.48 1.56 1.57 1.58
Table 1. Random Index value
4. Case Study
The company under study was founded in 1986 and concentrated on 3C (Communication, Consumable, and Computer) components and power supply manufacturing. Their customers included Microsoft, Apple, Hewlett-Packard (HP), Acer, Alpha, Motorola, Sony, NEC, Siemens, Nokia, Sanyo, and Panasonic. Its manufacturing plants are located mainly in China and sales points cover countries in Asia, America, and Europe. The company tries to determine a new plant location among three preferred locations TG, KS, and TJ.
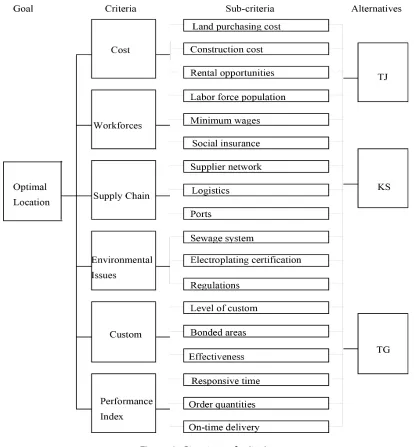
To identify the important factors of locations, in-depth interviews were conducted with 12 high rank managers (7 of them are department manager, 2 of them are vice-president, 1 of them is senior engineer, and 2 of them are plant manager) in the departments of construction, finance, planning, production, and warehouse. Each interview lasts at least 30 minutes with questions of their experiences in location selections, factors considered in location selection, subcriteria of the factors, and rate the importance of the factors. Managers have at least nine-year experience in location selection and they provided important factors based on location selection experiences and current operation problems due to location selections. During the interviews, managers in finance express concerns in Cost while managers in planning and production have concerns in Workforce, Supply Chain, Customs, and Performance Index. Managers in construction think Cost and Environmental issues are important factors while managers in warehouse express concerns in Supply Chain, Customs, and Performance Index. These interviews were then summarized into six factors and three levels for each factor. The six factors are Cost, Workforces, Supply chain, Environmental issues, Customs, and Performance index that are discussed as follows:
1. Cost: Cost is always the most important factor in building a new plant. Three subcriteria have been identified.
b) Construction cost: Two types of building construction, steel structure and reinforced concrete factory plant, are usually adapted in manufacturing industries. Construction of steel structure factory plant is restrained to one floor in a larger area and takes six months. A reinforced concrete factory plant, however, can be constructed in multiple stories in a smaller land and takes, at least, one and a half years.
c) Rental opportunities: In China, some provinces have empty plants and employee residential buildings for rental, which will reduce cost and time for the new plant to be ready for production.
2. Workforces: In 2010, the development of western China and higher wages allured workers to move from coastal cities to these areas that resulted in workforce shortage in coastal cities. Hence, workforce is an important factor in plant location selection.
a) Labor force population: Although China is a country with 1.5 billion people; local workforces are usually not enough to support the demand of the enterprises. A large chunk of workforces come from interior cities with the aim of higher wages. Such workforces will immediately leave their positions if higher wages are offered by other companies or areas, causing high personnel turnover rate.
b) Minimum wages: In China, cities have various minimum wages. Choosing the lowest wage will reduce the personnel cost of a company.
c) Social insurance: In China, different governments will legislate different regulations of social insurance requirements and coverage amounts. For example, provinces in Southern China usually encounter lower social insurance requirements and coverage amounts compared to Northern and Eastern China.
3. Supply chain: Logistics cost and time have always been important issues of a company to enhance its competitiveness. To reduce logistics cost and time, a plant should be located within an appropriate supply chain network so that suppliers and manufacturers can provide components and finished product to the manufacturers and the customers on time.
a) Supplier network: Pursuing zero inventory to reduce cost is always an important strategy for electronic manufacturing industries and on-time delivery from suppliers is the key factor to reach this goal.
them able to store taxed merchandise. Logistics parks are approved by the customs office to have the same authority of import and export customs.
c) Ports: The distance from plant location to the ports has an impact on the transportation and lead time. Usually, a location closer to the port or airport will have higher priority in location selection.
4. Environmental issues: Environmental regulations have become stricter especially on the waste disposals by electronic industries. Three subcriteria are identified for environmental issues.
a) Sewage system: Some electronic manufacturing processes require electroplating that will dispose of highly polluted waste water. The waste water can only be purified using special sewage system. Hence, a location with a ready special sewage system will have higher priority in location selection.
b) Electroplating certification: Most Chinese provinces have declined application to electroplating certification due to its high pollution. Manufacturing process is not allowed to be operated without electroplating certification. Hence, the convenience of obtaining electroplating certification is an important factor in location selection.
c) Regulation: Different Chinese provinces have different regulations and levels of cooperation in term of environment inspection; thus, certifications are also different among governments.
5. Customs: Manufacturing plants are normally operational 24 hours a day and therefore, final goods are exported at any time of day to fulfill orders. Hence, a customs office that can cooperate with companies at any specific time will have higher priority in location selection.
a) Levels of customs: There are two levels of customs in China. Level A customs can extend its service time to help companies while level B customs area will operate only during office hours.
b) Bonded area: Logistics parks, bonded warehouses, and export processing zones are the three types of special bonded areas.
6. Performance index: The objective of a new plant is to fulfill customers’ requirements so that customer satisfaction can be increased. Three subcriteria of responsive time, order quantities, and on-time delivery are identified in this criterion.
a) Responsive time: It is defined as the time taken to respond and complete customer requirements, such as orders and product specification adjustments. The shorter the time, the higher the customer satisfaction.
b) Order quantities: A new plant should provide enough capacity for customer demand.
c) On-time delivery: Delivering orders on-time is an import factor to improve customer satisfaction.
Figure 1. Structure of criteria
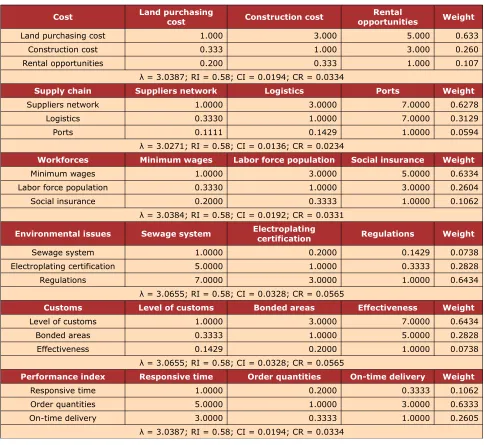
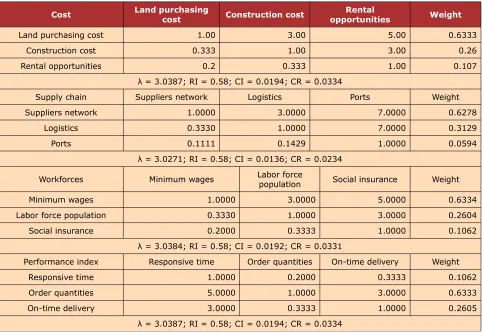
4.1. Pair-wise Comparison Matrix
Table 2 shows the pair-wise comparison matrix of the six criteria in the second tier.
Criteria Cost SupplyChain Workforces Environmentalissues Customs Performanceindex Weight
Cost 1.0 3.0 2.0 5.0 7.0 1.0 0.287
Supply chain 0.3 1.0 0.3 5.0 5.0 0.3 0.127
Workforces 0.5 3.0 1.0 5.0 7.0 0.3 0.197
Environmental
issues 0.2 0.2 0.2 1.0 3.0 0.2 0.055
Customs 0.1 0.2 0.1 0.3 1.0 0.2 0.034
Performance index 1.0 3.0 3.0 5.0 5.0 1.0 0.300
Accordingly, λ value is 6.447 and the RI value is 1.24. Hence, CI and CR value are 0.09 and 0.072, respectively. The CR value is less than 0.1, which indicates consistency in the questionnaire results. The weights of the criteria are also shown in Table 2. The cost and performance index are in charge of 58.7% of the weights while the environmental issues and customs make less than 10% of the weights. Therefore, cost and performance index are the two most important factors in location decision.
Cost Land purchasingcost Construction cost opportunitiesRental Weight
Land purchasing cost 1.000 3.000 5.000 0.633
Construction cost 0.333 1.000 3.000 0.260
Rental opportunities 0.200 0.333 1.000 0.107
λ = 3.0387; RI = 0.58; CI = 0.0194; CR = 0.0334
Supply chain Suppliers network Logistics Ports Weight
Suppliers network 1.0000 3.0000 7.0000 0.6278
Logistics 0.3330 1.0000 7.0000 0.3129
Ports 0.1111 0.1429 1.0000 0.0594
λ = 3.0271; RI = 0.58; CI = 0.0136; CR = 0.0234
Workforces Minimum wages Labor force population Social insurance Weight
Minimum wages 1.0000 3.0000 5.0000 0.6334
Labor force population 0.3330 1.0000 3.0000 0.2604
Social insurance 0.2000 0.3333 1.0000 0.1062
λ = 3.0384; RI = 0.58; CI = 0.0192; CR = 0.0331
Environmental issues Sewage system Electroplatingcertification Regulations Weight
Sewage system 1.0000 0.2000 0.1429 0.0738
Electroplating certification 5.0000 1.0000 0.3333 0.2828
Regulations 7.0000 3.0000 1.0000 0.6434
λ = 3.0655; RI = 0.58; CI = 0.0328; CR = 0.0565
Customs Level of customs Bonded areas Effectiveness Weight
Level of customs 1.0000 3.0000 7.0000 0.6434
Bonded areas 0.3333 1.0000 5.0000 0.2828
Effectiveness 0.1429 0.2000 1.0000 0.0738
λ = 3.0655; RI = 0.58; CI = 0.0328; CR = 0.0565
Performance index Responsive time Order quantities On-time delivery Weight
Responsive time 1.0000 0.2000 0.3333 0.1062
Order quantities 5.0000 1.0000 3.0000 0.6333
On-time delivery 3.0000 0.3333 1.0000 0.2605
λ = 3.0387; RI = 0.58; CI = 0.0194; CR = 0.0334
Table 3. Pair-wise comparison matrix of subcriteria
network, minimum wages, regulations, level of customs, and order quantities also dominate other two subcriteria in supply chain, workforce, environmental issues, customs and performance index, respectively.
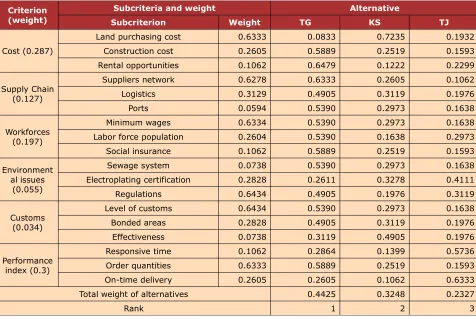
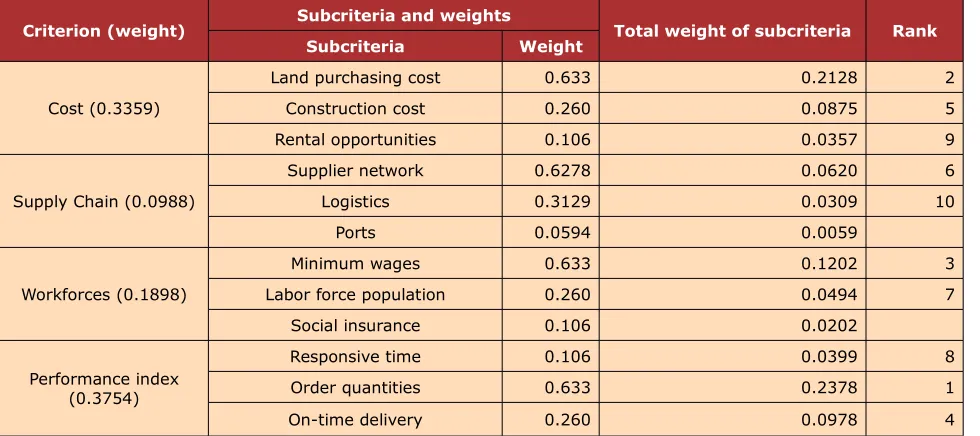
Criterion (weight) Subcriteria and weights Total weight ofsubcriteria Rank
Subcriteria Weight
Cost (0.287)
Land purchasing cost 0.6333 0.1816 2
Construction cost 0.2605 0.0747 6
Rental opportunities 0.1062 0.0304
Supply Chain (0.127)
Supplier network 0.6278 0.0799 4
Logistics 0.3129 0.0398 8
Ports 0.0594 0.0076
Workforces (0.197)
Minimum wages 0.6334 0.1246 3
Labor force population 0.2604 0.0512 7
Social insurance 0.1062 0.0209
Environmental issues (0.055)
Sewage system 0.0738 0.0041
Electroplating certification 0.2828 0.0157
Regulations 0.6434 0.0357 9
Customs (0.034)
Level of customs 0.6434 0.0218
Bonded areas 0.2828 0.0096
Effectiveness 0.0738 0.0025
Performance index (0.3)
Responsive time 0.1062 0.0318 10
Order quantities 0.6333 0.1899 1
On-time delivery 0.2605 0.0781 5
Table 4. The ranking of the subcriteria
Table 4 shows the results of ranking the subcriteria. Order quantities in the performance index criterion have the highest weight among other subcriteria. The weights of all three subcriteria in the performance index criterion are ranked in the top ten and two subcriteria (order quantities and on-time delivery) are also ranked in the top five. The subcriterion with the second highest weight is land purchasing cost while the third and fourth highest weights are minimum wages and logistics in workforce and supply chain, respectively.
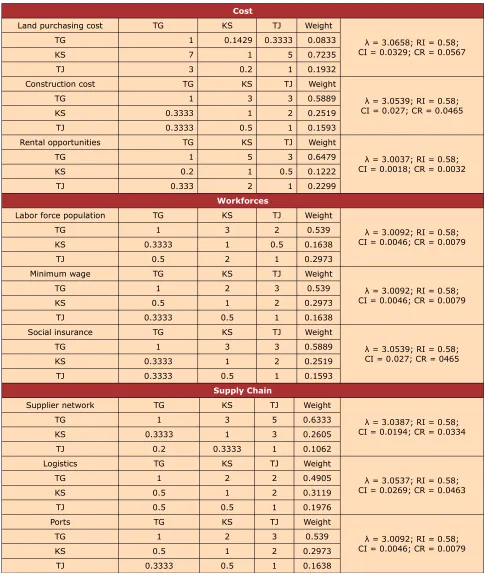
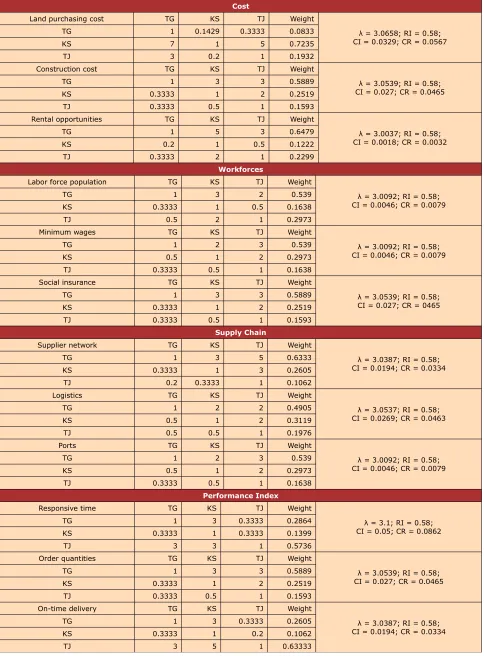
results. Also, TG outperforms the other two alternatives in all three subcriteria. For the subcriteria under supply chain, the results of suppliers network, logistics and ports are presented. CR values for these three subcriteria are less than 0.1, which indicate the consistency of the results. Also, TG outperforms the other two alternatives in all three subcriteria.
Cost
Land purchasing cost TG KS TJ Weight
λ = 3.0658; RI = 0.58; CI = 0.0329; CR = 0.0567
TG 1 0.1429 0.3333 0.0833
KS 7 1 5 0.7235
TJ 3 0.2 1 0.1932
Construction cost TG KS TJ Weight
λ = 3.0539; RI = 0.58; CI = 0.027; CR = 0.0465
TG 1 3 3 0.5889
KS 0.3333 1 2 0.2519
TJ 0.3333 0.5 1 0.1593
Rental opportunities TG KS TJ Weight
λ = 3.0037; RI = 0.58; CI = 0.0018; CR = 0.0032
TG 1 5 3 0.6479
KS 0.2 1 0.5 0.1222
TJ 0.333 2 1 0.2299
Workforces
Labor force population TG KS TJ Weight
λ = 3.0092; RI = 0.58; CI = 0.0046; CR = 0.0079
TG 1 3 2 0.539
KS 0.3333 1 0.5 0.1638
TJ 0.5 2 1 0.2973
Minimum wage TG KS TJ Weight
λ = 3.0092; RI = 0.58; CI = 0.0046; CR = 0.0079
TG 1 2 3 0.539
KS 0.5 1 2 0.2973
TJ 0.3333 0.5 1 0.1638
Social insurance TG KS TJ Weight
λ = 3.0539; RI = 0.58; CI = 0.027; CR = 0465
TG 1 3 3 0.5889
KS 0.3333 1 2 0.2519
TJ 0.3333 0.5 1 0.1593
Supply Chain
Supplier network TG KS TJ Weight
λ = 3.0387; RI = 0.58; CI = 0.0194; CR = 0.0334
TG 1 3 5 0.6333
KS 0.3333 1 3 0.2605
TJ 0.2 0.3333 1 0.1062
Logistics TG KS TJ Weight
λ = 3.0537; RI = 0.58; CI = 0.0269; CR = 0.0463
TG 1 2 2 0.4905
KS 0.5 1 2 0.3119
TJ 0.5 0.5 1 0.1976
Ports TG KS TJ Weight
λ = 3.0092; RI = 0.58; CI = 0.0046; CR = 0.0079
TG 1 2 3 0.539
KS 0.5 1 2 0.2973
TJ 0.3333 0.5 1 0.1638
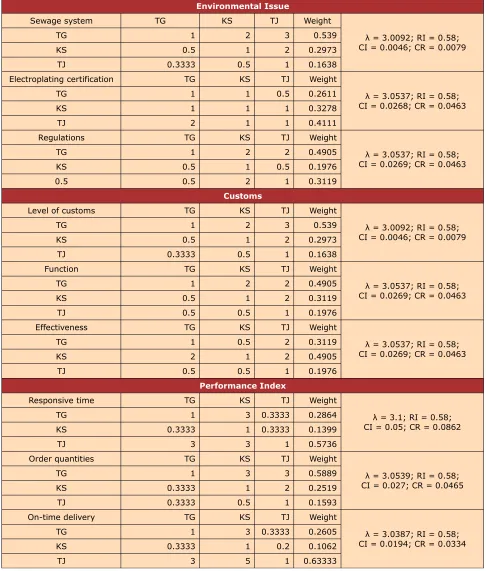
Environmental Issue
Sewage system TG KS TJ Weight
λ = 3.0092; RI = 0.58; CI = 0.0046; CR = 0.0079
TG 1 2 3 0.539
KS 0.5 1 2 0.2973
TJ 0.3333 0.5 1 0.1638
Electroplating certification TG KS TJ Weight
λ = 3.0537; RI = 0.58; CI = 0.0268; CR = 0.0463
TG 1 1 0.5 0.2611
KS 1 1 1 0.3278
TJ 2 1 1 0.4111
Regulations TG KS TJ Weight
λ = 3.0537; RI = 0.58; CI = 0.0269; CR = 0.0463
TG 1 2 2 0.4905
KS 0.5 1 0.5 0.1976
0.5 0.5 2 1 0.3119
Customs
Level of customs TG KS TJ Weight
λ = 3.0092; RI = 0.58; CI = 0.0046; CR = 0.0079
TG 1 2 3 0.539
KS 0.5 1 2 0.2973
TJ 0.3333 0.5 1 0.1638
Function TG KS TJ Weight
λ = 3.0537; RI = 0.58; CI = 0.0269; CR = 0.0463
TG 1 2 2 0.4905
KS 0.5 1 2 0.3119
TJ 0.5 0.5 1 0.1976
Effectiveness TG KS TJ Weight
λ = 3.0537; RI = 0.58; CI = 0.0269; CR = 0.0463
TG 1 0.5 2 0.3119
KS 2 1 2 0.4905
TJ 0.5 0.5 1 0.1976
Performance Index
Responsive time TG KS TJ Weight
λ = 3.1; RI = 0.58; CI = 0.05; CR = 0.0862
TG 1 3 0.3333 0.2864
KS 0.3333 1 0.3333 0.1399
TJ 3 3 1 0.5736
Order quantities TG KS TJ Weight
λ = 3.0539; RI = 0.58; CI = 0.027; CR = 0.0465
TG 1 3 3 0.5889
KS 0.3333 1 2 0.2519
TJ 0.3333 0.5 1 0.1593
On-time delivery TG KS TJ Weight
λ = 3.0387; RI = 0.58; CI = 0.0194; CR = 0.0334
TG 1 3 0.3333 0.2605
KS 0.3333 1 0.2 0.1062
TJ 3 5 1 0.63333
Table 6. Pair-wise comparison matrix among alternatives for subcriteria under cost, workforces, and supply chain
outperforms the other two alternatives in sewage system and regulations while TJ outperforms the other two alternatives in electroplating certification. For the subcriteria under customs, the results of level of customs, bonded areas, and effectiveness are presented. CR values for these three subcriteria are less than 0.1, which indicate the consistency of the results. Furthermore, TG outperforms the other two alternatives in level of customs and bonded areas while KS outperforms the other two alternatives in effectiveness. For the subcriteria under performance index, the results of responsive time, order quantities, and on-time delivery are presented. CR values for these three subcriteria are less than 0.1, which indicate the consistency of the results. Moreover, TJ outperforms the other two alternatives in responsive time and on-time delivery while TG outperforms the other two alternatives in order quantities.
Based on the ranking of the subcriteria in Table 4 and the pair-wise comparison matrices in Tables 5 and 6, some insights can be drawn from the tables. In Table 4, TG outperforms the other two alternatives in seven of the top ten subcriteria while TJ and KS outperform the other two alternatives in two and one of the top ten subcriteria, respectively. In addition, TG encounters the highest weight in order quantities, minimum wages, supplier network, construction cost, labor force population, bonded areas, and regulations that are ranked 1, 3, 4, 6, 7, 8, and 10, respectively. TJ encounters the highest weight in on-time delivery and responsive time that are ranked 5 and 9, respectively. KS has obtained the highest weight only in land purchasing cost that is ranked second within the subcriteria. Insights in Tables 4-6 indicate that TG might be the best choice among the three alternatives since it outperforms the other two alternatives in most of the subcriteria. Although an initial insight indicates TG to be the best choice, the decision should be based on the total weight of the three alternatives. The total weighted results for decision are demonstrated in Table 7.
Criterion (weight)
Subcriteria and weight Alternative
Subcriterion Weight TG KS TJ
Cost (0.287)
Land purchasing cost 0.6333 0.0833 0.7235 0.1932
Construction cost 0.2605 0.5889 0.2519 0.1593
Rental opportunities 0.1062 0.6479 0.1222 0.2299
Supply Chain (0.127)
Suppliers network 0.6278 0.6333 0.2605 0.1062
Logistics 0.3129 0.4905 0.3119 0.1976
Ports 0.0594 0.5390 0.2973 0.1638
Workforces (0.197)
Minimum wages 0.6334 0.5390 0.2973 0.1638
Labor force population 0.2604 0.5390 0.1638 0.2973
Social insurance 0.1062 0.5889 0.2519 0.1593
Environment al issues
(0.055)
Sewage system 0.0738 0.5390 0.2973 0.1638
Electroplating certification 0.2828 0.2611 0.3278 0.4111
Regulations 0.6434 0.4905 0.1976 0.3119
Customs (0.034)
Level of customs 0.6434 0.5390 0.2973 0.1638
Bonded areas 0.2828 0.4905 0.3119 0.1976
Effectiveness 0.0738 0.3119 0.4905 0.1976
Performance index (0.3)
Responsive time 0.1062 0.2864 0.1399 0.5736
Order quantities 0.6333 0.5889 0.2519 0.1593
On-time delivery 0.2605 0.2605 0.1062 0.6333
Total weight of alternatives 0.4425 0.3248 0.2327
Rank 1 2 3
Table 7. Rank of the alternatives
4.2. Sensitivity Analysis
According to Table 7, the orders of six criteria with the highest to lowest weights are performance index, cost, workforces, supply chain, environmental issues, and customs. Environmental issues and customs are together associated with only total weight of 8.9% that will not have significant impact on location selection. Based on the Pareto rule, environmental issues and customs will be removed from the criteria list. Therefore, the remaining four criteria will be applied to evaluate the alternatives using AHP.
Criteria Cost Supply chain Workforces Performanceindex Weight
Cost 1.00 3.00 2.00 1.00 0.3359
Supply chain 0.33 1.00 0.33 0.33 0.0988
Workforces 0.50 3.00 1.00 0.33 0.1898
Performance index 1.00 3.00 3.00 1.00 0.3754
In Table 8, presenting the pair-wise comparison results for four criteria, performance index and cost own the highest weights. As λ value is 4.1193 and RI value is 0.9, CI and CR values are 0.0398 and 0.0442, respectively. The CR value is less than 0.1, which indicates the consistency of the questionnaire results.
Table 9 demonstrates the results of pair-wise comparison matrix of subcriteria, all the CR values are less than 0.1, indicating the consistency of the subcriteria. In each criterion, the weight of a specific subcriterion dominates the weights of the other two subcriteria. For instance, Land purchasing cost weighs 0.633 in cost while the other two subcriteria, i.e., construction cost and rental opportunities, only are of much smaller weights of 0.26 and 0.107, respectively. Moreover, supplier network, minimum wages, and order quantities also dominate the other two subcriteria in supply chain, workforce, and performance index, respectively.
Cost Land purchasingcost Construction cost opportunitiesRental Weight
Land purchasing cost 1.00 3.00 5.00 0.6333
Construction cost 0.333 1.00 3.00 0.26
Rental opportunities 0.2 0.333 1.00 0.107
λ = 3.0387; RI = 0.58; CI = 0.0194; CR = 0.0334
Supply chain Suppliers network Logistics Ports Weight
Suppliers network 1.0000 3.0000 7.0000 0.6278
Logistics 0.3330 1.0000 7.0000 0.3129
Ports 0.1111 0.1429 1.0000 0.0594
λ = 3.0271; RI = 0.58; CI = 0.0136; CR = 0.0234
Workforces Minimum wages Labor forcepopulation Social insurance Weight
Minimum wages 1.0000 3.0000 5.0000 0.6334
Labor force population 0.3330 1.0000 3.0000 0.2604
Social insurance 0.2000 0.3333 1.0000 0.1062
λ = 3.0384; RI = 0.58; CI = 0.0192; CR = 0.0331
Performance index Responsive time Order quantities On-time delivery Weight
Responsive time 1.0000 0.2000 0.3333 0.1062
Order quantities 5.0000 1.0000 3.0000 0.6333
On-time delivery 3.0000 0.3333 1.0000 0.2605
λ = 3.0387; RI = 0.58; CI = 0.0194; CR = 0.0334
Criterion (weight) Subcriteria and weights Total weight of subcriteria Rank
Subcriteria Weight
Cost (0.3359)
Land purchasing cost 0.633 0.2128 2
Construction cost 0.260 0.0875 5
Rental opportunities 0.106 0.0357 9
Supply Chain (0.0988)
Supplier network 0.6278 0.0620 6
Logistics 0.3129 0.0309 10
Ports 0.0594 0.0059
Workforces (0.1898)
Minimum wages 0.633 0.1202 3
Labor force population 0.260 0.0494 7
Social insurance 0.106 0.0202
Performance index (0.3754)
Responsive time 0.106 0.0399 8
Order quantities 0.633 0.2378 1
On-time delivery 0.260 0.0978 4
Table 10. Ranking of the subcriteria for four criteria
Cost
Land purchasing cost TG KS TJ Weight
λ = 3.0658; RI = 0.58; CI = 0.0329; CR = 0.0567
TG 1 0.1429 0.3333 0.0833
KS 7 1 5 0.7235
TJ 3 0.2 1 0.1932
Construction cost TG KS TJ Weight
λ = 3.0539; RI = 0.58; CI = 0.027; CR = 0.0465
TG 1 3 3 0.5889
KS 0.3333 1 2 0.2519
TJ 0.3333 0.5 1 0.1593
Rental opportunities TG KS TJ Weight
λ = 3.0037; RI = 0.58; CI = 0.0018; CR = 0.0032
TG 1 5 3 0.6479
KS 0.2 1 0.5 0.1222
TJ 0.3333 2 1 0.2299
Workforces
Labor force population TG KS TJ Weight
λ = 3.0092; RI = 0.58; CI = 0.0046; CR = 0.0079
TG 1 3 2 0.539
KS 0.3333 1 0.5 0.1638
TJ 0.5 2 1 0.2973
Minimum wages TG KS TJ Weight
λ = 3.0092; RI = 0.58; CI = 0.0046; CR = 0.0079
TG 1 2 3 0.539
KS 0.5 1 2 0.2973
TJ 0.3333 0.5 1 0.1638
Social insurance TG KS TJ Weight
λ = 3.0539; RI = 0.58; CI = 0.027; CR = 0465
TG 1 3 3 0.5889
KS 0.3333 1 2 0.2519
TJ 0.3333 0.5 1 0.1593
Supply Chain
Supplier network TG KS TJ Weight
λ = 3.0387; RI = 0.58; CI = 0.0194; CR = 0.0334
TG 1 3 5 0.6333
KS 0.3333 1 3 0.2605
TJ 0.2 0.3333 1 0.1062
Logistics TG KS TJ Weight
λ = 3.0537; RI = 0.58; CI = 0.0269; CR = 0.0463
TG 1 2 2 0.4905
KS 0.5 1 2 0.3119
TJ 0.5 0.5 1 0.1976
Ports TG KS TJ Weight
λ = 3.0092; RI = 0.58; CI = 0.0046; CR = 0.0079
TG 1 2 3 0.539
KS 0.5 1 2 0.2973
TJ 0.3333 0.5 1 0.1638
Performance Index
Responsive time TG KS TJ Weight
λ = 3.1; RI = 0.58; CI = 0.05; CR = 0.0862
TG 1 3 0.3333 0.2864
KS 0.3333 1 0.3333 0.1399
TJ 3 3 1 0.5736
Order quantities TG KS TJ Weight
λ = 3.0539; RI = 0.58; CI = 0.027; CR = 0.0465
TG 1 3 3 0.5889
KS 0.3333 1 2 0.2519
TJ 0.3333 0.5 1 0.1593
On-time delivery TG KS TJ Weight
λ = 3.0387; RI = 0.58; CI = 0.0194; CR = 0.0334
TG 1 3 0.3333 0.2605
KS 0.3333 1 0.2 0.1062
TJ 3 5 1 0.63333
Table 11. Pair-wise comparison matrix among alternatives for subcriteria under cost
CR values for these three subcriteria are less than 0.1, which indicate the consistency of the results. Furthermore, TG outperforms the other two alternatives in construction cost and rental opportunities while KS outperforms the other two alternatives in land purchasing cost. For the subcriteria under workforces, results of labor force population, minimum wages, and social insurance are presented in Table 11. CR values for these three subcriteria are less than 0.1, which indicates the consistency of the results. Also, TG outperforms the other two alternatives in all three subcriteria. For the subcriteria under supply chain, results of supplier network, logistics, and ports are presented. CR values for these three subcriteria are again less than 0.1, which indicate the consistency of the results. Also, TG outperforms the other two alternatives in all three subcriteria. In Table 11, results of responsive time, order quantities, and on-time delivery are presented. CR values for these three subcriteria are less than 0.1, which indicate the consistency of the results. Moreover, TJ outperforms the other two alternatives in responsive time and on-time delivery while TG outperforms the other two alternatives in order quantities.
Based on the results of ranking the subcriteria in Table 10 and the pair-wise comparison matrices in Table 11, TG outperforms the other two alternatives in seven of the top ten ranked subcriteria while TJ and KS outperform the other two alternatives in two and one of the top ten subcriteria, respectively. Moreover, TG has the highest weight in order quantities, minimum wages, construction cost, suppliers network, labor force population, rental opportunities, and logistics that are ranked 1, 3, 5, 6, 7, 9, and 10, respectively. TJ encounters the highest weight in on-time delivery and responsive time, ranked 4 and 8, respectively. KS secures the highest weight only in land purchasing cost which is ranked 2 within the subcriteria. The total weighted results for decision are demonstrated in Table 12.
Criteria Subcriteria and weights Alternatives
Subcriteria Weight TG KS TJ
Cost (0.3359)
Land purchasing cost 0.6333 0.0833 0.7235 0.1932
Construction cost 0.2605 0.5889 0.2519 0.1593
Rental opportunities 0.1062 0.6479 0.1222 0.2299
Supply Chain (0.0988)
Supplier network 0.6278 0.6333 0.2605 0.1062
Logistics 0.3129 0.4905 0.3119 0.1976
Ports 0.0594 0.5390 0.2973 0.1638
Workforces (0.1898)
Minimum wages 0.6334 0.5390 0.2973 0.1638
Labor force population 0.2604 0.5390 0.1638 0.2973
Social insurance 0.1062 0.5889 0.2519 0.1593
Performance index (0.3754)
Responsive time 0.1062 0.2864 0.1399 0.5736
Order quantities 0.6333 0.5889 0.2519 0.1593
On-time delivery 0.2605 0.2605 0.1062 0.6333
Total weight of alternatives 0.4302 0.3327 0.2371
Rank 1 2 3
In Table 12, the total weights of TG, KS, and TJ are 0.4302, 0.3327, and 0.2371, respectively. Hence, TG will be the best choice among these three alternatives. Comparing the results in Tables 7 and 12, TG is the best alternative in both six and four criteria. The phenomenon could be resulted from the significant differences of weight among criteria. To realize the accuracy of the result achieved in the research and the impact level of criteria, findings have been discussed with the company’s high ranking managers. They confirmed the accuracy of the result and responded well to the reasons and levels of the criteria. Table 13 shows the managers' responses.
Criteria Sensitivity Managers' responses
Performance index High
The studied company is an OEM (Original Equipment Manufacturer) company and customer’s satisfactions are the most important concern for this company. Therefore, fulfilling the performance index is the main concern for constructing a new plant.
Cost High Constructing a new plant will have larger initial investment and reducing cost is always an important consideration for a company especially for its fiscal department.
Workforces High
The labor shortage in these years had caused the delay of the orders. A stable workforces will enhance a company’s fulfillment of on-time delivery and responsive time and will improve customer satisfaction.
Supply Chain Medium
In 3C manufacturing industries, hub warehouse is usually applied to avoid material or component shortage that reduces the impact of a poor supplier network. However, the logistics and distances to ports will affect hub inventory replenishment and order delivery. Therefore, the impact of supply chain on decision is at medium level.
Environmental issues Low The studied company has electroplating certification in all three alternatives and there is no difference in the environmental issues in these three alternatives.
Customs Low
The bonded areas have been implemented in all three locations for years and customs offices in these locations have always
cooperated with industries to hasten the process. Therefore, the effect of customs is low.
Table 13. Sensitivities of the criteria
4.3. Implementation of the Concept
To implement the proposed framework in practice, a process flow of location selection is demonstrated using Figure 2. In Figure 2, a decision making board will be formed to review the criteria and final results of AHP once the location selection is acquired. The board will determine whether the criteria should be renewed or be constructed. If the criteria have to be renewed or be constructed, the board will obtain criteria using Delphi method. Once the criteria are constructed, results will be achieved using AHP and presented to the decision making board for final decision.
Figure 2. Process flow in location selection
5. Conclusion and Future Research
References
Amiri, M.P. (2010). Project selection for oil-fields development by using the AHP and fuzzy TOPSIS methods. Expert Systems with Applications, 37, 6218-6224.
http://dx.doi.org/10.1016/j.eswa.2010.02.103
Arbabani, A.B., & Farahani, R.Z. (2012). Facility location dynamics: An overview of classifications and applications. Computers & Industrial Engineering, 62, 408-420.
http://dx.doi.org/10.1016/j.cie.2011.09.018
Balinski, M.L. (1965). Integer Programming: Methods, Uses, Computation. Management Science, 12, 253-313. http://dx.doi.org/10.1287/mnsc.12.3.253
Büyüközkan, G., Çifçi, G., & Güleryüz, S. (2011). Strategic analysis of healthcare service quality using fuzzy AHP methodology. Expert Systems with Applications, 38, 9407-424.
http://dx.doi.org/10.1016/j.eswa.2011.01.103
Calabrese, A., Costa, R., & Menichini, T. (2013). Using fuzzy AHP to manage intellectual capital assets: An application to the ICT service industry. Expert Systems with Applications, 40, 3747-3755. http://dx.doi.org/10.1016/j.eswa.2012.12.081
Canbolat, M.S., & von Massow, M. (2011). Location emergency facilities with random demand for risk minimization. Expert Systems with Applications, 38, 10099-10106.
http://dx.doi.org/10.1016/j.eswa.2011.02.001
Chen, M.K., & Wang, S.-C. (2010). The critical factors of success for information service industry in developing international market: Using analytic hierarchy process (AHP) approach.
Expert Systems with Applications, 37, 694-704. http://dx.doi.org/10.1016/j.eswa.2009.06.012
Choudhary, D. & Shankar, R. (2012). A Steep-fuzzy AHP-TOPSIS framework for evaluation and selection of thermal power plant location: A case study from India. Energy, 42, 510-521.
http://dx.doi.org/10.1016/j.energy.2012.03.010
Church, R.L., & Revelle, C.S. (1976). Theoretical and Computational Links Between The p-median Location Set-Covering and the Maximal Covering Location Problem. Geographical Analysis, 8, 406-415. http://dx.doi.org/10.1111/j.1538-4632.1976.tb00547.x
Dagdeviren, M., Yavuz, S., & Kilinc, N. (2009). Weapon selection using the AHP and TOPSIS methods under fuzzy environment. Expert Systems with Applications, 36, 8143-8151.
http://dx.doi.org/10.1016/j.eswa.2008.10.016
Farahani, R.Z., SteadieSeifi, M., & Asgari, N. (2010). Multiple criteria facility location problems: A survey. Applied Mathematical Modelling, 34, 1689-1709.
Gaudenzi, B., & Borghesi, A. (2006). Managing risks in the supply chain using the AHP method.
International Journal of Logistics Management, 17(1), 114-136.
http://dx.doi.org/10.1108/09574090610663464
Gulpinar, N., Pachamanova, D., & Canakoglu, E. (2013). Robust strategies for facility location under uncertainty. European Journal of Operational Research, 225, 21-35.
http://dx.doi.org/10.1016/j.ejor.2012.08.004
Hahn, E.D., & Bunyaratavej, K. (2010). Services cultural alignment in offshoring: The impact of cultural dimensions on offshoring location choices. Journal of Operations Management, 28, 186-193. http://dx.doi.org/10.1016/j.jom.2009.10.005
Handley, S.M., & Benton Jr., W.C. (2013). The influence of task-and location-specific complexity on the control and coordination costs in global outsourcing relationships. Journal of Operations Management, 31, 109-128. http://dx.doi.org/10.1016/j.jom.2012.12.003
Ho, W., He, T., Lee, C.K.M., & Emourznejad, A. (2012). Strategic logistics outsourcing: An integrated QFD and fuzzy AHP approach. Expert Systems with Applications, 39, 10841-10850.
http://dx.doi.org/10.1016/j.eswa.2012.03.009
Hong, L., & Xiaohua, Z. (2011). Study on location selection of multi-objective emergency logistics center based on AHP. Procedia Engineering, 15, 2128-2132.
http://dx.doi.org/10.1016/j.proeng.2011.08.398
Huff, D.L. (1966). A Programmed Solution for approximating an optimum retail location. Land Economics, 42, 293-303. http://dx.doi.org/10.2307/3145346
Ishizaka, A., & Labib, A. (2011). Review of the main developments in the analytic hierarchy process. Expert Systems with Applications, 38, 14336-14345.
http://dx.doi.org/10.1016/j.eswa.2011.04.143
Jaques, N., & Morgan, C. (2004). Adapting the Analytical Hierarchy Process to identify inventory risk. International Journal of Logistics Management, 15(2), 93-105.
http://dx.doi.org/10.1108/95740930480000354
Jung, H. (2011). A fuzzy AHP-GP approach for integrated production-planning considering manufacturing partners. Expert Systems with Applications, 38, 5833-5840.
http://dx.doi.org/10.1016/j.eswa.2010.11.039
Lee, J.M., & Lee, Y.H. (2012). Facility location and scale decision problem with customer preference. Computers & Industrial Engineering, 63, 184-191.
http://dx.doi.org/10.1016/j.cie.2012.02.005
Lee, S., Kim, W., Kim, Y.M., & Oh, K.J. (2012). Using AHP to determine intangible priority factors for technology transfer adoption. Expert Systems with Applications, 39, 6388-6395.
http://dx.doi.org/10.1016/j.eswa.2011.12.030
Marin, A. (2011). The discrete facility location problem with balanced allocation of customers.
European Journal of Operational Research, 210, 27-38. http://dx.doi.org/10.1016/j.ejor.2010.10.012
McDermott, C.M., & Stock, G.N. (2011). Focus as emphasis: Conceptual and performance implications for hospitals. Journal of Operations Management, 29, 616-626.
http://dx.doi.org/10.1016/j.jom.2011.02.002
Nozick, L.K., & Turnquist, M.A. (2001). Inventory, Transportation, Service Quality and the Location of Distribution Centers. European Journal of Operational Research, 129, 362-371.
http://dx.doi.org/10.1016/S0377-2217(00)00234-4
Ounnar, F., & Pujo, P. (2005). Evaluating suppliers within a self-organized logistical network.
International Journal of Logistics Management, 16(1), 159-172.
http://dx.doi.org/10.1108/09574090510617402
Partovi, R. (2006). An analytic model for locating facilities strategically. Omega, 34, 41-55.
http://dx.doi.org/10.1016/j.omega.2004.07.018
Rad, A., Naderi, B., & Soltani, M., 2011. Clustering and ranking university majors using data mining and AHP algorithms: A case study in Iran. Expert Systems with Applications, 38, 755-763.
http://dx.doi.org/10.1016/j.eswa.2010.07.029
Randhawa, S.U., & West, T.M. (1995). An Integrated Approach to Facility Location Problems.
17th International Conference on Computers and Industrial Engineering, 29(1-4), 261-265.
http://dx.doi.org/10.1016/0360-8352(95)00082-C
Saaty, TL. (1980). The analytic hierarchy process. New York, USA: McGraw Hill.
Saaty, TL. (1990). How to mark a decision: the analytic hierarchy process. European Journal of Operational Research, 48, 9-26. http://dx.doi.org/10.1016/0377-2217(90)90057-I
Tzeng, G.H., Teng, M.H., Chen, J.J., & Opricovic, S. (2002). Multicriteria selection for a restaurant location in Taipei. Hospitality Management, 21, 171-187.
http://dx.doi.org/10.1016/S0278-4319(02)00005-1
Vahidnia, M.H., Alesheikh, A.A., & Alimohammadi, A. (2009). Hospital site selection using fuzzy AHP and its derivatives. Journal of Environmental Management, 90, 3048-3056.
http://dx.doi.org/10.1016/j.jenvman.2009.04.010
Vidal, L.-A., Sahin, E., Martelli, N., Berhoune, M., & Bonan, B. (2010). Applying AHP to select drugs to be produced by anticipation in a chemotherapy compounding unit. Expert Systems with Applications, 37, 1528-1534. http://dx.doi.org/10.1016/j.eswa.2009.06.067
Vidal, L.-A., Marie, F., & Bocquet, J.-C. (2011). Using a Delphi process and the Analytic Hierarchy Process (AHP) to evaluate the complexity of projects. Expert Systems with Applications, 38, 5388-5405. http://dx.doi.org/10.1016/j.eswa.2010.10.016
Wu, C.R., Lin, C.T., & Chen, H.C. (2007). Optimal selection of location for Taiwanese hospitals to ensure a competitive advantage by using the analytic hierarchy process and sensitivity analysis. Building and Environment, 42, 1431-1444. http://dx.doi.org/10.1016/j.buildenv.2005.12.016
Zhang, Y., Deng, X., Wei, D., & Deng, Y. (2012). Assessment of E-Commerce security using AHP and evidential reasoning. Expert Systems with Applications, 39, 3611-3623.
http://dx.doi.org/10.1016/j.eswa.2011.09.051
Journal of Industrial Engineering and Management, 2015 (www.jiem.org)
Article's contents are provided on an Attribution-Non Commercial 3.0 Creative commons license. Readers are allowed to copy, distribute and communicate article's contents, provided the author's and Journal of Industrial Engineering and Management's names are included.