R E S E A R C H
Open Access
Agent-based modeling of autophagy reveals
emergent regulatory behavior of spatio-temporal
autophagy dynamics
Christoph S Börlin
1,2,3, Verena Lang
3,4, Anne Hamacher-Brady
3,4*and Nathan R Brady
1,2,3*Abstract
Background:Autophagy is a vesicle-mediated pathway for lysosomal degradation, essential under basal and stressed conditions. Various cellular components, including specific proteins, protein aggregates, organelles and intracellular pathogens, are targets for autophagic degradation. Thereby, autophagy controls numerous vital physiological and pathophysiological functions, including cell signaling, differentiation, turnover of cellular components and pathogen defense. Moreover, autophagy enables the cell to recycle cellular components to metabolic substrates, thereby permitting prolonged survival under low nutrient conditions. Due to the multi-faceted roles for autophagy in maintaining cellular and organismal homeostasis and responding to diverse stresses, malfunction of autophagy contributes to both chronic and acute pathologies.
Results:We applied a systems biology approach to improve the understanding of this complex cellular process of autophagy. All autophagy pathway vesicle activities, i.e. creation, movement, fusion and degradation, are highly dynamic, temporally and spatially, and under various forms of regulation. We therefore developed an agent-based model (ABM) to represent individual components of the autophagy pathway, subcellular vesicle dynamics and metabolic feedback with the cellular environment, thereby providing a framework to investigate spatio-temporal aspects of autophagy regulation and dynamic behavior. The rules defining our ABM were derived from literature and from high-resolution images of autophagy markers under basal and activated conditions. Key model parameters were fit with an iterative method using a genetic algorithm and a predefined fitness function. From this approach, we found that accurate prediction of spatio-temporal behavior required increasing model complexity by implementing functional integration of autophagy with the cellular nutrient state. The resulting model is able to reproduce short-term autophagic flux measurements (up to 3 hours) under basal and activated autophagy conditions, and to measure the degree of cell-to-cell variability. Moreover, we experimentally confirmed two model predictions, namely (i) peri-nuclear concentration of autophagosomes and (ii) inhibitory lysosomal feedback on mTOR signaling.
Conclusion:Agent-based modeling represents a novel approach to investigate autophagy dynamics, function and dysfunction with high biological realism. Our model accurately recapitulates short-term behavior and cell-to-cell variability under basal and activated conditions of autophagy. Further, this approach also allows investigation of long-term behaviors emerging from biologically-relevant alterations to vesicle trafficking and metabolic state.
Keywords:Agent-based modeling, Autophagy, Autophagic flux, Cell-to-cell variability, Systems biology, Computational biology, mTOR, Lysosomes
* Correspondence:[email protected];[email protected]
3Bioquant, Heidelberg University, INF 267, 69120 Heidelberg, Germany Full list of author information is available at the end of the article
Background
The autophagy pathway
Macroautophagy (hereafter referred to as autophagy) is a catabolic process by which intracellular components such as proteins and organelles are delivered to lyso-somal degradation, which permits the cell the ability to maintain energetic homeostasis during nutrient depriva-tion (ND) [1]. The autophagy pathway can be divided in four distinct steps. (1) A double-membrane structure, the phagophore nucleates in the cytosol. (2) Thereafter, the phagophore expands and encloses cellular proteins and or-ganelles within a double-membrane organelle, the autop-hagosome. (3) The autophagosome then fuses with a lysosome to form an autolysosome. (4) Here, the autopha-gosome and its sequestered contents are degraded by lysosomal hydrolases (for a review see [2]).
Autophagy is negatively regulated by the anabolic PI3K/Akt/mTOR signaling pathway. Growth factors and amino acid abundance promote mTOR activity, which suppresses autophagy to a basal level [3]. Cellular stresses, including hypoxia [4] and low levels of energy/ amino acids [5], result in mTOR inactivation, and the resulting activation of autophagy through Beclin-1 activation of the Class III PI3K, Vps34, coordinating the nucleation and formation of autophagosomes within the cytosol [2]. Autophagosomes target cytosolic compo-nents through ordered bulk degradation [6], or selective targeting by autophagy receptors [7-9].
Spatial regulation of autophagy
An emerging body of evidence demonstrates that the regulation of individual steps within the autophagy path-way occurs locally, at subcellular compartments. Amino acids signal mTOR activation from within the lysosomal lumen [10], but also through cytosolic amino acid sens-ing [11,12]. In addition, components of the autophagy process are distributed in a heterogeneous and dynamic manner. While autophagosome formation occurs through-out the cell, matured autophagosomes are transported on microtubules in a dynein-dependent manner towards the nucleus [13]. Another important spatial aspect of autoph-agy concerns lysosomal positioning within the cell, which is affected by nutrient availability. Starvation conditions promote lysosomal clustering at the nucleus, whereas restoration of nutrient levels leads to reordering of the lysosomes towards the plasma membrane [14,15]. ND therefore influences autophagy at the levels of pathway regulation and vesicle positioning. On one hand, ND in-creases both phagophore and lysosome formation via the inhibition of mTOR [16]. On the other hand, ND impacts the amount of fusion events occurring between lysosomes and autophagosomes by reordering lysosomes towards the cell center, and therefore bringing autophagosomes and lysosomes into close proximity.
Computational modeling of cellular processes
Systems biology models of a cellular process allow for dynamic exploration of biological findings and the identification of non-intuitive emergent system behavior [17]. The most common systems biology approach to pathway modeling uses ordinary differential equations (ODE) to explicitly describe component interactions and cellular processes. ODEs are solved to predict model component behaviors, in terms of concentration changes over time. An alternative approach is agent based model-ing (ABM), which relies on a predefined logical program-ming language to implement source code representing cellular processes within a software framework. With an ABM approach one can make use of the advantages of a programming language, such as loops and other control structures, self-defined functions and hierarchical ordering of procedures, in order to create an implicit and robust description of cellular processes. Based on protein and second messenger interactions, ODE modeling has been used to predict dynamics of autophagosome behavior under varied autophagy activity states [18] and in response to apoptotic stimuli [19], with model predictions in accordance with experimental measurements. However, ODE modeling assumes a ‘mixed-bag’ environment, and cannot account for non-homogenous distributions of model components. ABMs can simulate temporal and spatial evolution of a system, where each participant in the model is represented as an individual agent following its own rule set, which encodes characteristics that determine behavior and interaction with other agents. Emergent be-havior results from the individual bebe-havior of each agent, and spatio-temporally determined interactions among agents [20]. While ABMs are commonly applied in non-biological modeling [20], recently studies using ABMs have captured population-level emergent behavior, includ-ing mitochondrial fusion and fission events [21] and apop-totic death receptor dynamics [22], thereby demonstrating the benefit of including spatial information.
Study rationale
Autophagy is required for maintaining cellular homeo-stasis, and dysfunction at different steps of autophagy is causative in both chronic diseases, including cancers and different neurodegenerative disorders [23], and acute diseases, including cardiac and neuronal ischemic injuries [24]. As such, strategies to experimentally target different autophagy steps is subject of intense study [25-28].
imbalances. Through simulations and experimental inves-tigations, this approach revealed that applying a lysosomal inhibitor used to interfere with autophagic flux, rapidly (minutes to hours) resulted in mTOR inhibition. Further-more, we demonstrate that accurate spatio-temporal mod-eling of autophagy required increasing model complexity, by integrating functional autophagy with the cellular nu-trient state. The resulting model recapitulates with high accuracy the observed short-term behavior of autophagic flux under different conditions, including the cell-to-cell variability, and is capable of addressing long-term behav-iors corresponding to biologically-relevant, minor alter-ations to vesicle transport and metabolic state.
Results
Agent-based model of autophagosome formation and degradation by lysosomes
Using the NetLogo ABM platform [29], we first con-structed a core model of autophagy, conceptualized as procedures describing 4 agents. The process starts with the formation of a phagophore (PP) which then grows and matures into an autophagosome (AP). This autopha-gosome then fuses with a lysosome (LY) to generate an autolysosome (AL). The newly formed autolysosomes can then either fuse with lysosomes, autophagosomes or
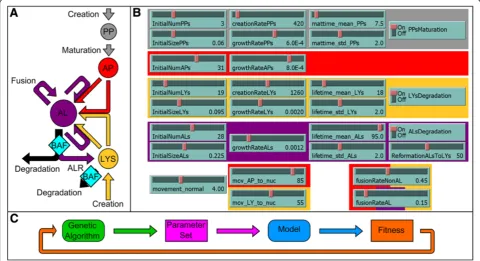
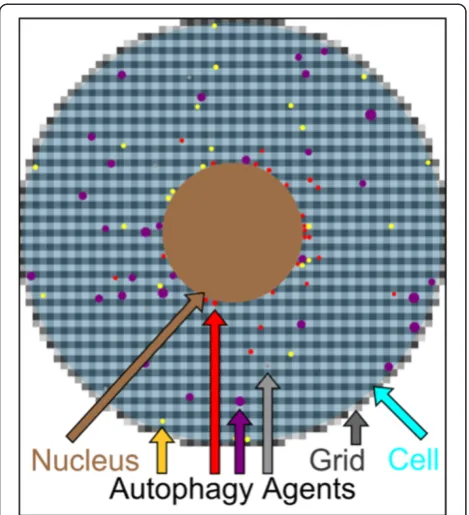
other autolysosomes to grow. During these processes the autolysosome reaches its maximum lifetime, and then is degraded and removed from the system. To simulate or-ganelle movements we assumed random motion for pha-gophores and autolysosomes, while autophagosomes and lysosomes move directly towards or directly away from the nucleus to mimic their active transport along the cytoskeleton, with a speed that is independent of its size [30]. The resulting model schematic, describing the 4 different autophagic agents and their possible actions, is shown in Figure 1A. The corresponding model parameters are shown in Figure 1B and Figure 1C displays the fitting process implemented. The core autophagy NetLogo Model is available in the Supplementary Information, Additional file 1. The cell was modeled as a circle with a 30μm diameter consisting of a grid of 0.5*0.5μm cytosolic areas. For spatial realism, the nucleus was included as a circle with a 10μm diameter, as shown in Figure 2. Time steps (dt) are modeled in 1 minute increments.
Single-cell quantification of autophagy under growth and nutrient deprivation conditions
In order to parameterize our model, we measured autoph-agy activity steps in MCF7 breast cancer cells, at 3 hours under full medium (FM) conditions (basal autophagy),
Figure 1Overview of the core model of autophagy. ASchematic describing interaction of the four agent types. Each agent is color-coded; phagophores (PP) in grey, autophagosomes (AP) in red, lysosomes (LYS) in yellow and autolysosomes (AL) in purple. Merging arrows represent fusion events between the two agents to form or expand an autolysosome. Arrows marked with BAF indicate inhibition by Bafilomycin A1. Black arrows represent degradation events.BOverview of the ABM parameter set. Agent parameter colors correspond to the color code used inA.
and at 3 hours of ND conditions (activated autophagy). Bafilomycin A1 (BAF, 100 nM), an inhibitor of the lyso-somal v-ATPase [31] was applied in order to reveal au-tophagic flux [32]. We detected endo-lysosomal signaling using GFP-Rab7 [33], which participates in the fusion be-tween lysosomes, autophagosomes and autolysosomes and is therefore located in lysosomal and autolysosomal mem-branes [2]. We detected autophagosomes using mCherry-LC3B, a main component of autophagosomal and autoly-sosomal membranes [34]. A representative image of cells under FM conditions is shown in Figure 3A-C, and a rep-resentative image under FM conditions with the addition of BAF is shown in Figure 3D-F. From segmented single-cell image masks, we identified Rab7(+)/LC3B(-) vesicles as endo-lysosomes (green arrows), Rab7(-)/LC3B(+) vesi-cles as autophagosomes (red arrows), and Rab7(+)/LC3B (+) vesicle as autolysosomes (yellow arrows). For all conditions and vesicles types, we calculated vesicle count (Figure 3G) and vesicle size (Figure 3H).
Our results demonstrate that autophagy responses var-ied from cell-to-cell, most pronounced under ND con-ditions. Notably, ND increased autophagosomal count approximately 1.5 fold, increased lysosomal count ap-proximately 2 fold, and slightly increased autolysosomal count, but did not increase vesicle sizes. This increase in
vesicle counts under ND conditions, i.e. under activated conditions of autophagy, showed the acceleration of autophagic activity in comparison to its basal level under FM conditions. Importantly, this acceleration by ND was best revealed under conditions of BAF treatment, reflect-ing the previously reported fast turnover of formed autophagosomes (i.e. autophagic flux) [35]. The addition of BAF increased the vesicle size as well as the vesicle count of lysosomes, most notably for autolysosomes. Inter-estingly, BAF had no effect on the vesicle sizes of autopha-gosomes and lead to a reduction of autophagosome counts, presumably due to maintained autophagosome-lysosome fusion events [36], consistent with the elevated numbers of lysosomes and autolysosomes.
Data-driven model parameter fitting for basal autophagic activity
In order to parameterize our model using single-cell measurements we created a fitness function (described in Materials and methods), which was minimized via a fitting procedure including a genetic algorithm, as out-lined in Figure 1C. For each parameter set, the mean result of 100 simulations was calculated and compared to the biological data, in order to calculate a fitness value corresponding to the similarity between the mean model results and the biological data. The parameter set for the core model was simultaneously optimized for FM condi-tions, with and without BAF.
To compare the accuracy of the fit for the best-found parameter set, the fitness values of 200 randomly chosen parameter sets (every parameter was chosen from a spe-cified range of values) were calculated and the results are shown in Table 1. Results demonstrate that the best-found parameter set was significantly better than a ran-domly chosen parameter set. The best-found parameter set is detailed in Table 2. The simulated time course results for each of the four types of agents from 100 runs of the best-found parameter set are shown in Figure 4A-D, while the mean and the standard deviation of the results after 180 minutes of simulation are shown in Figure 4E-F, with a direct comparison to the biological data (Figure 3).
Limitations to parameter fitting identifies that inhibition of lysosomes through BAF rapidly suppresses mTOR While our simulation results were consistent with mea-sured basal autophagy activities, parameter fitting was not sufficiently optimized for conditions of lysosomal in-hibition. Compared to experimental measurements, the model predicts insufficient numbers of lysosomes and autophagosomes, and greater numbers of autolysosomes (Figure 4E-F). This disagreement between simulation and experimental observations suggested additional biological mechanisms and/or regulatory steps were not present in our model. Interestingly, it was recently
Figure 2Implementation of the core model of autophagy.
proposed that inhibition of lysosomal function may decrease mTOR activity [37]. As performed here, autophagic flux measurements commonly involve the comparison of autophagy measures under the (mostly short-term) presence versus absence of lysosomal inhibi-tors [32]. As such, reduced mTOR activity by lysosomal inhibition could influence autophagic flux measurements. While the short-term effect of lysosomal inhibition on mTOR activity state is undetermined, it has indeed been shown that prolonged (overnight to 24 hours) lysosomal inhibition by BAF [38] or the lysosomotropic agent chloroquine [16] results in mTOR inactivation. Import-antly, such inhibition of mTOR could be responsible for an enhancement of autophagosomal [39] and lysosomal formation [16,40,41], and, together with the known posi-tive influence of mTOR on autolysosomal reformation (ALR) [42,43], could explain the difference between our model predictions and experimental observations.
We therefore measured the effect of short-term lyso-somal inhibition by BAF on mTOR activity, under basal and activated autophagy conditions. HeLa cells were sub-mitted to FM or ND conditions, with or without 100 nM BAF for the indicated time periods. To monitor mTOR activity, levels and phosphorylation state of its target, the translation repressor 4E-BP1 [32], were analyzed by Western blot (Figure 5). While levels of 4E-BP1 and T37/ 46 phosphorylated 4E-BP1 (p-4E-BP1) were stable in FM conditions, treatment of cells with BAF under FM tions decreased p-4EBP1 within 1 hour. Under ND condi-tions, levels of p-4E-BP1 were decreased at 0.5 hours, and further decreased at 1 hour. Treatment with BAF under ND conditions further enhanced this decrease in p-4E-BP1 at both 0.5 and 1 hour. Of note, total levels of 4E-p-4E-BP1 increased under FM in response to BAF, under ND alone, and further with ND/BAF, in accordance with degradation of phosphorylated 4E-BP1 [44].
Figure 3Single cell analysis of autophagic flux in MCF7 cells.MCF7 cells stably co-expressing GFP-Rab7 (green) and mCherry-LC3 (red) were submitted to FM and ND conditions for 3 hours, in the absence and presence of BAF (100 nM).AMerged image of a typical cell under FM conditions.
B-CIndividual green and red channels of(A)are shown as inverted black-white images and corresponding segmented masks.DMerged image of a typical cell under FM conditions with BAF inhibition of lysosomes.E-FIndividual green and red channels of(D)are shown as inverted black-white images and corresponding segmented masks.A-FGreen arrows indicate Rab7(+)/LC3B(-) endo-lysosomes, red arrows indicate Rab7(-)/LC3B(+) autophagosomes, and yellow arrows indicate Rab7(+)/LC3B(+) autolysosomes.GHistogram displaying APs, LYs, ALs vesicle numbers for the different conditions (left), and list of the corresponding mean values (right).HHistogram displaying APs, LYs, ALs vesicle sizes for the different conditions (left), and list of the corresponding mean values (right). Number of analyzed cells: FM 8, FM/BAF 4, ND 14, ND/BAF 7.
Table 1 Comparison of the best-found parameter set for the core model with 200 randomly generated parameter sets
Condition Mean fitness of 200 randomly generated parameter sets
Best fitness of 200 randomly generated parameter sets
Fitness of the best parameter set
Average deviation of the best parameter set to the biological data
FM 303783.2 6761.225 65.4 3.3%
These experimental data demonstrate that BAF acts rapidly to suppress mTOR on a time scale of minutes to hours. Thus, together, experimental and simulation re-sults reveal the need to control for the impact of BAF-mediated lysosomal inhibition on mTOR activity, and to determine if a correction is required for experimental determination of autophagic flux.
Realistic simulations of autophagy dynamics require integration of nutrient uptake and recycling
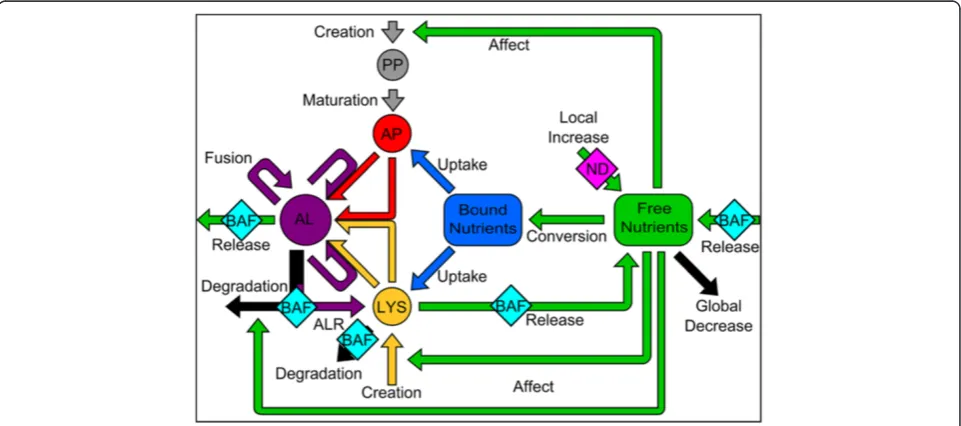
The above findings illustrate the fundamental relation-ship between metabolic signaling and autophagy activ-ities. We therefore implemented a metabolic function for autophagy, by including an environmental source for and autophagy-mediated turnover of nutrients (Figure 6, NetLogo model file as Additional file 2). The cellular nu-trient status was defined as a combination of two dis-tinct nutrient-type global values. The first was denoted as free nutrients, representing amino acids and other basic biochemical building blocks which are not in this
form targeted by autophagosomes. The second was de-noted as bound nutrients, representing proteins and other macromolecules which can be taken up and degraded by autophagy. Anabolic events are represented by free nutri-ents undergoing a conversion to bound nutrinutri-ents at a parameterized rate. Catabolic events are simulated as two events corresponding to (i) non-macroautophagy lyso-somal degradation processes (e.g. [45]), which are regu-lated by lysosomal conversion of bound nutrient back to free nutrient at a parameterized rate, and (ii) release of degraded autophagy substrates during degradation of the autolysosome. We assumed that the amount of free nutri-ents released by degrading autolysosomes was equivalent to the amount of bound nutrients consumed by its precur-sor autophagosomes (Table 3).
In the core autophagy model (Figure 1), we considered the creation rate of phagophores and lysosomes, the degradation rate of autolysosomes, and the lysosomal positioning in the cell, to be independent parameters. To couple autophagy with metabolic state, we subse-quently integrated these parameters with the environ-mental level of free nutrients. In this integrative model (Figure 6), low levels of free nutrients increase the cre-ation of phagophores and lysosomes and reduce degrad-ation of autolysosomes. Further, as lysosomal positioning is dependent on available free nutrients [14,15], low levels of free nutrients reorders lysosomes towards the nucleus.
For this integrative model a different parameter fitting strategy was employed, consisting of two independent steps. As an initial step, the model was fit to FM condi-tions, and a good parameter set with a fitness value of 81.3 was obtained. On average the integrative model differed less than 4% from the biological data. Next, with this initial parameter set, the best fit was determined for the effect of BAF, ND, and the combination of both on the creation rate of phagophores and lysosomes, on the degradation of autolysosomes, and on lysosomal posi-tioning. The best fit results, including the resulting amount of free nutrients in the cell after 180 minutes of simulations, are shown in Table 4.
A good fitness value resulted in increased autolysoso-mal degradation under ND conditions, as expected. However, compared to FM conditions, under ND condi-tions with the addition of BAF, a higher rate of autolyso-somal degradation was needed in order to obtain a good fit, suggesting that a basal level of lysosomal function oc-curs under BAF conditions. The mode of action for BAF is to inhibit V-ATPase-mediated acidification of the lysosomal lumen [31]. Thus, this prediction is plausible, as lysosomal hydrolases are maximally active at low pH, but maintain some functionality at neutral pH [46]. Fur-thermore, the direction of change in the creation rate of phagophores and lysosomes was as expected, as all three
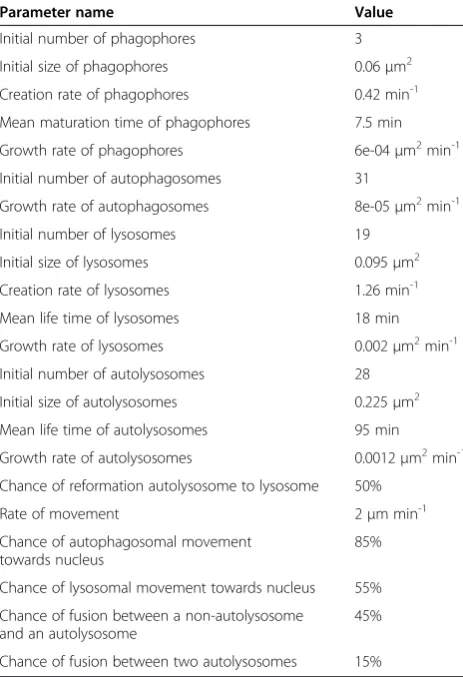
Table 2 Overview of the main used parameters for the core model
Parameter name Value
Initial number of phagophores 3
Initial size of phagophores 0.06μm2
Creation rate of phagophores 0.42 min-1
Mean maturation time of phagophores 7.5 min
Growth rate of phagophores 6e-04μm2min-1
Initial number of autophagosomes 31
Growth rate of autophagosomes 8e-05μm2min-1
Initial number of lysosomes 19
Initial size of lysosomes 0.095μm2
Creation rate of lysosomes 1.26 min-1
Mean life time of lysosomes 18 min
Growth rate of lysosomes 0.002μm2min-1
Initial number of autolysosomes 28
Initial size of autolysosomes 0.225μm2
Mean life time of autolysosomes 95 min
Growth rate of autolysosomes 0.0012μm2min-1
Chance of reformation autolysosome to lysosome 50%
Rate of movement 2μm min-1
Chance of autophagosomal movement towards nucleus
85%
Chance of lysosomal movement towards nucleus 55%
Chance of fusion between a non-autolysosome and an autolysosome
45%
Chance of fusion between two autolysosomes 15%
tested conditions showed an increased production of these two agents, with an increase correlating with the difference in the free nutrients.
Importantly, lysosomal positioning in response to the availability of free nutrient levels is crucial for the activa-tion and the fusion processes of autophagy [14,15]. To link the change of rates and positioning with the change in free nutrient levels, a function of the following formula was fit to the data obtained from the fitting procedure (Table 4):
linear factordelta nutritionexponential factorþ1
The best results for simulating autolysosome degrad-ation were obtained by allowing BAF to reduce the
degradation by a factor of 20. Of note, this substantial deceleration was partly reversed by the increase of deg-radation in response to the lack of free nutrients, so that the measured values, as shown in Table 4, were reached. These fitted functions were then implemented in the in-tegrative model, and the mean output for this parameter set was calculated for 100 simulations.
As an index to evaluate the accuracy of this best-found parameter set, its fitness value was compared to the fitness values of 200 randomly generated parameter sets (Table 5). Our best obtained fit, based on 100 measurements, showed 14-fold higher accuracy than the randomly generated parameter set. Moreover, the inte-grative model including these fitted functions closely resembles the biological data, with a difference less than
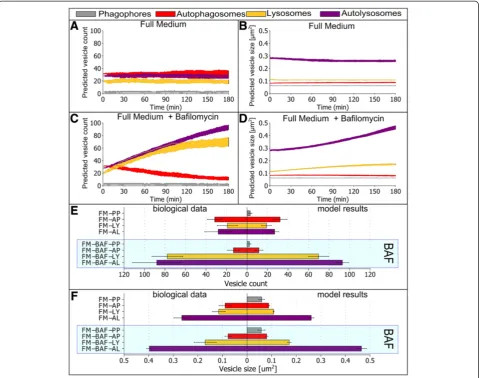
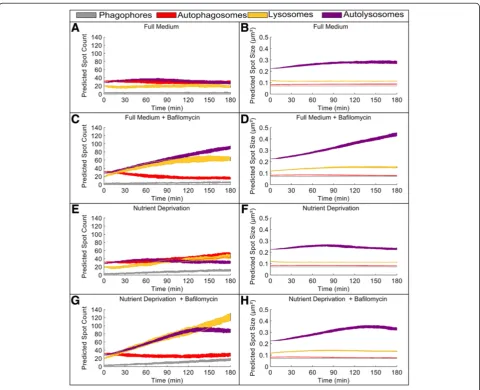
Figure 4Core model simulation of autophagic flux dynamics.The core model was simulated for 100 runs under indicated conditions for 3 hours. For each agent the plotted shaded area corresponds to the 25 and 75 quantile of data.ATime course of vesicle count under FM conditions.BTime course of the vesicle size under FM conditions.CTime course of vesicle count under FM conditions with the addition of BAF.
4% for FM conditions. The time courses from 100 runs for the first 180 min of the best parameter set are shown in Figure 7, and the mean results for the time point t = 180 min are shown in Figure 8, Of note, the high stand-ard deviation indicates a high degree of cell-to-cell vari-ability in our simulations. This is further demonstrated in histograms of the modeling results at t = 180 min for each of the four conditions (Additional files 3, 4, 5 and 6). An overview of the best-found parameter set is shown in Table 6.
High accuracy of dynamic simulations with the integrative autophagy-environmental model
As expected, under FM conditions the model pre-dicted a near steady-state vesicle count and vesicle size (Figure 7A-B). The addition of BAF under FM con-ditions increased the number of phagophores over time, due to reduce free nutrient availability (Figure 7C-D). After ~120 minutes the vesicle count of autophagosomes and lysosomes reached a steady state, while the number of autolysosomes continued to increase. This result is also observed in the change of vesicle sizes.
Under ND conditions (activated autophagy) the num-ber of phagophores, autophagosomes and lysosomes increased over time, while the number of autolysosomes reached a maximum at ~ t = 90 min and decreased thereafter, but at levels always higher than the starting value (simulated to t = 180 min) (Figure 7E-F). Under ND conditions, the addition of BAF resulted in increased phagophores and lysosomes over time (Figure 7G-H). The number of autophagosomes initially decreased, reaching a minimum at ~ t = 100 min, followed by a slight increase thereafter. The number of lysosomes and autolysosomes underwent a near linear increase in the first 120 min, but after 120 min the number of autolyso-somes decreased while the number of lysoautolyso-somes continue to increase. For each of the four conditions, a 3-hour simulation movie, with the corresponding time courses is included in the supplementary information (Additional files 7, 8, 9 and 10).
Figure 5Bafilomycin A1 decreases mTOR activity under FM and ND conditions.HeLa cells were submitted to FM and ND conditions, in the absence and presence of BAF (100 nM). Western blot analysis was performed with protein samples taken during time periods of 0-3 hours (FM) and 0-1 hours (ND). Antibodies against 4EBP1 and phosphorylated 4EBP (p-4EBP1) were used to detect mTOR activity. An antibody against GAPDH was used as loading control.
In comparison to the high-resolution imaging results, the integrative model showed accurate results for the vesicle count under all four conditions (Figure 8A). How-ever, vesicle sizes were partly inconsistent (Figure 8B). This was most pronounced for ND conditions, where vesicle sizes are inferior to experimentally determined values. This deviation of the model results for ND condi-tions indicates, that the growth rates of all four agents are increased under ND conditions in the cell and should therefore also be linked to the level of free nutrients.
Emergent spatial patterns of autophagic vesicles match high-resolution, single-cell images
A major advantage of ABM is the visualization of dynamic behavior, which can be directly compared to experimental results. We remarked that the graphical output of our model demonstrated an obvious peri-nuclear clustering of autophagosomes and lysosomes. Interestingly, this phenotype was observed in our cell imaging experiments (Figures 3 and 9). Cellular parti-tions in Figure 9 identify nuclear (N), perinuclear (M) and cell periphery (P) regions. The subcellular clustering of vesicles in the M regions was most pronounced under ND conditions (Figure 9), likely due to a combination of increased numbers of autophagosomes and lysosomes and reordering of lysosomes towards the nucleus.
Impact of minor alterations to vesicle positioning and nutrient levels on long-term behavior of autophagy In the above, simulated basal autophagy conditions main-tained a pseudo-steady-state and short-term perturbation
simulations were highly accurate. We subsequently sought to determine the effect of minor influences on vesicle transport by long-term emergent behavior. We simulated changes to dynein motor protein activities, which trans-ports vesicles along microtubules towards the nucleus [47,48]. Impaired vesicle transport contributes promin-ently to neurological diseases [49], and functionally arises from alterations in bi-directional transport control. There are many mutations reported which lead to an impaired vesicle transport, with a different level of severity ranging from little effects to near total abolishment [50].
We therefore determined the result of a range (+/- 3 and 6%) change in the probability of autophagosome movement towards to the nucleus, and simulated 14 days (Figure 10). With decreasing transport towards the nu-cleus, the size of autophagosomes and autolysosomes in-creased over time, and vesicle positioning at the nucleus decreased. The increased size of autophagosomes and autolysosomes indicates reduced autophagic flux, con-sistent with impaired dynein transport [51].
As a second approach, we investigated emergent behav-ior stemming from metabolic perturbations, which con-tributes to different diseases and impacts autophagy [23]. We simulated the effect of 2.5% and a 5% increase/de-crease in cellular nutrient uptake for 14 days (Additional file 11). With decreased nutrient uptake, the vesicle num-ber for all agents increased rapidly. The size of lysosomes and autolysosomes showed no change, while a minor de-crease in autophagosomes size and an inde-crease in phago-phore size was observed. These changes represent the change from FM towards ND conditions, which showed a similar pattern. With increased nutrient uptake vesicle numbers for all agents decreased, while the sizes of agents was altered heterogeneously; phagophore size was re-duced, autophagosome and autolysosome sizes increased, and lysosome size remained constant. We further simu-lated the effects of a 2.5% and 5% increase/decrease in cellular metabolism (Additional file 12), hence in the con-version rate from free nutrient to bound nutrient. Since a lower nutrient uptake rate and a higher nutrient conver-sion rate both have the same decreasing effect on overall free nutrient levels in the cell, these results show a similar pattern to the results obtained from a decreased nutrient uptake.
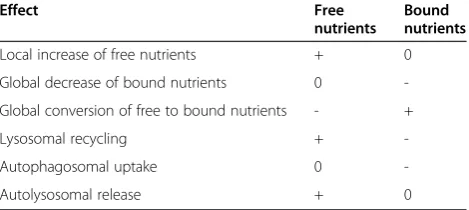
Table 3 Overview of the effect on nutrients in the integrative model
Effect Free
nutrients
Bound nutrients
Local increase of free nutrients + 0
Global decrease of bound nutrients 0
-Global conversion of free to bound nutrients - +
Lysosomal recycling +
-Autophagosomal uptake 0
-Autolysosomal release + 0
(+) indicates an increase, (-) indicates a decrease, (0) indicates no change.
Table 4 Results of the fitting process for the integrative model
Relative creation rate phagophores
Relative creation rate lysosomes
Relative degradation rate autolysosomes
Relative lysosomal positioning
Resulting difference free nutrients
FM 1 1 1 0% 0
FM + BAF 1.61 1.2 0.1 + 2.2% 4.4
ND 4.86 2.98 12.04 + 5.25% 10.5
ND + BAF 6.63 3.6 2.61 + 8.55% 17.1
Discussion
In this study, we established an ABM for the core processes of autophagy. Through parameter fitting of measured autophagy activities we were able to accurately simulate spatio-temporal dynamics of basal and activated autophagic flux. Moreover, during model optimization, the
inability to obtain good fits from experimental measure-ments indicated that the initial, core model design, focus-ing on pathway dynamics, required integration of the autophagic process with the cellular nutrient levels. To that end, we integrated a regulatory control of nutrient levels on autophagy pathway events with autophagy
Table 5 Comparison of the best-found parameter set for the integrative model with 200 randomly generated parameter sets
Condition Mean fitness of 200 randomly generated parameter sets
Best fitness of 200 random generated parameter sets
Fitness of the best parameter set
Average difference of the best parameter set to the biological data
FM 14136473 107185.2 81.3 3.68%
FM + BAF 1279520 138923.1 996.9 12.88%
ND 2301350 107662.4 494.8 9.08%
ND + BAF 717115.8 117476.8 3415.4 23.85%
Figure 7Optimized integrative model simulation of autophagic flux dynamics.The optimized integrative model was simulated for 3 hours, 100 times for each condition. For each agent the plotted shaded area corresponds to the 25 and 75 quantile of data.AVesicle count under FM conditions.BVesicle size under FM conditions.CVesicle count under FM conditions with BAF.DVesicle size under FM conditions with BAF.
recycling of cellular components. We present the applica-tion of our model for investigating autophagy in a short time scale, i.e. minutes to hours, and at extended time scales, i.e. days to weeks.
A major benefit to pathway modeling is the ability to predict dynamics which may be difficult or impossible to observe experimentally, but also to suggest novel experi-ments based on inaccurate model behaviors. Indeed, a direct result of initial model limitations was the predic-tion and experimental validapredic-tion that BAF-induced lyso-somal inhibition results in a rapid reduction of mTOR activity. This is in accordance with a recently proposed mechanism [37], and presumably due to reduced protein degradation and amino acid release [11,12]. This sup-pressive effect could account for insufficient numbers of autophagosomes and lysosomes, as mTOR acts as a negative regulator of lysosomal biogenesis [16,40,41] and autophagosome formation [39].
Furthermore, ABM offers the advantage of allowing direct comparison of simulated spatially-resolved dy-namics to experimental datasets. The rule set employed here resulted in a phenotype with autophagic vesicles concentrating in the peri-nuclear region. Upon further examination of our image dataset we recognized the remarkable similarity between simulated localization of autophagic vesicles and experimental observations.
The resulting ABM model not only realistically captured short-term dynamic behavior, but also provided a novel tool to predict long-term system evolution. As a proof-of-principle we altered the influences of vesicle movements and environment on autophagy. By decreas-ing the probability of autophagosome transport towards the nucleus, we predicted measurable impact on autoph-agy and vesicle distribution emerging over weeks. Further, increasing the nutrient source had the most obvious effect of altering vesicle sizes. These results emphasize the
importance of including spatial regulation and envir-onmental influences, and demonstrate the possibility to investigate dynamics otherwise could not be moni-tored at an equivalent spatial and/or temporal reso-lution experimentally.
Previously, Martin et al. used ODE modeling to per-form the first systems biology investigation of autopha-gosome dynamics [18]. The authors predicted dynamic deterministic and stochastic autophagy pathway behavior consistent with experimental measurements. In addition, Tavassoly et al. presented an ODE approach, where through modeling crosstalk between autophagy and apoptosis signaling pathways the authors were able to predict dynamic autophagy and cell death responses to metabolic and calcium stresses [19]. However, in both studies, these ODE approaches assumed a ‘mixed-bag’, homogenous distribution of pathway components, and were as such limited to integrating and reporting con-centration changes over time. Here we demonstrate that spatial-temporal modeling allows for full integration of rich, complex phenotypes from imaging datasets, as well as high-content, qualitative knowledge from literature. Furthermore, using ABMs, inherent phenotypic variability arises due to probabilities of interactions among heteroge-neously distributed agent populations, which corresponds more directly to the emergence of sub-cellular and cellular heterogeneities [52]. Points of crosstalk between apoptosis and autophagy underlie the cell fate decision [19,53]. To address such crosstalk future work will integrate rules for crosstalk between autophagy and apoptosis agents, includ-ing pro-apoptotic mitochondrial autophagy receptors [9]. Furthermore, higher accuracy will be achieved through the use of additional GFP-based biosensors for autophagy, including 2xFYVE [54], pH-sensitive tandem sensors for quantifying transitions between autophagosomes and autolysosomes [26,55], and single-cell, spatio-temporally correlated autophagy and apoptosis data-sets (e.g. [56]).
Conclusion
Here, we developed an ABM to compare and integrate spatio-temporal simulations of autophagy with experimental
Table 6 Overview of parameters used for the integrative model
Parameter name Value
Initial number of phagophores 3
Initial size of phagophores 0.07μm2
Creation rate of phagophores 0.44 min-1
Linear nutrient factor creation phagophores 0.206
Exponential nutrient factor creation phagophores
1.179
Mean maturation time of phagophores 7.5 min
Growth rate of phagophores 5e-04μm2min-1
Initial number of autophagosomes 31
Growth rate of autophagosomes 8e-05μm2min-1
Initial number of lysosomes 19
Initial size of lysosomes 0.1μm2
Creation rate of lysosomes 1.23 min-1
Linear nutrient factor creation lysosomes 0.112
Exponential nutrient factor creation lysosomes 1.124
Mean life time of lysosomes 18 min
Growth rate of lysosomes 0.0021μm2min-1
Initial number of autolysosomes 28
Initial size of autolysosomes 0.225μm2
Degradation rate autolysosomes 0.15 min-1
Linear nutrient factor degradation autolysosomes
0.0069
Exponential nutrient factor degradation autolysosomes
3.14
Growth rate of autolysosomes 0.00065μm2min-1
Chance of reformation autolysosome to lysosome
50%
Rate of movement 2μm min-1
Chance of autophagosomal movement towards nucleus
85%
Chance of lysosomal movement towards nucleus basis
55%
Chance of lysosomal movement towards nucleus via nutrient status
+0.5%
DifferenceNutrition-1
Chance of fusion of a non-autolysosome and an autolysosome
45%
Chance of fusion of two autolysosomes 30%
Mean free nutrients for initialization of the model
20
Mean bound nutrients for initialization of the model
20
Diffusion of free nutrients 70%
Diffusion of bound nutrients 50%
Local increase of free nutrients 1.1 min-1borderpatch-1
Global decrease of free nutrients 0.05 min-1patch-1
Global conversion of free nutrients to bound nutrients
0.045 min-1patch-1
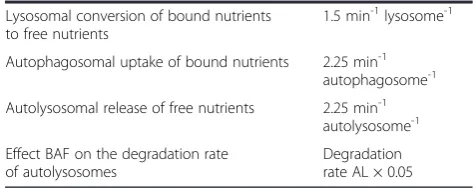
Table 6 Overview of parameters used for the integrative model(Continued)
Lysosomal conversion of bound nutrients to free nutrients
1.5 min-1lysosome-1
Autophagosomal uptake of bound nutrients 2.25 min-1 autophagosome-1
Autolysosomal release of free nutrients 2.25 min-1 autolysosome-1
Effect BAF on the degradation rate of autolysosomes
Degradation rate AL × 0.05
data, and to predict non-intuitive findings. The result-ing model captures with high accuracy short-term and long-term behaviors, and through the use of NetLogo, is available as a community resource, e.g. to further integrate and investigate regulation stemming from pathway crosstalk with apoptosis and specific forms of autophagy.
Materials and methods
Modeling
ABMs were developed using the open source toolkit NetLogo (v5.0) [29]. Statistical analyses and plotting was performed using the open source environment for statistical computing R [57] in combination with the R-package RNetLogo [58,59]. Fitting of the biological data was performed through minimization of a prede-fined fitness function in combination with a genetic algorithm provided by the R package GA [60], and a parallelized implementation of the model controlled via RNetLogo.
Fitness evaluation of parameter sets
To calculate the fitness of the model, the predicted vesicle count and vesicle size of autophagosomes, lyso-somes and autolysolyso-somes, were compared with the
corresponding biological data by using the following formula:
Fitness Model½ ¼
i∈Count; Size j∈APX;LY;AL
i;j
result model ið Þ;j result biological ið Þ;j
−1
100
2
An exact match between model predictions and bio-logical data would yield a fitness value of 0. Non-zero fitness values increase as a function of an increased difference between the model and the biological data. A 10% difference between the model and the biological data in one of the 6 different data points will result in a fitness value of 100.
We considered that a model predicting a 10% differ-ence in two data points is a better model than one which shows a 20% difference in one data point, therefore the squaring was included in this formula, so that the first situation would obtain a fitness value of 200, while the second would obtain a fitness value of 400. The model is aborted automatically if the cell runs out of nutrients or if the total number of agents is higher than 500. In this case an extra penalty of 100000 was added to its calcu-lated fitness value.
Chemicals and antibodies
BAF was obtained from Enzo Life Sciences. Cell culture reagents were purchased from Invitrogen, Sigma Lonza and Pan Biotech. PhosSTOP phosphatase inhibitor and complete EDTA-free protease inhibitor were purchased from Roche Applied Science. RIPA buffer was obtained from Millipore. Antibodies were against GAPDH (Santa Cruz, #sc-25778), 4E-BP1 (Cell Signaling, #9452) and Phospho-4E-BP1 (Thr37/46) (Cell Signaling, #9459). Horseradish peroxidase (HRP)-conjugated secondary antibodies obtained from Genetex.
Plasmids
GFP-RAB7 [33] and mCherry-LC3B [26] were previously described.
Cell culture
Human MCF7 (Cell Line Services, Heidelberg) and HeLa Kyoto [61] cancer cell lines were maintained in FM consisting of DMEM supplemented with 10% FBS, L-glutamine, non-essential amino acids, penicillin, streptomycin and amphotericin B. ND was introduced using glucose-containing Hank’s Balanced Salt Solution (HBSS; Invitrogen # 14025-050).
Western blotting
Protein samples were electrophoresed using Bis-Tris NuPage gels (Invitrogen) and transferred using the iBlot dry blotting system (Invitrogen). Membranes were blocked
and incubated at 4°C overnight with primary antibodies, followed by incubation with HRP-coupled secondary anti-bodies. Membranes were then developed using a chemilu-minescent substrate and a chemiluchemilu-minescent imager (Intas). Four independent experiments were performed from which one representative blot is shown.
Imaging
Cells were plated in microscopy μ-slides (iBidi). Wide-field fluorescence microscopy was performed with a
DeltaVision RT microscope system (Applied Precision) using a 60X oil immersion objective. Integrated stacks were captured using the OAI (optical axis integration) function. Images were deconvolved (Softworx).
Image analysis
The image analysis was performed with the image pro-cessing package Fiji [62]. After a rolling ball background subtraction a threshold was manually applied to the im-ages. Afterwards an overlay image of both channels was
created and vesicle count, vesicle size and vesicle type (only GFP, only mCherry, GFP and mCherry) were analyzed.
Additional files
Additional file 1:Core model of Autophagy.NetLogo File for the core model of Autophagy, load and use with NetLogo 5.0.5 or newer.
Additional file 2:Integrative model of Autophagy.NetLogo File for the integrative model of Autophagy, load and use with NetLogo 5.0.5 or newer.
Additional file 3:Cell-to-cell variability of the integrative model under FM conditions.Histogram for the count and size [μm2] of each of the four agents of 100 simulations after 180 minutes.
Additional file 4:Cell-to-cell-variability of the integrative model under FM conditions with BAF.Histogram for the count and size [μm2] of each of the four agents of 100 simulations after 180 minutes.
Additional file 5:Cell-to-cell-variability of the integrative model under ND conditions.Histogram for the count and size [μm2] of each of the four agents of 100 simulations after 180 minutes.
Additional file 6:Cell-to-cell-variability of the integrative model under ND conditions with BAF.Histogram for the count and size [μm2]
of each of the four agents of 100 simulations after 180 minutes.
Additional file 7:Time course movie of the integrative model under FM conditions.This movie shows the time-course of one model run for 180 minutes of the integrative model of autophagy under FM conditions. On the left, a part of the output of the NetLogo model is shown, on the right the corresponding data for the whole model is shown.
Additional file 8:Time course movie of the integrative model under FM conditions with BAF.This movie shows the time-course of one model run for 180 minutes of the integrative model of autophagy under FM conditions with BAF. On the left, a part of the output of the NetLogo model is shown, on the right the corresponding data for the whole model is shown.
Additional file 9:Time course movie of the integrative model under ND conditions.This movie shows the time-course of one model run for 180 minutes of the integrative model of autophagy under ND conditions. On the left, a part of the output of the NetLogo model is shown, on the right the corresponding data for the whole model is shown.
Additional file 10:Time course movie of the integrative model under ND conditions with BAF.This movie shows the time-course of one model run for 180 minutes of the integrative model of autophagy under ND conditions with BAF. On the left, a part of the output of the NetLogo model is shown, on the right the corresponding data for the whole model is shown.
Additional file 11:Impact of minor changes to nutrient uptake in long-term simulations of optimized integrative model.100 Simulations corresponding to 14 days (20160 min) were performed, using the indicated altered nutrient uptake. Steady-state vesicle dynamics at 20160 minutes are reported. A Mean vesicle count with standard deviation. B Mean vesicle size with standard deviation. A-B Numbers on the y-axis represent the change of nutrient increase in percent times 10, i.e. 1000 indicates for 100%, which is the standard value (indicated by the blue shaded box).
Additional file 12:Impact of minor changes to nutrient conversion in long-term simulations of optimized integrative model.100 Simulations corresponding to 14 days (20160 min) were performed, using the indicated altered nutrient conversion. Steady-state vesicle dynamics at 20160 minutes are reported. A Mean vesicle count with standard deviation. B Mean vesicle size with standard deviation. A-B Numbers on the y-axis represent the change of nutrient conversion in percent times 10, i.e. 1000 indicates 100%, which is the standard value (indicated by the blue shaded box).
Competing interests
The authors declare that they have no competing interests.
Authors’contributions
NRB designed the study. CSB performed image analysis and computational modeling. VL, AHB and NRB performed experiments. CSB, AHB and NRB wrote the manuscript. All authors read and approved the final manuscript.
Acknowledgments
This work was supported through SBCancer within the Helmholtz Alliance on Systems Biology funded by the Initiative and Networking Fund of the Helmholtz Association (NRB); and the e:Bio grant #0316191 (LysoSys) of the Federal Ministry of Education and Research (BMBF), Germany (AH-B). The funders had no role in study design, data collection and analysis, decision to publish, or preparation of the manuscript.
Author details
1
Systems Biology of Cell Death Mechanisms, German Cancer Research Center (DKFZ), Heidelberg, Germany.2Department of Surgery, Heidelberg University Hospital, Heidelberg, Germany.3Bioquant, Heidelberg University, INF 267, 69120 Heidelberg, Germany.4Lysosomal Systems Biology, German Cancer Research Center (DKFZ), Heidelberg, Germany.
Received: 3 July 2014 Accepted: 31 August 2014
References
1. Mathew R, Karp CM, Beaudoin B, Vuong N, Chen G, Chen HY, Bray K, Reddy A, Bhanot G, Gelinas C, Dipaola RS, Karantza-Wadsworth V, White E:Autophagy suppresses tumorigenesis through elimination of p62.Cell2009, 137:1062–1075.
2. Hamacher-Brady A:Autophagy regulation and integration with cell signaling.Antioxid Redox Signal2012,17:756–765.
3. Laplante M, Sabatini DM:mTOR signaling at a glance.J Cell Sci2009, 122:3589–3594.
4. Wouters BG, Koritzinsky M:Hypoxia signalling through mTOR and the unfolded protein response in cancer.Nat Rev Cancer2008,8:851–864. 5. Guertin DA, Sabatini DM:Defining the role of mTOR in cancer.Cancer Cell
2007,12:9–22.
6. Kristensen AR, Schandorff S, Hoyer-Hansen M, Nielsen MO, Jaattela M, Dengjel J, Andersen JS:Ordered organelle degradation during starvation-induced autophagy.Mol Cell Proteomics2008,7:2419–2428.
7. Novak I, Dikic I:Autophagy receptors in developmental clearance of mitochondria.Autophagy2011,7:301–303.
8. Narendra D, Kane LA, Hauser DN, Fearnley IM, Youle RJ:p62/SQSTM1 is required for Parkin-induced mitochondrial clustering but not mitophagy; VDAC1 is dispensable for both.Autophagy2010,6:1090–1106.
9. Zhu Y, Massen S, Terenzio M, Lang V, Chen-Lindner S, Eils R, Novak I, Dikic I, Hamacher-Brady A, Brady NR:Modulation of serines 17 and 24 in the LC3-interacting region of Bnip3 determines pro-survival mitophagy versus apoptosis.J Biol Chem2013,288:1099–1113.
10. Zoncu R, Bar-Peled L, Efeyan A, Wang S, Sancak Y, Sabatini DM:mTORC1 senses lysosomal amino acids through an inside-out mechanism that requires the vacuolar H(+)-ATPase.Science2011,334:678–683.
11. Han JM, Jeong SJ, Park MC, Kim G, Kwon NH, Kim HK, Ha SH, Ryu SH, Kim S: Leucyl-tRNA synthetase is an intracellular leucine sensor for the mTORC1-signaling pathway.Cell2012,149:410–424.
12. Bonfils G, Jaquenoud M, Bontron S, Ostrowicz C, Ungermann C, De Virgilio C:Leucyl-tRNA synthetase controls TORC1 via the EGO complex.Mol Cell 2012,46:105–110.
13. Jahreiss L, Menzies FM, Rubinsztein DC:The itinerary of autophagosomes: from peripheral formation to kiss-and-run fusion with lysosomes. Traffic (Copenhagen, Denmark)2008,9:574–587.
14. Korolchuk VI, Rubinsztein DC:Regulation of autophagy by lysosomal positioning.Autophagy2011,7:927–928.
15. Korolchuk VI, Saiki S, Lichtenberg M, Siddiqi FH, Roberts E, Imarisio S, Jahreiss L, Sarkar S, Futter M, Menzies FM, O'Kane CJ, Deretic V, Rubinsztein DC:Lysosomal positioning coordinates cellular nutrient responses. Nat Cell Biol2011,13:453–460.
18. Martin KR, Barua D, Kauffman AL, Westrate LM, Posner RG, Hlavacek WS, Mackeigan JP:Computational model for autophagic vesicle dynamics in single cells.Autophagy2013,9:74–92.
19. Tavassoly I, Shajahan AN, Parmar J, Baumann WT:Dynamical Modeling of the Interaction between Autophagy and Apoptosis in Mammalian Cells: A Systems Pharmacology Framework.arXiv:1312.7149 [q-bio.MN].
20. Macal CM, North MJ:Agent-based modeling and simulation.In Proceedings of the 2009 Winter Simulation Conference (WSC).2009:86–98. 21. Patel PK, Shirihai O, Huang KC:Optimal dynamics for quality control in
spatially distributed mitochondrial networks.PLoS Comput Biol2013, 9:e1003108.
22. Schleich K, Warnken U, Fricker N, Ozturk S, Richter P, Kammerer K, Schnolzer M, Krammer PH, Lavrik IN:Stoichiometry of the CD95 death-inducing signaling complex: experimental and modeling evidence for a death effector domain chain model.Mol Cell2012,47:306–319.
23. Mizushima N, Levine B, Cuervo AM, Klionsky DJ:Autophagy fights disease through cellular self-digestion.Nature2008,451:1069–1075.
24. Yan WJ, Dong HL, Xiong LZ:The protective roles of autophagy in ischemic preconditioning.Acta Pharmacol Sin2013,34:636–643. 25. Rubinsztein DC, Gestwicki JE, Murphy LO, Klionsky DJ:Potential therapeutic
applications of autophagy.Nat Rev Drug Discov2007,6:304–312. 26. Hundeshagen P, Hamacher-Brady A, Eils R, Brady NR:Concurrent detection
of autolysosome formation and lysosomal degradation by flow cytometry in a high-content screen for inducers of autophagy.BMC Biol 2011,9:38.
27. Rubinsztein DC, Codogno P, Levine B:Autophagy modulation as a potential therapeutic target for diverse diseases.Nat Rev Drug Discov 2012,11:709–730.
28. Amaravadi RK, Lippincott-Schwartz J, Yin XM, Weiss WA, Takebe N, Timmer W, DiPaola RS, Lotze MT, White E:Principles and current strategies for targeting autophagy for cancer treatment.Clin Cancer Res2011,17:654–666. 29. Wilensky U:Center for Connected Learning and Computer-Based Modeling.
Evanston, IL: Northwestern University; 1999. NetLogo. http://ccl.north western.edu/netlogo/.
30. Bandyopadhyay D, Cyphersmith A, Zapata J, Kim YJ, Payne CK:Lysosome transport as a function of lysosome diameter.PLoS One2014,9:e86847. 31. Bowman EJ, Siebers A, Altendorf K:Bafilomycins: a class of inhibitors of
membrane ATPases from microorganisms, animal cells, and plant cells. Proc Natl Acad Sci1988,85:7972–7976.
32. Klionsky DJ, Abdalla FC, Abeliovich H, Abraham RT, Acevedo-Arozena A, Adeli K, Agholme L, Agnello M, Agostinis P, Aguirre-Ghiso JA, Ahn HJ, Ait-Mohamed O, Ait-Si-Ali S, Akematsu T, Akira S, Al-Younes HM, Al-Zeer MA, Albert ML, Albin RL, Alegre-Abarrategui J, Aleo MF, Alirezaei M, Almasan A, Almonte-Becerril M, Amano A, Amaravadi R, Amarnath S, Amer AO, Andrieu-Abadie N, Anantharam V,et al:Guidelines for the use and interpretation of assays for monitoring autophagy.Autophagy2012,8:445–544.
33. Bucci C, Thomsen P, Nicoziani P, McCarthy J, van Deurs B:Rab7: a key to lysosome biogenesis.Mol Biol Cell2000,11:467–480.
34. Mizushima N:Autophagy: process and function.Genes Dev2007, 21:2861–2873.
35. Hamacher-Brady A, Brady NR, Gottlieb RA:Enhancing macroautophagy protects against ischemia/reperfusion injury in cardiac myocytes. J Biol Chem2006,281:29776–29787.
36. Klionsky DJ, Elazar Z, Seglen PO, Rubinsztein DC:Does bafilomycin A1 block the fusion of autophagosomes with lysosomes?Autophagy2008, 4:849–850.
37. Juhász G:Interpretation of bafilomycin, pH neutralizing or protease inhibitor treatments in autophagic flux experiments: novel considerations.Autophagy2012,8:1875–1876.
38. Li M, Khambu B, Zhang H, Kang J-H, Chen X, Chen D, Vollmer L, Liu P-Q, Vogt A, Yin X-M:Suppression of lysosome function induces autophagy via a feedback down-regulation of MTOR complex 1 (MTORC1) activity. J Biol Chem2013,288:35769–35780.
39. Ravikumar B, Vacher C, Berger Z, Davies JE, Luo S, Oroz LG, Scaravilli F, Easton DF, Duden R, O’Kane CJ, Rubinsztein DC:Inhibition of mTOR induces autophagy and reduces toxicity of polyglutamine expansions in fly and mouse models of Huntington disease.Nat Genet2004,36:585–595. 40. Sardiello M, Palmieri M, di Ronza A, Medina DL, Valenza M, Gennarino VA, Di
Malta C, Donaudy F, Embrione V, Polishchuk RS, Banfi S, Parenti G, Cattaneo E, Ballabio A:A gene network regulating lysosomal biogenesis and function.Science (New York, NY)2009,325:473–477.
41. Zhou J, Tan S-H, Nicolas V, Bauvy C, Yang N-D, Zhang J, Xue Y, Codogno P, Shen H-M:Activation of lysosomal function in the course of autophagy via mTORC1 suppression and autophagosome-lysosome fusion.Cell Res 2013,23:508–523.
42. Yu L, McPhee CK, Zheng L, Mardones G, Rong Y, Peng J, Mi N, Zhao Y, Liu Z, Wan F, Hailey DW, Oorschot V, Klumperman J, Baehrecke EH, Lenardo MJ: Termination of autophagy and reformation of lysosomes regulated by mTOR.Nature2010,465:942–946.
43. Rong Y, Mcphee C, Deng S, Chen L, Liu M, Tracy K, Baehreck EH, Mcphee CK, Huang L, Baehrecke EH, Yu L, Lenardo MJ, Vanover KE, Chen EY, Marshall JJ:Correction for Rong et al., Spinster is required for autophagic lysosome reformation and mTOR reactivation following starvation.Proc Natl Acad Sci2011,108:11297–11297.
44. Elia A, Constantinou C, Clemens MJ:Effects of protein phosphorylation on ubiquitination and stability of the translational inhibitor protein 4E-BP1. Oncogene2008,27:811–822.
45. Cuervo AM:Autophagy: in sickness and in health.Trends Cell Biol2004, 14:70–77.
46. Turk V, Turk B, Turk D:Lysosomal Cysteine Proteases: Facts and Opportunities.2001. 47. Vale RD:The molecular motor toolbox for intracellular transport.Cell
2003,112:467–480.
48. Pfister KK, Shah PR, Hummerich H, Russ A, Cotton J, Annuar AA, King SM, Fisher EM:Genetic analysis of the cytoplasmic dynein subunit families. PLoS Genet2006,2:e1.
49. Franker MA, Hoogenraad CC:Microtubule-based transport - basic mechanisms, traffic rules and role in neurological pathogenesis. J Cell Sci2013,126:2319–2329.
50. Pilling AD, Horiuchi D, Lively CM, Saxton WM:Kinesin-1 and Dynein are the primary motors for fast transport of mitochondria in Drosophila motor axons.Mol Biol Cell2006,17:2057–2068.
51. Ravikumar B, Acevedo-Arozena A, Imarisio S, Berger Z, Vacher C, O’Kane CJ, Brown SD, Rubinsztein DC:Dynein mutations impair autophagic clearance of aggregate-prone proteins.Nat Genet2005,37:771–776.
52. Snijder B, Pelkmans L:Origins of regulated cell-to-cell variability. Nat Rev Mol Cell Biol2011,12:119–125.
53. Gump JM, Staskiewicz L, Morgan MJ, Bamberg A, Riches DWH, Thorburn A: Autophagy variation within a cell population determines cell fate through selective degradation of Fap-1.Nat Cell Biol2014,16:47–54. 54. Stenmark H, Aasland R, Toh BH, DArrigo A:Endosomal localization of the
autoantigen EEA1 is mediated by a zinc-binding FYVE finger.J Biol Chem 1996,271:24048–24054.
55. Johansen T, Lamark T:Selective autophagy mediated by autophagic adapter proteins.Autophagy2011,7:279–296.
56. Xu Y, Yuan J, Lipinski MM:Live imaging and single-cell analysis reveal differential dynamics of autophagy and apoptosis.Autophagy2013, 9:1418–1430.
57. R Core Team: R:R: A Language and Environment for Statistical Computing.In Vienna, Austria: the R Foundation for Statistical Computing; 2014. http://www.R-project.org/.
58. Thiele JC, Kurth W, Grimm V:RNetLogo: an R package for running and exploring individual-based models implemented in NetLogo.Methods Ecol Evol2012,3:480–483.
59. Thiele JC:R marries NetLogo: introduction to the RNetLogo package. J Stat Software2014,58(2):1–41.
60. Scrucca L:GA: a package for genetic algorithms in R.J Stat Software2013, 53:1–37.
61. Neumann B, Held M, Liebel U, Erfle H, Rogers P, Pepperkok R, Ellenberg J: High-throughput RNAi screening by time-lapse imaging of live human cells.Nat Methods2006,3:385–390.
62. Schindelin J, Arganda-Carreras I, Frise E, Kaynig V, Longair M, Pietzsch T, Preibisch S, Rueden C, Saalfeld S, Schmid B, Tinevez JY, White DJ, Hartenstein V, Eliceiri K, Tomancak P, Cardona A:Fiji: an open-source platform for biological-image analysis.Nat Methods2012,9:676–682.
doi:10.1186/s12964-014-0056-8