1
Michael W. l. elsby
University of Edinburghbart hobijn
Federal Reserve Bank of San Franciscoays¸egül s¸ahi
.
n
Federal Reserve Bank of New YorkThe Decline of the U.S. Labor Share
ABSTRACT Over the past quarter century, labor’s share of income in the United States has trended downward, reaching its lowest level in the postwar period after the Great Recession. A detailed examination of the magnitude, determinants, and implications of this decline delivers five conclusions. First, about a third of the decline in the published labor share appears to be an artifact of statistical procedures used to impute the labor income of the self-employed that underlies the headline measure. Second, movements in labor’s share are not solely a feature of recent U.S. history: The relative stability of the aggregate labor share prior to the 1980s in fact veiled substantial, though offsetting, move-ments in labor shares within industries. By contrast, the recent decline has been dominated by the trade and manufacturing sectors. Third, U.S. data provide limited support for neoclassical explanations based on the substitution of capital for (unskilled) labor to exploit technical change embodied in new capital goods. Fourth, prima facie evidence for institutional explanations based on the decline in unionization is inconclusive. Finally, our analysis identifies offshoring of the labor-intensive component of the U.S. supply chain as a leading potential explanation of the decline in the U.S. labor share over the past 25 years.
e
ver since Kaldor (1957, 1961) documented his growth facts, thecon-stancy of the share of income that flows to labor has been taken to be one of the quintessential stylized facts of macroeconomics.1 After several
2 Brookings Papers on Economic Activity, Fall 2013
decades of modest variation, prominent measures of labor’s share in the United States have declined significantly. The headline measure pub-lished by the Bureau of Labor Statistics (BLS) historically fluctuated around a mean of close to 64 percent from the immediate postwar period to the mid-1980s. Thereafter, aside from a brief surge surrounding the tech bubble at the turn of the 21st century, this measure has displayed a downward trend, averaging around 58 percent in recent years, 6 percent-age points below the level that prevailed during the first four decades of the postwar period.
In this paper, we examine the magnitude, determinants, and implica-tions of the movements in the U.S. labor share over the past 25 years. Our paper follows in the footsteps of an extensive literature that has investigated fluctuations and trends in labor’s share dating back to the first half of the 20th century.2 We address three main themes. First, we identify the sources of income and the underlying industry-level trends that account for the decline of the U.S. labor share. Second, we consider possible explanations for the decline. Finally, we reflect on whether the recent decline warrants a major rethink of the way the labor share is used by macroeconomists.
Section I documents the measurement of the headline labor share published by the BLS and the role played in its decline by each of its constituent income sources. We show that most of the recent downward trend in the labor share has its origins in reductions in the compensation of payroll employees as a fraction of gross value added, what we shall refer to as the “payroll share.” However, the decline in the share of the remaining source of labor income, that of the self-employed, is shown to be overstated in the headline measure. This measure is constructed under the assumption that average wages among the self-employed are the same as those of payroll employees. We provide evidence suggesting that this assumption induced the headline measure to imply a negative capital share among the self-employed during the 1980s, thereby over-estimating labor’s share and casting doubt on subsequent trends in that series. Two alternative measures proposed in the early work of Kravis (1959) have less extreme implications for the returns to capital among the self-employed. Comparison of these two alternative measures with the headline series informs our conclusion that around a third of the decline in the headline measure is a symptom of the method used to impute self-employment income.
Michael elsby, bart hobijn, and ays¸egül s¸ahi.n 3
Once the issues surrounding measurement of the labor income of the self-employed are considered, almost all of the remaining decline in the labor share is accounted for by the decline in the payroll share. For this reason, and because the payroll share is comparatively straightforward to measure and can easily be disaggregated, we focus in the remainder of the paper on understanding the movements of the payroll share.
In section II we address the sectoral origins of the decline in the pay-roll share using disaggregated industry-level data. We find that, viewed from a sectoral perspective, movements in labor’s share are not a feature solely of recent U.S. history: The relative stability of the aggregate labor share prior to the 1980s in fact veiled substantial, though offsetting, move-ments in labor shares within industries. The shift from manufacturing to services over this period served to depress the aggregate payroll share, as labor shares in manufacturing exceeded those in services. This effect was undone, however, by substantial rises in payroll shares within industries, especially healthcare, prior to the 1980s.
By contrast, these coincidental offsetting effects have not been mirrored since the late 1980s, the period in which the recent decline in the aggregate payroll share has emerged. The recent decline has instead been dominated by within-industry declines in payroll shares, particularly in manufacturing and trade, as opposed to compositional shifts.
A small group of industries also accounts for the higher-frequency rise and fall in the labor share in the late 1990s and early 2000s. Consistent with the timing of the tech bubble that arose then and with the widespread use of stock options in employee compensation in the tech sector, we find that around half of the rise and fall in the aggregate payroll share between 1998 and 2003 is accounted for by the changes in payroll shares of a small set of industries that cover investment banking and the tech sectors, despite their small share in total value added.
Thus, the results in section II reveal that aggregate movements in the payroll share owe much to underlying movements in particular indus-tries. Understanding the evolution of the aggregate payroll share therefore requires an understanding of changes in payroll shares across sectors. This insight is confirmed by our analysis in section III.
4 Brookings Papers on Economic Activity, Fall 2013
dates back to Hicks (1932), highlights the role of capital-labor substitut-ability and capital deepening in the determination of income shares, and it has recently been revived by Karabarbounis and Neiman (2013). Two corollaries of this account are not supported by U.S. data, however. First, when the decline in the labor share accelerated in the 2000s it was not accompanied by an increase in the rate of capital deepening. Second, con-trary to the predictions of simple versions of the theory, growth in real wages and output per hour actually slowed down during the 2000s rather than accelerating. We find similar tensions in other, more elaborate neo-classical explanations, such as the role played by an increasing skill-share of the labor force in the presence of capital-skill complementarity.
In section IV, we go beyond an aggregate production function repre-sentation and investigate the sources of the within-industry changes in payroll shares by exploiting cross-industry data. Our analysis identifies a strong correlation between increases in import exposure and declines in labor share at the industry level. Strikingly, we find that this statistical relationship could account for 3.3 percentage points of the 3.9 percentage- point decline in the U.S. payroll share over the past quarter century. We also revisit the capital-labor substitutability hypothesis by examining whether the industries that saw the smallest increases in equipment prices were the ones that experienced the largest declines in payroll shares. Reiterating our aggregate analysis, we find little support in the cross-industry data for this explanation. Prima facie evidence for another potential explanation— the decline in the bargaining power of workers due to deunionization—is inconclusive: there is a statistically imprecise relation between cross-industry changes in unionization rates and sectoral declines in payroll shares that includes both potentially large (and small) effects within conventional con-fidence intervals.3
In section V we conclude by considering how these facts and explana-tions affect the way macroeconomists should think about the labor share.
Michael elsby, bart hobijn, and ays¸egül s¸ahi.n 5
We first show that, in spite of the recent movements in the labor share, the assumption of (approximate) constancy of the labor share is still useful in many applications. For example, estimates of total factor productivity (TFP) growth are almost unaffected by the recent variation in factor shares observed in the United States. Second, we argue that theories and applica-tions that use the labor share as an indicator of the state of the business cycle are affected by the decline. Such theories implicitly assume the labor share fluctuates around a constant mean; an assumption rendered invalid by the decline. Moreover, many components of the compensa-tion captured in the labor share, like self-employment income and stock options, are not part of firms’ marginal costs. This makes the labor share a highly imperfect measure of cyclical marginal cost pressures that drive inflation. Finally, we illustrate why one has to be careful to interpret the decline in the share as showing increased inequality between capital(ists) and workers. We show that the labor share in the United States has in fact been buoyed up increasingly by the rising income shares of very rich workers, such as CEOs. Thus, the decline in the labor share conceals, rather than exposes, most of the large increases in inequality that have emerged in recent decades.
Of course, our conclusions are based on the recent movements of the labor share relative to its history. If the recent steep decline continues, this would lead to a more drastic reconsideration of the use of the labor share in empirical macroeconomics than we advocate. With that in mind, we con-clude the paper by briefly discussing what forces might drive movements in labor’s share in the foreseeable future.
I. Measurement and the Impact of Self-Employment Income
A first priority of any analysis of the evolution of the labor share is to docu-ment its empirical behavior. We begin by reviewing the path of the most commonly cited headline measure of the labor share, namely the labor share for the U.S. nonfarm business sector, which is published as part of the BLS Labor Productivity and Costs release.46 Brookings Papers on Economic Activity, Fall 2013
In this section, we contrast the behavior of this published series with several alternative measures of the labor share. Our findings indicate that the headline measure has overstated the decline in the labor share because of the way self-employment income is imputed in the construction of the headline number.
I.A. Evolution of the Headline Labor Share Measure
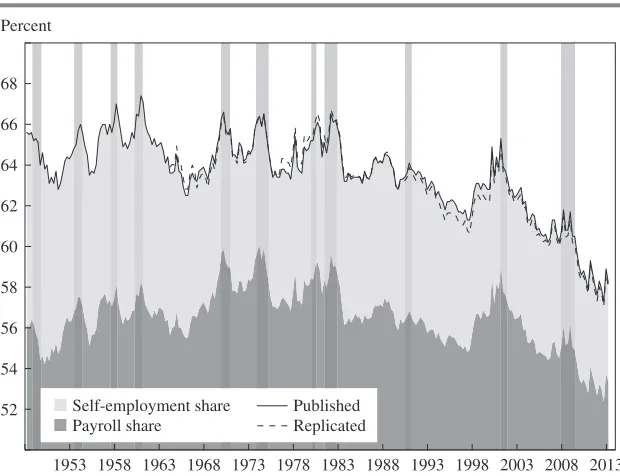
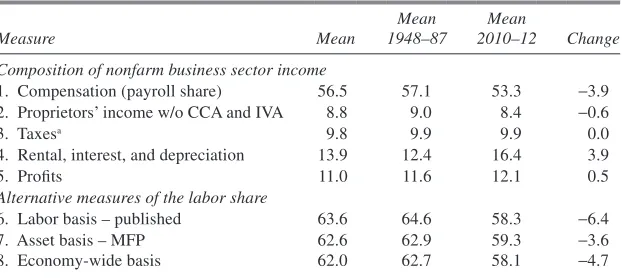
The evolution of the headline labor share measure during the postwar period is depicted by the black line in figure 1, and some related sum-mary statistics are provided in table 1. Four observations are apparent from these. First, the labor share exhibited no obvious trend during the first four decades of the postwar era. From 1948 through 1987 it hovered around a mean of 63.6 percent. Second, one can discern a trend decline in the labor share since the late 1980s. Third, the share spiked in the late 1990s
Percent
52 54 56 58 60 62 64 66 68
1953 1958 1963 1968 1973 1978 1983 1988 1993 1998 2003 2008 2013 Self-employment share
Payroll share
Published Replicated
Source: Bureau of Labor Statistics, Bureau of Economic Analysis, and authors’ calculations.
Michael elsby, bart hobijn, and ays¸egül s¸ahi.n 7
Table 1. sources and Magnitude of the Decline in the labor share
Measure Mean
Mean 1948–87
Mean
2010–12 Change Composition of nonfarm business sector income
1. Compensation (payroll share) 56.5 57.1 53.3 -3.9 2. Proprietors’ income w/o CCA and IVA 8.8 9.0 8.4 -0.6
3. Taxesa 9.8 9.9 9.9 0.0
4. Rental, interest, and depreciation 13.9 12.4 16.4 3.9
5. Profits 11.0 11.6 12.1 0.5
Alternative measures of the labor share
6. Labor basis – published 63.6 64.6 58.3 -6.4
7. Asset basis – MFP 62.6 62.9 59.3 -3.6
8. Economy-wide basis 62.0 62.7 58.1 -4.7
Source: Bureau of Economic Analysis, Bureau of Labor Statistics, and authors’ calculations. a. Sample covers 1948Q1 to 2013Q1.
and early 2000s. Finally, the trend decline that started in the late 1980s has accelerated over the last decade, with the labor share receding from its high in 2001 to a historic postwar low in the wake of the Great Recession. It averaged 58.3 percent over the period 2010 to 2012. The difference between the 1948–1987 and 2010–2012 period averages implies that the share of income that flows to workers has declined by 6.4 percentage points.
The methodology used to construct this headline measure is but one of a number of alternative approaches to measuring labor’s share, however. All these measures have one thing in common: They capture the ratio of a measure of aggregate labor compensation to an analogous measure of all factor income generated, which equals gross value added. Thus, the labor share, which we denote by l, is equal to the ratio of labor compensation to gross value added:
WL PY
(1) λ ≡ ,
8 Brookings Papers on Economic Activity, Fall 2013
labor compensation, WL, turns out to be particularly important for the decline in l.5
Labor compensation is the sum of payments to two groups of workers. The first group comprises workers who are on employers’ payrolls. Their compensation consists of their wages and salaries, as well as supplements to them in the form of employer contributions to pension and insurance funds and to social insurance. We denote the compensation of these payroll employees by WPLP. Measurement of WPLP is relatively straightforward,
being based primarily on employer payroll records from the Quarterly Cen-sus of Employment and Wages, which covers 98 percent of payroll jobs in the United States.6 For this reason, it is often referred to as the “unambigu-ous” part of labor compensation (Gomme and Rupert 2004). In what fol-lows, we will refer to the share of value added paid to these employees as the payroll share, and denote it by lP= WPLP/PY.7 The dark-shaded area in figure 1 reflects this payroll share.
The second group of workers consists of those who work for themselves rather than for an employer. The income of these self-employed indi-viduals8 reflects both returns to their work effort and returns to the busi-ness property they invested in. As Krueger (1999) points out, isolating the component of self-employment income that accrues to labor (as opposed to profits or other factors of production) is fundamentally ambiguous. Con-sequently, there is no direct measure of (hourly) labor compensation for the self-employed. Thus, analysts of labor’s share must adopt a position on how to measure this second component of labor compensation.9
5. As far as the denominator is concerned, the measurement of gross value added involves the choice of what are considered intermediate inputs and what are capital goods. A change in the classification of some of these expenditures, as in the 2013 benchmark revisions of the NIPA, results in a change in the level of gross value added. It also involves the choice of which sectors to include and which not, and whether the denominator is constructed using data from the expenditure or income sides of the national accounts (Grant 1963). For the postwar period the latter turns out to be immaterial, because the statistical discrepancy was relatively small during that period.
6. Estimates for the most recent quarter are based on the more timely survey data from the Current Employment Statistics program of the BLS.
7. It is also referred to as the “employee compensation share” (Gollin 2002). 8. Also known as proprietors’ income, or noncorporate business income.
Michael elsby, bart hobijn, and ays¸egül s¸ahi.n 9
We denote the imputed component of labor compensation paid to the self-employed by WSLS. The light-shaded area in figure 1 is the fraction of
value added that is attributed to self-employment income in the headline measure of the labor share. Self-employment income in this headline mea-sure is imputed under the assumption that average hourly compensation for the self-employed is the same as for those on payroll. That is, WS=WP for
all quarters in the postwar period. Under this assumption, the labor share can be constructed by rescaling the payroll share by one plus the ratio of the hours of the self-employed and payroll-employed,
L L
S P
P
( )
λ ≡ + λ
(2) 1 .
The underlying source data on hours worked necessary to replicate the BLS methodology are available dating back to 1964. The dashed line in figure 1 demonstrates that, using these data, we can closely replicate the published labor share under this assumption. The share of hours of the self-employed in total hours, LS/L, has declined steadily from about 14 percent
in 1948 to 8.5 percent in 2012. This is why figure 1 indicates a declining wedge between the labor and payroll shares during the postwar period. In spite of the relatively small share of self-employment hours, the treatment of self-employment income plays an important role in the recent behavior of the evolution of the labor share plotted in figure 1.
I.B. The Role of the Treatment of Self-Employment Income
The assumption of equal hourly compensation for payroll employees and the self-employed that is used to construct the headline labor share measure is only one way to impute the labor income of the self-employed. In this subsection we examine the behavior of a set of alternative measures of the labor share based on different assumptions on the measurement of WSLS. This approach was pioneered by Kravis (1959, table 1).
10 Brookings Papers on Economic Activity, Fall 2013
The basic problem that each of these alternative measures addresses is that the different sources of factor income reported in the national accounts do not map directly onto parts attributable to capital and labor. Figure 2 and table 1 summarize the distribution of all factor income generated by the non-farm business sector across five broad categories. The first is payroll compensa- tion and unambiguously reflects payments to labor. The second category is proprietors’ income, which as discussed above reflects a mixture of the labor and capital income of the self-employed. The remaining three catego-ries are better classified as either direct or implicit payments to capital.10
Percent
Quarterly observations
1953 1958 1963 1968 1973 1978 1983 1988 1993 1998 2003 2008
Source: Bureau of Economic Analysis and authors’ calculations. Note: Share of gross value added of NFB sector.
40 50 60 70 80 90
Labor share, published Profits
Taxes Rental, interest, and depreciationProprietors’ income w/o CCA and IVA Compensation
Figure 2. composition of nonfarm business sector income, 1948–2013
Michael elsby, bart hobijn, and ays¸egül s¸ahi.n 11
Measures of the labor share thus have to take a stance on the part of pro-prietors’ income that reflects payments to labor. Kravis (1959) introduced four different assumptions that can be used to cut the Gordian knot of esti-mating the labor income of the self-employed, and we provide an update of his results. The first assumption corresponds to that underlying the headline measure—that is, equal wages for self-employed and payroll-employed. This is what Kravis calls the “labor basis” measure of self-employment income. For reference it is plotted as the “labor share” in figure 2.
Kravis’ second measure attributes all of proprietors’ income (exclusive of capital consumption allowances [CCA] and inventory valuation adjust-ments [IVA]) to the labor input of the self-employed. We call this the “all-to-labor basis” measure. The labor share that one obtains using this measure is represented by the two lightest shaded areas in figure 2. While this clearly is an overstatement of the labor compensation of the self-employed—it assumes after all that none of proprietors’ income flows to capital—it is nonetheless instructive.
A comparison of this “all-to-labor basis” share with the published labor share is particularly revealing. Figure 2 shows that the share of proprietors’ income included in the labor share implicitly increased from around 80 percent in 1948 to 100 percent in 1981. From 1981 through 1991, the level of imputed self-employment income in the headline labor share measure even exceeded the level of proprietors’ income, a point to which we shall return shortly. Crucially for recent trends in the published share, between 1987 and 2012 the share of proprietors’ income attributed to labor implicit in the headline measure has decreased from 121 percent to a postwar low of 55 percent. Consequently, as can be seen by combin-ing the first two rows of table 1, at 4.5 percentage points the decline in the “all-to-labor basis” is substantially smaller than the 6.4-percentage-point decline in the headline measure. Moreover, rows 1 through 5 of the table reveal that only a small part of the decline in the “all-to-labor basis” share is due to an increase in the share of corporate profits. Instead, the bulk of the decline can be traced back to an increase in the share of capital services as reflected in rental and interest income, as well as capital depreciation.
12 Brookings Papers on Economic Activity, Fall 2013
headline number significantly overstated the actual labor share during the 1980s, which calls into question subsequent trends in that series. To get a sense of this, it is useful to compare the headline number with the remain-ing two measures proposed by Kravis (1959).
The first of these is based on the assumption that the returns to capital, as captured by its user cost, are the same for the capital used by the payroll-employed and that used by the self-payroll-employed. Kravis refers to this as the “asset basis” measure of self-employment income. Conceptually, this approach is very similar to the way self-employment labor income is inferred in the BLS Multifactor Productivity (MFP) data, and so we present that estimate here.11 This measure has, for example, been used by Fernald (2012) to construct his real-time growth accounting data set.
The second of the remaining Kravis measures instead assumes that the labor share in entrepreneurial income is the same as that for the overall economy, what Kravis names the “economy-wide basis” measure. Gomme and Rupert (2004) favor this measure, for example.
Figure 3 compares these two alternative measures with the published headline measure, and table 1 includes some related summary statistics. Three observations stand out. First, from 1948 through 1987 the published measure is, on average, more than 1.5 percentage points higher than the two alternative measures. Second, aside from a period during the 1980s, the two alternative measures lie very close to each other. Third, since the mid-1990s all three measures have converged. Rows 6 through 8 of table 1 summarize the impact of these three observations on the measured declines of the labor share. The decline in each of the alternative labor share mea-sures is at least 1.7 percentage points smaller than the 6.4 percent decline in the headline measure.
The upshot of these comparisons is that around one third of the decline in the headline measure of labor’s share appears to be a by-product of the methods employed by the BLS to impute the labor income of the self-employed. Alternative measures that have less extreme implications regarding the return to capital among proprietors are more consistent with one another and indicate a more modest decline.
I.C. Reevaluating the Headline Measure
Since the published share is constructed under the assumption of identi-cal payroll and self-employment wages, and taking the alternative series in
Michael elsby, bart hobijn, and ays¸egül s¸ahi.n 13
figure 3 at face value, the recent convergence of these measures suggests a sharp rise in the average hourly compensation of proprietors relative to the payroll-employed since the late 1980s. Such large trend shifts in the relative wages of the self-employed therefore potentially play a crucial role in the decline of the headline labor share measure. A key question, then, is what might explain these trend shifts.
The most compelling evidence emerges from comparisons of the evolu-tion of the income distribuevolu-tions within, respectively, the payroll-employed and the self-employed. Following Piketty and Saez (2003), we disaggre-gate the structure of the labor share associated with wages and salaries, and proprietors’ income, by fractile of the population.12 This analysis can be implemented through 2010 thanks to updated data from the World Top
Percent
1953 1958 1963 1968 1973 1978 1983 1988 1993 1998 2003 2008 2013
Source: Bureau of Labor Statistics, Bureau of Economic Analysis, and authors’ calculations. 58
60 62 64 66
Published - Labor basis Economy-wide basis MFP - Asset basis
Figure 3. alternative Measures of labor share based on three estimates of self-employment labor income, 1948–2013
14 Brookings Papers on Economic Activity, Fall 2013
Incomes Database, created by Facundo Alvaredo and others, which in turn are drawn from Internal Revenue Service tax returns statistics.13
The results of this exercise are illustrated in figure 4. The aggregate series depicted by the uppermost bold black line corresponds to the sum of the compensation and proprietors’ income areas in figure 2, the “all-to-labor basis” measure of the “all-to-labor share. The lower dashed black line corresponds to payroll compensation as a fraction of value added, in the previous notation. The shaded regions that these two aggregates comprise depict the portion of the labor share from each source that is accounted for by each fractile of employees and proprietors, respectively.
13. The database, authored by Facundo Alvaredo, Anthony B. Atkinson, Thomas Piketty, and Emmanuel Saez and published online in 2013 as The World Top Incomes Data-base, may be found at http://topincomes.g-mond.parisschoolofeconomics.eu (last accessed 07/29/2013).
Percent
1953 1958 1963 1968 1973 1978 1983 1988 1993 1998 2003 2008
Source: Bureau of Labor Statistics, Bureau of Economic Analysis; IRS; authors’ calculations; and Alvaredo, The World Top Incomes Database (http://topincomes.g-mond.parisschoolofeconomics.eu).
Note: Labor share here includes all proprietors’ income without IVA and CCA (“All-to-labor basis”). Top 0.1–0.01% Top 0.5–0.1%
Top 1–0.5% Top 5–1% Top 10–5% Lower 90% All-to-labor basis Payroll share 30
35 40 45 50 55 60 65
Michael elsby, bart hobijn, and ays¸egül s¸ahi.n 15
Figure 4 demonstrates that the share of income accounted for by both payroll wages and salaries and by proprietors’ income has been buoyed up since the 1980s by substantial rises in the shares accounted for by the very top fractiles of households in the United States. Indeed, the majority of the stability of the aggregate series has been sustained by rises in the income shares of just the top 1 percent of taxpayers.
This rise in inequality is even more striking for proprietors’ income than it is for payroll income. In 1948 the bottom 90 percent of employees earned 75 percent of payroll compensation. By 2010 this had declined to 54 percent. For entrepreneurial income, however, this fraction declined from 42 percent in 1948 to 14 percent in 2010. Even more starkly, over the same period the share of proprietors’ income accounted for by the bot-tom 99 percent fell from 74 percent to 45 percent. This suggests that the sharp rise in the average hourly compensation of proprietors relative to the payroll-employed since the late 1980s is related to substantial increases in income inequality among proprietors that dominate even the considerable rise in inequality witnessed among the payroll-employed. Moreover, this has been driven by extreme rises in proprietors’ income at the very top of the income distribution—the top 1 percent in particular.14
I.D. Summary
In this section, we have provided evidence to suggest that part of the trend decline observed in the published headline measure of the labor share in the United States is spurious. We have highlighted the impor-tant role played by the methods used to impute the labor income of the self-employed, in particular the assumption of equal hourly compensation between employees and the self-employed. The two most commonly used alternative measures of the labor share—the “economy-wide basis” and “asset basis” measures—exhibit more modest trend declines, and provide similar depictions of movements in labor’s share. Moreover, rises in com-pensation at the very top of the distribution of proprietors have been even
16 Brookings Papers on Economic Activity, Fall 2013
more extreme than among employees, suggesting that the average hourly compensation of the self-employed has soared in recent decades relative to the payroll-employed, violating a key assumption underlying the headline measure.15
It is important to note, however, that the measures of the labor share that we consider also have much in common. In terms of long-run movements, table 1 shows that all measures indicate a substantial decline in labor’s share since the late 1980s. In terms of short-term fluctuations, figures 1 and 3 reveal that all measures are countercyclical, with the share rising during recessions and falling during expansions.16
A convenient aspect of the common movements in the U.S. labor share measures is that they are mirrored by similar fluctuations in the payroll share (see figure 1 and row 1 of table 1). Consequently, an understanding of movements in the U.S. labor share can be gleaned by accounting for the drivers of the payroll share, which is comparatively straightforward to measure, and can also be disaggregated, for example by industry. This is the task of the next section.
II. The Composition of Economic Activity
The previous section examined the empirical behavior of the labor share from an aggregate perspective. It established that the bulk of the recent decline in the labor share can be traced back to a decline in the aggregate payroll share. That broad description, however, veils the underlying dis-aggregate origins of movements in the dis-aggregate payroll share. In this sec-tion we take a more microeconomic perspective by exploiting data on the sectoral composition of labor compensation and production. This allows us to shed light on (i) the degree of heterogeneity in the levels of, and changes in, payroll shares across sectors; (ii) systematic movements in the sectoral
15. In light of this, we suggest that the BLS adjust its headline labor share estimate to align more closely with either of the two alternative measures considered above. A quarterly estimate of the MFP share would be preferable to be consistent with the MFP data cur-rently published by the BLS. This would imply a different path of average compensation per hour—it would grow faster after the 1980s. One could continue to produce the current compensation per hour measure and rename it “payroll compensation per hour.” In addition, the BLS could publish payroll hours as well as the payroll share in addition to the labor share. All these data already are part of current calculations but are simply not included in the official release.
Michael elsby, bart hobijn, and ays¸egül s¸ahi.n 17
composition of the U.S. economy; and (iii) the way the interaction of (i) and (ii) affects movements in the aggregate payroll share.
II.A. Decomposing the Decline in the Payroll Share
Our starting point is the simple observation that the aggregate payroll share, lPin the above notation, is the value-added weighted sum of the
payroll shares of each of the industries in the economy:
W L PY
P i
P i P i
i i P i
∑
∑
λ ≡ = ω λ
(3) ,
where wi≡ PiYi/PY is the value-added share of sector i, and lPi≡ WPiLPi/PiYi
is its payroll share. It is possible to measure each of the components of equation 3 using the industry accounts from the Bureau of Economic Analysis. Data by detailed industry are available at an annual frequency from 1948 to 1987 under the SIC72 industry classification, and from 1987 onward based on the NAICS02 coding.17
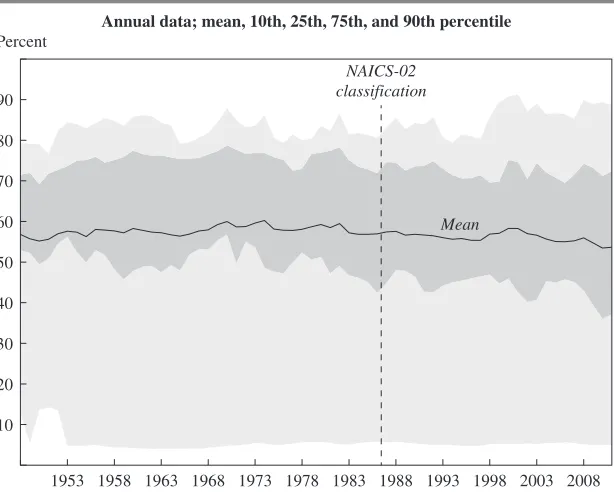
Figure 5 depicts the evolution of the cross-industry distribution of pay-roll shares over the postwar period. Consistent with equation 3, the dis-tribution is weighted by value added so that its mean replicates the path of the aggregate payroll share illustrated in figure 1. A key impression of figure 5 is that the magnitude of the variation in the aggregate payroll share (the mean) is dwarfed by the variation in these shares across industries. For example, in the most recent data, industries at the 25th percentile of total value added have a payroll share of around 30 percent while the cor-responding number for the 75th percentile is around 70 percent.
In light of this cross-industry variation, it is remarkable that the aggre-gate share has remained as stable as it has, given the large shift in the composition of U.S. economic activity—for example, from manufacturing
18 Brookings Papers on Economic Activity, Fall 2013
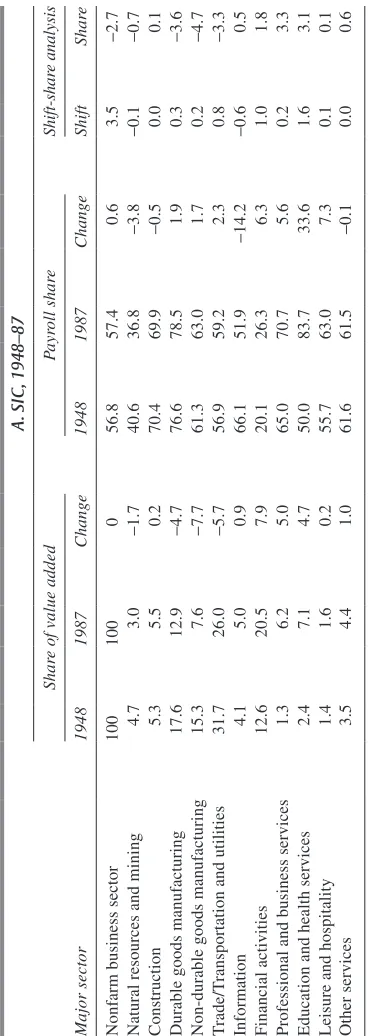
to services— over the postwar period. This observation echoes Keynes’ sentiment that the “remarkable constancy” of the aggregate labor share is “a bit of a miracle” (1939, p. 49). This miraculous constancy of the payroll share is the outcome of movements across industries offsetting one another in subtle ways. To demonstrate this, table 2 implements a “shift-share” analysis of the change in the aggregate payroll share. Using equation (3), one can decompose changes in the aggregate share into two components:
P
i iP
i i i iP
∑
∑
∆λ = ω ∆λ + ∆ω λ
(4) .
Shift Share
The “shift” component summarizes the contributions of changes in within-sector payroll shares DlP
i to the change in the aggregate payroll share. The
“share” component reports the contributions of changes in sectoral com-position Dwi. Due to a change in industry coding in 1987, we perform the
analysis separately for the periods before and after this break. For the sake of brevity, we present the results obtained at the major sector level using Figure 5. cross-industry Distribution of Payroll share, 1948–2011
Percent
1953 1958 1963 1968 1973 1978 1983 1988 1993 1998 2003 2008
Source: Bureau of Labor Statistics, Bureau of Economic Analysis, and authors’ calculations. 10
20 30 40 50 60 70 80 90
NAICS-02 classification
Table 2. sh ift-share a nalysis of
changes in P
ayroll
share by Major
sector
, 1948–2011
Percent
A. SIC, 1948–87
Major sector
Shar
e of value added
Payr oll shar e Shift-shar e analysis 1948 1987 Chang e 1948 1987 Chang e Shift Shar e
Nonfarm business sector
100 100 0 56.8 57.4 0.6 3.5 -2.7
Natural resources and mining
4.7 3.0 -1.7 40.6 36.8 -3.8 -0.1 -0.7 Construction 5.3 5.5 0.2 70.4 69.9 -0.5 0.0 0.1
Durable goods manufacturing
17.6 12.9 -4.7 76.6 78.5 1.9 0.3 -3.6
Non-durable goods manufacturing
15.3 7.6 -7.7 61.3 63.0 1.7 0.2 -4.7 T rade/T
ransportation and utilities
31.7 26.0 -5.7 56.9 59.2 2.3 0.8 -3.3 Information 4.1 5.0 0.9 66.1 51.9 -14.2 -0.6 0.5 Financial activities 12.6 20.5 7.9 20.1 26.3 6.3 1.0 1.8
Professional and business services
1.3 6.2 5.0 65.0 70.7 5.6 0.2 3.3
Education and health services
2.4 7.1 4.7 50.0 83.7 33.6 1.6 3.1
Leisure and hospitality
B. NAICS, 1987–2011
Major sector
Shar
e of value added
Payr oll shar e Shift-shar e analysis 1987 2011 Chang e 1987 2011 Chang e Shift Shar e
Nonfarm business sector
100 100 0 57.4 53.7 -3.8 -3.6 -0.1
Natural resources and mining
2.2 2.5 0.3 42.4 32.2 -10.1 -0.2 0.1 Construction 5.2 4.1 -1.1 72.6 72.4 -0.2 0.0 -0.8
Durable goods manufacturing
12.3 7.0 -5.2 78.7 68.4 -10.3 -1.0 -3.8
Non-durable goods manufacturing
8.2 6.3 -1.9 62.3 40.4 -21.8 -1.6 -1.0 T rade/T
ransportation and utilities
22.6 19.3 -3.4 58.2 53.8 -4.4 -0.9 -1.9 Information 4.9 5.0 0.1 47.8 42.5 -5.3 -0.3 0.0 Financial activities 21.2 23.6 2.5 24.8 24.9 0.1 0.0 0.6
Professional and business services
9.6 14.6 5.0 70.9 72.5 1.6 0.2 3.6
Education and health services
6.9 10.1 3.2 85.0 86.3 1.2 0.1 2.7
Leisure and hospitality
3.8 4.6 0.8 65.7 62.1 -3.6 -0.1 0.5 Other services 3.0 2.9 -0.2 64.9 70.0 5.2 0.2 -0.1
Source: Bureau of Economic
Analysis, Bureau of Labor Statistics, and authors’
calculations. Table 2. sh ift-share a nalysis of
changes in P
ayroll
share by Major
Michael elsby, bart hobijn, and ays¸egül s¸ahi.n 21
the unweighted averages of w and l as the expansion point for the decom-position, though neither choice affects the results materially.
The first three columns of table 2 confirm the familiar observation that the composition of U.S. economic activity has shifted away from manu-facturing toward services. The combined value added share of manufac-turing (both durable and nondurable) and trade, transportation and utilities declined by a total of 18.1 and 10.5 percentage points, respectively, between 1948 and 1987 and between 1987 and 2011. This loss is almost exactly mirrored by the gains in three service sectors: financial activities; professional and business services; and education and health services. The impact of the changing composition of economic activity on the payroll share is summarized in the share-part of the shift-share analysis.
In table 2, panel A reports results for the earlier period, 1948 to 1987. During that period, payroll shares in the services sector tended to be smaller than in manufacturing. Therefore, everything else equal, the shift in activity from manufacturing to services would have resulted in a 2.7-percentage-point decline in the labor share over that period, the “share” component of panel A. This decline did not manifest itself, however—the payroll share in fact increased by 0.9 percentage points between 1948 and 1987. The reason is that the effect of the change in the composition of economic activity was offset by an increase in within-sector payroll shares, particularly in the ser-vice sectors, the “shift” part of panel A. Absent coincidental movements in sectoral composition, the aggregate payroll share would have risen by 3.5 percentage points between 1948 and 1987. It is these coincidental movements that resulted in the “miraculous” relative constancy of the labor share in the first four decades of the postwar period.
Such coincidental movements did not take place between 1987 and 2011. This can be seen from panel B of table 2. This demonstrates that, between 1987 and 2011, the transition from manufacturing to services has had little impact in aggregate.18 The reason is that payroll shares by major sector have converged in recent decades, so that compositional shifts have been broadly offsetting.19 What has driven the decline in the aggregate payroll share has been the decline in the fraction of income paid to workers in manufacturing, trade, transportation, and utilities. These are the sectors
18. A point also made by Karabarbounis and Neiman (2013). Estrada and Valdeolivas (2012) show that the same is true for France, Germany, Italy, Japan, Spain, and the United Kingdom.
22 Brookings Papers on Economic Activity, Fall 2013
with a large negative contribution to the “shift” part of the shift-share analysis.
The results in table 2 provide an important insight, namely that the recent trend decline in the aggregate payroll share is due mostly to declines in payroll shares within particular industries. Thus, understanding the sources of the decline in the aggregate payroll share requires understanding the declines in the payroll shares of individual industries.
II.B. Cyclical Fluctuations in the Payroll Share
Although our primary focus is on trend movements in the labor share, our analysis of disaggregated industry data also uncovers striking regulari-ties in the movements of the payroll share at higher frequencies.
One regularity that stands out is that the cyclical movements in the aggregate payroll share apparent in figure 1 are accounted for entirely by cyclical fluctuations within industries; changes in industry composition are immaterial for these high-frequency fluctuations. To establish this, table 3 uses equation (4) to motivate a decomposition of the variance of changes in the aggregate payroll share (as opposed to the decomposition of long differences in table 2). Since the variance is dominated by high-frequency variation, this provides a sense of the sectoral origins of the cyclical varia-tion in the payroll share. Table 3 reveals that, for both subsamples, the “shift” part of the variance decomposition contributes essentially all of the Table 3. Variance Decomposition of annual changes in the aggregate Payroll share, 1948–2011
Major sector
SIC 1949–87 NAICS 1987–2011 Total Shift Share Total Shift Share Nonfarm business sector 100 102 -2 100 109 -9
Natural resources and mining 4 -1 5 1 -1 2
Construction 10 5 5 13 7 6
Durable goods manufacturing 33 36 -3 16 19 -3 Non-durable goods manufacturing 9 11 -2 3 8 -5 Trade/Transportation and utilities 24 28 -5 15 20 -5
Information 5 5 0 10 17 -7
Financial activities 3 10 -7 11 15 -4
Professional and business services 5 3 2 29 13 17
Education and health services 3 2 2 -5 3 -8
Leisure and hospitality 1 1 0 4 5 -1
Other services 2 2 1 2 3 0
Michael elsby, bart hobijn, and ays¸egül s¸ahi.n 23
variance. Additionally, for all sectors except mining (which includes oil and gas extraction), the contribution of the shift component is positive. This indicates that for all these sectors, changes in individual payroll share move in the same direction as in the aggregate.
As noted in the previous section, a conspicuous aberration from the recent trend decline in lP is the large rise and fall observed at the turn of
the 21st century. Given its timing, one might naturally conjecture that this episode was caused by the tech bubble that emerged at the time. In par-ticular, analyses by Mehran and Tracy (2001) and Himmelberg and others (2004) suggest that the extensive use of stock options in the compensa-tion of employees in the tech and investment banking industries substan-tially affected compensation and profits measures in the national accounts between 1998 and 2003. As Moylan (2008) explains, stock options gener-ally are counted as part of compensation only when employees exercise them.20 Many tech and investment banking employees decided to exercise their options at the height of the tech bubble, propping up the payroll shares in tech and investment banking.21
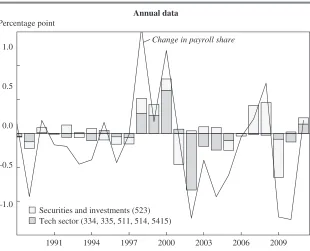
To discern the effect of these stock options, we calculate the contribu-tions to the aggregate payroll share accounted for by the changes in pay-roll shares of a small set of industries that cover the investment banking and tech sectors.22 Together, these industries account for about 7 percent of nonfarm business value added. The results of this analysis are remark-able. Figure 6 plots the annual percentage-point change in the aggregate payroll share from 1988 onwards, together with the contribution of invest-ment banking and tech. Despite these two sectors’ small share in total value added, their contributions are substantial. Roughly half of the rise and sub-sequent fall in the aggregate payroll share between 1998 and 2003 can be attributed to changes in the payroll shares in these sectors alone. A similar story holds for the period surrounding the Great Recession, though with a
20. Unfortunately, separate data on compensation in the form of stock options are not available in the NIPA, because the source data from the IRS do not distinguish that part of compensation from regular wages and salaries.
21. For example, the payroll share in computer and electronic products (334) increased from 75 percent in 1996 to 112 percent in 2000, and the payroll share in information and data processing services (514) peaked at 181 percent in 2000.
24 Brookings Papers on Economic Activity, Fall 2013
greater role played by investment banking than by the tech sectors, as one would expect.
Thus, mirroring the origins of the trend decline in the payroll share, movements in the share in individual industries also drive a large part of the cyclical movements in the aggregate. The striking lesson of figure 6 is that even very tightly defined sectors can experience such large swings in payroll shares that they leave a clear imprint on the evolution of these shares in the aggregate.
III. The Structure of Aggregate Technology
So far, we have limited ourselves to a quantitative description of what accounts for the movements of the U.S. labor share in the nonfarm business sector. In this section and the next we consider possible explanations for declines in the labor share. Our focus in this section is on models of aggre-gate technology that potentially give rise to such movements.
Percentage point
Annual data
Source: Bureau of Labor Statistics, Bureau of Economic Analysis, and authors’ calculations. Note: Values are shift-contributions to percentage-point changes in payroll share. –1.0
–0.5 0.0 0.5 1.0
1991 1994 1997 2000 2003 2006 2009
Securities and investments (523) Tech sector (334, 335, 511, 514, 5415)
Change in payroll share
Michael elsby, bart hobijn, and ays¸egül s¸ahi.n 25
To fix ideas, we begin by investigating the simplest possible model in which movements in the labor share can be understood. Our point of depar-ture, then, is the neoclassical theory of distribution for an economy com-prising firms that operate in competitive product and factor markets and are endowed with a given technology. The historical stability of labor’s share has informed the widespread assumption in much of macroeconomics that a Cobb-Douglas technology applies. Thus, the focus of this section will be to assess the promise of alternative structures of technology in their ability to account for recent movements in labor’s share.
Before we delve further into the analysis, it is worthwhile to note the economic significance of such a neoclassical explanation, namely that it suggests that movements in factor shares are potentially informative on the structure of production and the nature of technical progress in the economy, two fundamental ingredients of macroeconomics.
III.A. The Role of Capital-Labor Substitutability
We start by investigating simple aggregative models. Imagine an economy endowed with a constant-returns-to-scale aggregate production function Y= F (AKK, ALL). Here, K is capital, L is labor (hours worked), and
techni-cal progress may be either capital-augmenting (AK) or labor-augmenting
(AL). Note that this nests both Harrod-neutral (purely labor-augmenting,
AK≡ 1) and Hicks-neutral (equally capital- and labor-augmenting, AK≡ AL)
technical change as special cases. These assumptions on the structure of production allow one to express labor’s share as
wL Y
w
A f kL ( )
λ ≡ =
(5) ,
where w is the real wage, k ≡ (AKK)/(ALL) is the ratio of efficiency units
of capital to efficiency units of labor, and f (k) ≡ F (k, 1). Furthermore, if real wages and the rental rate on capital are determined competitively, then
w Y
L A f k k f k r
Y
K A f k
L
[
( ) ( )]
K ( )= ∂
∂ = − ′ = ∂∂ = ′
(6) , and .
Thus, we can write labor’s share as
k k f k
f k k
( ) ( )
( ) ( )
λ = − ′ ≡ − α
26 Brookings Papers on Economic Activity, Fall 2013
Due to the presence of competitive product markets, the remainder a(k) is of course capital’s share.
Two key implications emerge from this simple model: First, labor’s share is a function solely of the capital-labor ratio expressed in efficiency units, k. Second, it is determined exclusively by the structure of production embodied in f(). It follows that, in this simple economy, the labor share can
move over time if technology is not isoelastic (that is, not Cobb-Douglas), and the ratio of efficiency units of capital to efficiency units of labor k moves over time.
Since Hicks (1932), it has been well understood that the relationship between the labor share l and the effective capital-labor ratio k can be linked generally to the elasticity of substitution between effective capital and labor, which we shall denote s:
d k
d F F k
d k
d k k
(
)
( )( ) ( )
σ = = +
− λ
λ
λ′
−
(8) ln
ln 1
1 1
ln
ln 1 as 0.
2 1
1
Thus, the labor share l (k) is predicted to decrease in k whenever the elas-ticity of substitution is greater than one (and vice versa). Put another way, whenever effective labor and capital are more substitutable than implied by a Cobb-Douglas production function, the labor share will decline in the effective capital-labor ratio k.
Eighty years after Hicks’ insight, Karabarbounis and Neiman (2013) revived this notion as a potential explanation of the evidence they pre-sent for secular declines in the global labor share. Based on cross-country variation, they infer estimates of the elasticity of substitution in the neigh-borhood of s= 1.25.23 Importantly, however, the presence of an elasticity of substitution different from one is not a sufficient condition for generat-ing long-run movements in labor’s share. For example, a standard result is that purely labor-augmenting technical change will imply that the effective capital-labor ratio k will be constant along a balanced-growth path, and thus so will the labor share, regardless of the elasticity of substitution.24 The key to this story is the generation of long-run movements in capital
23. By contrast, Antras (2004) and Chirinko (2008) suggest estimates of sigma in the range 0.4 to 0.6.
Michael elsby, bart hobijn, and ays¸egül s¸ahi.n 27
intensity; in the case of s >1, it is necessary for the effective capital-labor ratio to trend upward.
Neoclassical theory suggests two potential sources for capital deep-ening of this sort. The first is through capital-augmenting technical progress—that is, if AK in the above notation grows over time. A
sec-ond channel is through investment-specific technical change driven by reductions in the relative price of investment associated with efficiency gains in the production of new capital goods (Greenwood, Hercowitz, and Krusell 1997). Karabarbounis and Neiman (2013) highlight the latter as a particularly promising candidate explanation for the decline in labor’s share.
A great virtue of the simple neoclassical framework is that it delivers a rich set of empirical predictions on the joint evolution of labor’s share, fac-tor prices, and productivity. These predictions can be confronted with the wealth of available data to assess the ability of this explanation to account for the evolution of labor’s share in the United States.
To demonstrate this, we begin with a simple observation. It is apparent from the alternative series in figure 3 that labor’s share has not trended downward throughout the postwar era. Despite some differences across measures, the strongest evidence of a decline emerges after the 1980s. (This, of course, is why the proposed stability of the labor share has been such a robust stylized fact of macroeconomics.) Thus, for the decline of labor’s share to be a manifestation of the structure of production and the nature of technical progress requires that one or both of these have changed at some point in time. This simple observation has interesting implications for the process by which a decline in labor’s share will emerge.
A first corollary is a qualitative one. As the preceding discussion demon-strates, if s >1, the key to a shrinking labor share must be traced to a form of capital deepening—that is, the capital-labor ratio in efficiency units k must grow. But neoclassical theory also predicts that growth in k will be associated with other adjustments in the economy. An important example in the U.S. context is that, for a given growth rate of labor-augmenting tech-nical progress, both output-per-hour Y/L = ALf (k) and real wages w = AL
[f(k) - kf′(k)] will be predicted to grow faster. And, consistent with a declining labor share, the additional growth in output per hour will outstrip the additional growth in real wages.
28 Brookings Papers on Economic Activity, Fall 2013
Productivity and Costs program for the nonfarm business sector.25 The growth rate of the labor share, of course, is simply the difference between growth in hourly compensation and output per hour. All series are plotted as 10-year centered moving averages to smooth out high-frequency varia-tion associated with business cycles, short-run adjustment dynamics, and so forth.
The decomposition of the decline in labor’s share in figure 7 suggests that the experience of the United States in recent decades is only partly
Log points
Quarterly observations
Source: Bureau of Labor Statistics.
Note: Values are 10-year centered moving averages of annualized growth rates. Real wages deflated using the NFB output deflator.
1998 2003 1993
1988 1983 1978 1973 1968 1963 1958 1953 0.5
1 1.5 2 2.5 3
Growth in real hourly compensation Growth in output per hour
Figure 7. growth of real hourly compensation and output per hour in the nonfarm business sector, 1953–2008
Michael elsby, bart hobijn, and ays¸egül s¸ahi.n 29
consistent with a neoclassical story based on an elasticity of substitution in excess of one together with capital deepening. Viewed through this lens, two distinct episodes are apparent. The decline in the labor share from the 1980s to the mid-1990s was characterized in part by a period of rising growth in the late 1980s during which growth in average labor productiv-ity surpassed hourly compensation growth, consistent with the neoclassical story above.
By contrast, however, the substantial recent decline in the labor share that emerged at the turn of the 21st century appears wholly due to a slow-down in growth marked by a profound, and unprecedentedly sharp, stagna-tion of hourly compensastagna-tion growth. This important feature of the recent U.S. experience appears hard to reconcile with a simple story based on the structure of production and technical change.
In addition to this qualitative observation, the simple theoretical analysis above also highlights quantitative implications of the timing of the decline in labor’s share. Rearranging equation 8 provides a tight link between the elasticity of substitution s and the magnitude of the response of labor’s share to the effective capital-labor ratio k:
d λ = − − λ σ −
(
)
d kσ
(9) ln 1 1 ln .
Evaluating the latter at a value of s= 1.25 and a reasonable value for labor’s share, say l= 0.6, suggests a d lnl(k)/d ln k of around -0.08. Thus, to generate an 8-percent decline in the labor share—which is about the magnitude seen in the data—it is necessary for the capital-labor ratio in efficiency units, k, to double. If, as neoclassical theory suggests, the latter is the outcome of either capital-augmenting or investment-specific technical progress, growth in the capital-labor ratio K/L will be predicted to acceler-ate for a given growth racceler-ate of labor-augmenting technical progress.
This suggests an additional simple check on the neoclassical account for movements in labor’s share, namely to confront this prediction with the empirical behavior of modern estimates of the capital-labor ratio. Figure 8 implements this using the real-time growth accounting data recently devel-oped by Fernald (2012).26
Fernald provides a measure of capital input constructed from an aggre-gate of individual measures of heterogeneous capital goods based on
30 Brookings Papers on Economic Activity, Fall 2013
the perpetual inventory method. Consistent with firm optimization, the aggregate capital stock is measured as a service-flow-weighted sum of the stocks of each type of capital, where the weights are based on user cost estimates for each type.
Figure 8 plots the growth rate of the capital-labor ratio implied by Fer-nald’s measure of capital input and the BLS Labor Productivity and Costs measure of hours worked for the business sector. Again, series are plotted as 10-year centered moving averages to highlight medium-run variation. It is clear from figure 8 that there have been periods of elevated growth in the capital-labor ratio. However, the timing of these periods of capital deepening does not align straightforwardly with the timing of movements in labor’s share. Although the 1990s witnessed significant growth in K/L, the period since 2000, during which labor’s share has fallen substantially, has instead been marked by a considerable slowdown in growth in capital intensity.
Log points
Quarterly observations
Source: Fernald (2012).
Note: Values are 10-year centered moving averages of annualized growth rates.
2002 1997 1992 1987 1982 1977 1972 1968 1962 1957 0
1 2 3 4 5
Capital-labor ratio Investment-specific technological change
Michael elsby, bart hobijn, and ays¸egül s¸ahi.n 31
For a given rate of labor-augmenting technical progress, then, the paths of real wages, productivity, and the capital-labor ratio since 2000 diverge from the paths implied by an account of the decline in labor’s share based on capital deepening. A potential reconciliation, of course, is that the rate of labor-augmenting technical progress fell since 2000. Two considerations add a note of caution to that interpretation. First, any such declines in the growth of AL would have to be so precipitous that they more than offset the
acceleration of growth in the effective capital-labor ratio k at the heart of the capital deepening story. Second, measures of investment-specific tech-nological change have exhibited a similar slowdown since 2000. Figure 8 reveals that, although the initial acceleration in investment-specific tech-nological change coincided with the onset of the decline in the labor share, the acceleration of the decline in the labor share over the last decade was not accompanied by an acceleration in investment-specific technological change. On the contrary, investment-specific technological change slowed down during the latter period.
The evidence suggests that the origins of the falling labor share in the United States do not dovetail easily with the neoclassical theory of distribution based on a simple aggregate production function. This has two possible implications: Either neoclassical theory is unable to provide a coherent account of the decline in labor’s share, or a simple aggregate production function is too crude to capture the relevant economic forces. In the remainder of this section, we explore the latter by investigating the potential role of richer production structures and factor heterogeneity.
III.B. Skill-Biased Technological Change and Capital-Skill Complementarity
The simple aggregative benchmark analyzed above makes strong assump-tions about the nature of the production process. A prominent example is its abstraction from heterogeneity in capital and labor, for example by vintage and by skill. There are empirical reasons to suspect that such heterogene-ities have played an important role in recent decades in the U.S. economy. In particular, the substantial growth in wage inequality in the United States since the early 1980s has motivated two prominent and related hypotheses on the structure of technology.
32 Brookings Papers on Economic Activity, Fall 2013
the possibility that the elasticity of substitution between capital and skilled labor is less than that between capital and unskilled labor (Griliches 1969; Berman, Bound, and Griliches 1994). Applied to the case at hand, declines in the relative price of new investment goods since the 1980s could have stimulated capital deepening and thereby an increased skill premium due to capital-skill complementarity (Krusell and others 2000).
In isolation, neither explanation provides an obvious account for a decline in the labor share. Skill-biased technical change can arise even in the presence of constant factor shares (for example, a Cobb-Douglas technology between capital and a constant-elasticity-of-substitution aggre-gate of labor by skill). Likewise, by operating through movements in the capital-labor ratio, the capital-skill complementarity story will affect the labor share for the same reasons noted in the subsection above—that is, if the elasticity of substitution between capital and labor (regardless of skill) differs from unity. Indeed, in their quantitative analysis of capital-skill complementarity, Krusell and others (2000) find very small effects on the labor share.
To see why, consider a constant-returns-to-scale aggregate production function with three factors, y = F (k, s, u), where capital k, skilled labor s, and unskilled labor u = 1 - s all are measured in units of effective labor. Mirroring equation (9), it is possible to show that labor’s share will move according to the following relation:
d d k
s
s d s
s ks s ku
s ku s ks
}
{
[
]
(
)
(
)
(
)
λ = − − λ ω ρ + − ω ρ
+
− − ω ρ − ω ρ
(10) ln 1 1 ln
1 1 ln ,
where rks ≡ (sks - 1)/sks and rku ≡ (sku- 1)/sks\u measure the degree of
substitutability27 between capital and labor by skill, and w
s is the skill share
of labor income. Equation 10 reiterates the point that the effect of capital deepening on labor’s share in this more complicated environment mirrors those noted above in equation 9, where the overall degree of
Michael elsby, bart hobijn, and ays¸egül s¸ahi.n 33
ability between capital and labor takes the form of a weighted average of
rks and rku.
What is new is that changes in the skill mix of the labor force can cause the labor share to move in the presence of capital-skill complementarity (rks < rku). Possible reasons for such a change include growth in the supply
of highly educated workers and skill-biased technical change.
The magnitudes of such effects of “skill deepening” could be substan-tial. For example, Acemoglu and Autor (2011) present estimates of relative weekly wages and supply for college- versus high school-educated workers using March Current Population Survey data for the years 1963 to 2008. These estimates suggest that the share of college-educated workers (in effi-ciency units) s rose by around 75 log points over this period, and average values for the skill share of labor income and relative supply of around
ws≈ 0.5 and s/(1 - s) ≈ 1. Krusell and others (2000) provide estimates of
capital-skill complementarity parameters of about rks≈-0.5 and rku≈ 0.4.
Combining these with a reasonable value for labor’s share, l= 0.6, suggests a contribution of skill deepening to a decline in l on the order of
-0.4 × (1 × 0.5 × 0.4 + 0.5 × 0.5) × 75 = 13.5 log points, similar to the order of magnitude seen in the data.
Despite this, a difficulty with this line of reasoning relates to the timing of movements in the labor share. Figure 9 illustrates the point. Rises in the skill share of labor have occurred continually since the 1960s in the United States. Thus, the implied labor share, which is computed using a rolling year-by-year implementation of equation (10), is also predicted to fall con-tinually throughout the sample period. As we have emphasized before, the reductions in the empirical labor share in figure 3 are concentrated after the 1980s, preceded by relative trend stability, in contrast to the predictions of figure 9. Put another way, the United States has not experienced a sharp acceleration in the skill share of labor in recent decades in a manner con-sistent with the timing of movements in the labor share.
III.C. Taking Stock
34 Brookings Papers on Economic Activity, Fall 2013
Of course, our analysis does not definitively rule out the possibility that some other neoclassical explanation is able to fit the facts. What it does suggest, however, is that the canonical production structures that have been highlighted by recent and past literature fall short when confronted with the empirical movements in the U.S. labor share, especially those that have emerged during the last decade.
With an eye to the results of the analyses that follow, we close this section with a discussion of a different channel, namely the potential role of international trade in shaping movements in the labor share. We con-tinue the theme adopted throughout this section of viewing the economy through the lens of an aggregate production function. Here, however, we abstract from technical change and focus instead on the role of inter mediate inputs imported from abroad. Thus, production is given by y = F (k,m), where y, k, and m respectively denote output, capital, and imported inputs per unit of labor. Note that we are interested in labor’s share of domestic income—that is, output net of payments to imported
Implied labor share (λ) Skill share of labor
Source: Skill share of labor and implied path of labor share based on the estimates of Acemoglu and Autor (2011) and Krusell and others (2000).
0.1 0.2 0.3 0.4 0.5 0.6
0.54 0.56 0.58 0.6 0.62 0.64
1968 1973 1978 1983 1988 1993 1998 2003 Implied labor share (λ)
(left axis)
Skill share of labor (s) (right axis)
Michael elsby, bart hobijn, and ays¸egül s¸ahi.n 35
factors. Under constant returns, the effect of increased use of imported intermediates is given by
)
(
)
(
∂ λ
∂ = − − λ µ ρ − ρ
(11) ln
lnm 1 lm km ,
where rlm and rkm index the substitutability28 of labor and capital with
respect to imported inputs, and µ is the income share of m in gross output y. Taken from an aggregate perspective, then, increased import exposure will reduce labor’s share if imported intermediates are more substitutable with labor than they are with capital, rlm >rkm. Intuitively, imported intermediates
will be expected to induce greater substitution away from labor than from capital in this case. Our examination of disaggregated data in the ensuing sections shows that there is something to that expectation. For now, though, we note that the timing of the recent expansion of trade with developing economies accords somewhat better with the timing of the trend decline in the labor share since the late 1980s relative to accounts based on capital deepening.29 In what follows, we show that there is a parallel link between these two trends in more disaggregated data.
IV. Exploiting Cross-Industry Variation
Since the most common aggregate production function representations fail to match the recent path of the labor share, in this section we con-sider several explanations that exploit cross-industry variation in payroll share declines documented in section II. We first revisit the investment-specific technological change hypothesis from an industry perspective. Available data for the period 1987 to 2011 suggest that it is not the case that the industries that saw the smallest increases in equipment prices are also those with the highest payroll share declines. We then consider two alternative explanations for the declines in labor shares across industries: (i) declines in unionization, and (ii) increased import competition. Our data yield one robust correlation: that declines in payroll shares are more
28. As before, here rij≡ (sij- 1)/sij, and the ss are the Hicks direct partial elasticities
of substitution.