Dr. Prakash. V. Diwan, Dean/Director,
School of Pharmacy, Anurag Group of Institutions, Ghatkesar, Hyderabad, Andhra Pradesh, India. Mobile no.: +91-9160266605
Email: [email protected]
Address for correspondence
Access this article online www.japer.in
Development and validation of UV Spectrophotometric method for
simultaneous estimation of Lamivudine and Efavirenz in the Pharmaceutical
dosage form
INTRODUCTION
Nucleoside reverse transcriptase inhibitors
(NRTIs) were the first class of drugs, which were
introduced as antiretroviral agents for the
treatment of infection with human immune
deficiency virus (HIV). Additional drug classes
were developed. They are protease inhibitors
(PIs), non-nucleoside reverse transcriptase
inhibitors (NNRTIs) and fusion inhibitors.
Lamivudine is nucleoside reverse
transcriptase inhibitors with activity against
human immune deficiency virus (HIV) and
hepatitis B virus Fig. 1(a). Nucleoside reverse
transcriptase inhibitors (NRTIs) are the prodrugs
that require intracellular phosphorylation to
their corresponding triphosphate derivatives,
which are the active inhibitors of HIV reverse
transcriptase. [1-2]
Efavirenz is non-nucleoside reverse
transcriptase inhibitors. It is used in the
treatment of HIV infection Fig. 1(b). It binds
directly and reversibly to the catalytic site of the
reverse transcriptase enzyme. [3-4]
According to the literature survey it was found
that few analytical methods such as UV [5-6] and
HPLC methods [7-16] were reported for lamivudine
and efavirenz. To our knowledge, no study
related to the UV spectrophotometric method for
simultaneous estimation of lamivudine and
efavirenz have been reported in literature.
Therefore, there is a challenge to develop UV
Spectrophotometric method for the simultaneous
estimation of lamivudine and efavirenz. The
present study was involved in a research effort
aimed at developing and validating a simple,
specific, accurate, economical and precise UV Original Article
A simple, specific, accurate and precise UV spectrophotometric method has been developed for simultaneous estimation of lamivudine and efavirenz in pharmaceutical dosage form. The absorption maxima of the drugs were found to be at 271 and 247 nm for lamivudine and efavirenz respectively. Lamivudine and efavirenz obeyed Beer’s law in the concentration range of 10-100 µg/ml and 10-70 µg/ml respectively. Different analytical parameters such as linearity, precision, accuracy, limit of detection (LOD) and limit of quantification (LOQ) were determined as per ICH guidelines. Limit of detection and quantification values for lamivudine 10 and 3.5 μg/ml and for efavirenz 10 and 3.0 μg/ml respectively. The recovery values between prescribed limit of 98-102% shows that method is free from interference of excipients present in formulation. The developed method was free from interferences due to excipients present in formulation and it can be used for routine quality control analysis.
Keywords: Lamivudine; efavirenz; UV spectrophotometric method; simultaneous equation method.
ABSTRACT Manikanta Kumar A, B. Naga
Sandhya*, Mahesh Nasare, V.V.L.N Prasad, Prakash.V.Diwan.
Department of Pharmaceutical Analysis and Quality assurance, School of Pharmacy, Anurag Group of Institutions, Venkatapur (V). Ghatkesar (M), Rangareddy (D).
spectrophotometric method for the simultaneous
estimation of two drugs in pharmaceutical
dosage form.
MATERIALS AND METHODS
Materials:
Hydrochloric acid, Sodium hydroxide, water,
acetonitrile, methanol, lamivudine and efavirenz.
Instrument:
UV double beam spectrophotometer (Shimadzu
model 1800) was employed with a spectral band
width of 1nm and a wavelength accuracy of 0.3
nm (with automatic wavelength correction with a
pair of 1 cm matched quartz cells)
Method:
The UV spectra’s of lamivudine and efavirenz in
different solvents like water, acetonitrile,
methanol, sodium hydroxide and hydrochloric
acid were recorded. These two drugs showed
good absorbances when dissolved in acetonitrile.
Hence acetonitrile was selected as the solvent for
the method. Lamivudine and efavirenz (10 mg
each) were separately weighed and transferred
to a 100 ml volumetric flask and all the two drugs
were dissolved in acetonitrile to get a solution of
100 µg/ml. Working standard solutions of 50
µg/ml of each of the drugs were prepared and
scanned in the range 400-200 nm to obtain the
absorbance spectra and overlain spectra (Fig.2).
Two wavelengths 271 and 247 nm were selected
which are the λmax of two drugs lamivudine and
efavirenz respectively. The absorbance of
lamivudine and efavirenz was measured and the
absorptivity values E (1%, 1cm) were
determined at all the two selected wavelengths.
The concentrations of two drugs in mixture can
be calculated using the following equations,
CX= A2ay1-A1ay2/ax2ay1- ax1ay2….…(1)
CY = A1ay2-A2ax1/ax2ay1- ax1ay2….…(2)
where, Clamivudine and Cefavirenz are the
concentrations of lamivudine and efavirenz
respectively in mixture and in sample solutions.
A1 and A2 are the absorbances of sample at 271
and 247 nm, respectively, ax1 and ax2 are the
absorptivity of lamivudine at 271 and 247 nm
respectively, ay1 and ay2 are the absorptivity of
efavirenz at 271 and 247 nm, respectively.
RESULTS AND DISCUSSION
Validation of the method:
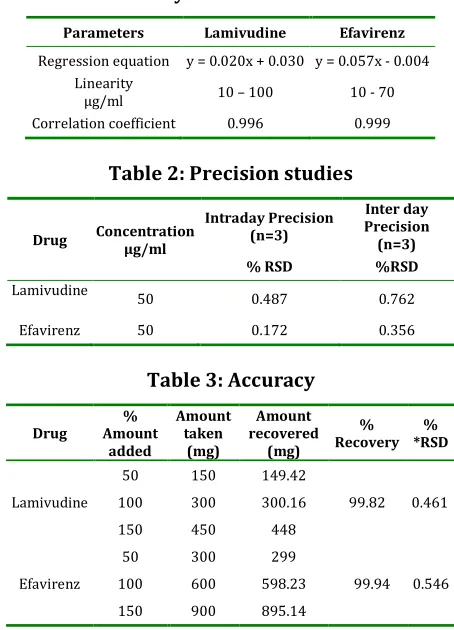
Linearity:
Linearity was established by least squares linear
regression analysis of the calibration curve. The
calibration curves were linear over the
concentration range of 10-100 μg/ml for
lamivudine and 10-70 μg/ml for efavirenz.
Absorbances were plotted versus respective
concentrations and linear regression analysis
was performed on the resultant curves.
Correlation coefficients were found to be 0.996
and 0.999 for lamivudine and efavirenz
respectively (Fig. 3-4). The results are given in
Table 1.
Precision:
To check the degree of repeatability of the
method, suitable statistical evaluation was
carried out. The concentrations of two drugs
were measured three times on the same day at
intervals of 1hr and on three different days for
intra and inter day study, respectively. The
Standard Deviation (SD) and Relative Standard
Deviation (RSD) were calculated. The results are
given in Table 2.
Accuracy:
Recovery studies were carried out by applying
amount of standard lamivudine and efavirenz
corresponding to 50, 100 and 150% of label
claim had been added. At each level of the
amount six determinations were performed. The
results are given in Table 3.
LOD and LOQ:
The LOD of lamivudine and efavirenz was found
to be 3.5 µg/ml and 3.0 µg/ml respectively and
the LOQ was found to be 10 µg/ml and 10 µg/ml
respectively. The results are given in Table 4.
Analysis of marketed formulation:
Twenty Odivir-kits each containing 300 mg
lamivudine and 600 mg efavirenz were weighed,
average weight was calculated and powdered. A
quantity equivalent to 300 mg of lamivudine and
600 mg of efavirenz was weighed and transferred
into 100 ml volumetric flask. It is extracted with
acetonitrile. The volumetric flask was sonicated
for 20 minutes to affect the complete dissolution
of the drugs and the solution was made up to the
volume with acetonitrile and filtered. Suitable
aliquots of formulation were prepared and
scanned to obtain concentration of the two drugs
in the linearity range. The concentration of each
analyte was determined using the simultaneous
equation (Fig. 5) (Table 5).
CONCLUSION
This method is considered simple, reliable,
selective providing satisfactory accuracy,
precision with lower limits of detection and
quantification more specific and sensitive. The
good recoveries were obtained in all cases as well
as the reliable agreement with the reported
procedure proved that the proposed methods
could be applied efficiently for determination of
lamivudine and efavirenz in oral dosage form
with satisfactory precision. More over the shorter
duration of analysis for lamivudine and efavirenz
makes the reported method suitable for routine
analysis in pharmaceutical dosage forms.
ACKNOWLEDGEMENT
I am very much thankful to School of Pharmacy,
Anurag Group of Institutions, Hyderabad, for
giving permission to carry out my work.
Table 1: Linearity and Correlation coefficient
Parameters Lamivudine Efavirenz
Regression equation y = 0.020x + 0.030 y = 0.057x - 0.004
Linearity
µg/ml 10 – 100 10 - 70
Correlation coefficient 0.996 0.999
Table 2: Precision studies
Drug Concentration
µg/ml Intraday Precision (n=3) Inter day Precision (n=3)
% RSD %RSD
Lamivudine
50 0.487 0.762
Efavirenz 50 0.172 0.356
Table 3: Accuracy
Drug % Amount added Amount taken (mg) Amount recovered (mg) % Recovery % *RSD Lamivudine
50 150 149.42
99.82 0.461
100 300 300.16
150 450 448
Efavirenz
50 300 299
99.94 0.546
100 600 598.23
150 900 895.14
*mean of six observations
Table 4: LOD and LOQ studies
Validation parameters Lamivudine Efavirenz
Limit of Detection (LOD) µg/ml 3.5 3.0
Limit of Quantification (LOQ) µg/ml 10 10
Table 5: Analysis of Formulation
Drug Labelled amount
(mg/tablet) Amount found (mg/tablet) % Label claim % *RSD
Lamivudine 300 298.92 99.64 0.095
Efavirenz 600 598.67 99.77 0.715
Fig. 1a. Structure of Lamivudine
Fig. 1b. Structure of Efavirenz
Fig. 2: Overlain Normal spectra of Lamivudine and Efavirenz in Acetonitrile
Fig. 3: Calibration Curve of Lamivudine at 271 nm
Fig. 4: Calibration Curve of Efavirenz at 247 nm
Fig. 5: Spectrum of Lamivudine and Efavirenz
formulation
REFERENCES
1. en.wikepedia.org/wiki/lamivudine accessed on 1-1-2012.
2. http://www.drugbank.ca/drugs/DB00709 accessed on 1-1-2012.
3. en.wikipedia.org/wiki/efavirenz accessed on 1-1-2012.
4. www.drugbank.ca/drugs/DB00625 accessed on 1-1-2012.
5. Deepali G., Elvis M. UV spectrophotometric method for assay of the anti-retroviral agent lamivudine in active pharmaceutical ingredient and in its tablet formulation. Pharm analysis. 2010; 2 (4):417-419. 6. Anand Kumar Y., Rama Rao N. Development of
rapid UV Spectrophotometric method for the estimation of efavirenz in formulations. E-Journal of Chemistry. 2010; 7(3):856-860.
pharmacokinetics. J. Chromat. B. 2005; 823:213– 217.
8. Checa A., Oliver R., Hernandez-Cassou.S and Saurina J. Reversed-phase liquid chromatographic method with spectrophotometric detection for the determination of antiretroviral drugs. Analyt. Chim. Acta. 2008; 616:85–94.
9. Kano E.K., Reis Serra E. E., Koono, M., Andrade S. S. and Porta. V. Determination of lamivudine in human plasma by HPLC and its use in bioequivalence studies. Int. J. Pharm. 2005; 297:73–79.
10.Kapoor N., Sateesh K. and Ramesh. P. Simultaneous determination of lamivudine and stavudine in antiretroviral fixed dose combinations by first derivative spectrophotometry and high performance liquid chromatography. J. Pharmaceut. Biomed. Ana. 2006; 41:761–765. 11.Mogatle, S. and I. Kanfer. Rapid method for the
quantitative determination of efavirenz in human plasma. J. Pharmaceut. Biomed. Anal. 2009; 49:1308–1312.
12.Marzolini, C. Telenti, A. Buclin, T. Biollaz, J. and Decosterd. L.A. Simultaneous determination of the HIV protease inhibitors indinavir, amprenavir, saquinavir, ritonavir, nelfinavir and the non-nucleoside reverse transcriptase inhibitor efavirenz by high-performance liquid chromatography after solid-phase extraction. J. Chromat. B. 2000; 740:43–58.
13.Matthews, C.Z. Woolf, E.J. Mazenko, R.S. Haddix-Wiener. H. Chavez-Eng, C.M. Constanzer, M.L. Doss, G.A. and Matuszewski. B.K. Determination of efavirenz, a selective non-nucleoside reverse transcriptase inhibitor, in human plasma using HPLC with post-column photochemical derivatization and fluorescence detection. J. Pharmaceut. Biomed. Anal. 2000; 28:925–934. 14.Nacenta, M. S. Pua, Y.L. Cortes, L. F. L. Mallolas, J.
Jose, M. And Carne. X. Determination of efavirenz in human plasma by high-performance liquid chromatography with ultraviolet detection. J. Chromat. B. 2001; 763:53–59.
15.Notari, S. Mancone, C. Alonzi, M. Tripodi, Narciso, P. And Ascenzi. P. Determination of abacavir, amprenavir, didanosine, efavirenz, nevirapine, and stavudine concentration in human plasma by MALDI- TOF/TOF. J. Chromat. B. 2008; 863:249– 257.
16.Notari, S. Bocedi, A. Ippolito, G. Narciso, P. Pucillo, L.P. Tossini, G. Donnorso, R. P. Gasparrini, F. and Ascenzi. P. Simultaneous determination of 16 anti-HIV drugs in human plasma by high-performance liquid chromatography. J. Pharmaceut. Biomed. Anal. 2006; 831:258–266.
Manikanta Kumar. A, B. Naga Sandhya*, Mahesh Nasare, V. V. L. N Prasad, Prakash V Diwan; Development and validation of UV Spectrophotometric method for simultaneous estimation of Lamivudine and Efavirenz in the Pharmaceutical Dosage Form; J. Adv. Pharm. Edu. & Res. 2012:; 4: 210-214.