Research Article
Comparing the performance of Turkish deposit banks by using DEMATEL, Grey
Relational Analysis (GRA) and MOORA approaches12
Serhat Yüksel3, Hasan Dinçer4, Şenol Emir5
Received: 23/08/2017; Revised: 30/10/2017; Accepted: 27/11/2017
Abstract
The purpose of the study is to measure the financial performance in Turkish banking sector and to combine the data mining with the multi-criteria decision-making methods. For this purpose, a text-mining process is applied to measure the pairwise comparison of the criteria and the results are used in the integrated models. DEMATEL-GRA and DEMATEL-MOORA are defined as two integrated models. The results show that integrated models give the coherent outcomes and the text-mining process could be adapted properly in the multi-criteria decision-making methods. It is also concluded that foreign banks have better performance in comparison with state and private banks.
Keywords: Turkish Banking Sector, GRA, DEMATEL, MOORA JEL Codes: C51, G21, L25
1
This study was presented in “I. International Symposium on Economics, Finance, and Econometrics (ISEFE)” on 21.09.2017.
2Acknowledgements The authors are grateful for comments received from the referees.
3 Asst.Prof., Istanbul Medipol University, School of Business and Management, Beykoz, 34810, Istanbul,
Turkey, [email protected]
4Assoc.Prof., Istanbul Medipol University, School of Business and Management, Beykoz, 34810, Istanbul,
Turkey, [email protected]
1. Introduction
The main function of the banks in an economy is to intermediate between economic agents that need funds to satisfy their needs or to invest and those that have funds to lend thanks to their savings (Yüksel, 2017). Thus, banks play a crucial role in the economy. First, they contribute to increase the investment. Hence, they have a positive influence on the economic growth. In addition, they also help economic agents with savings to earn more money. Lastly, they help to decrease unemployment rate in the country as they employ many people (Yüksel and Zengin, 2017).
Owing to the aspects emphasized above, the banking sector is accepted as one of the key sectors in the economy. Hence, their performance should be high for the sustainability of economic growth. However, banks are subject to many different risks due to their operations. For instance, there is a risk that debtors cannot pay their debts to the banks. In addition, banks may suffer important losses because of the volatility in the market (Oktar and Yüksel, 2016). As a result, the performance of the banks should be evaluated periodically in order to prevent any problems in the sector.
Turkey is a country that suffered from two different banking crises both in 1994 and in 2000. Especially after the second crisis, Turkey adopted many different programs to improve the quality of the banking sector. For example, Banking Regulation and Supervision Agency was founded in this period to control the risks of Turkish banks. Owing to these kinds of reforms, it can be said that there is an improvement in the performance of Turkish banking sectors.
The aim of this study is to evaluate the performance of Turkish banking sector. For this purpose, DEMATEL, Grey Relational Analysis (GRA) and MOORA multi-criteria decision-making approaches are used. Hence, it will be possible to see which banks are more successful in Turkey. By this way, recommendations can be presented in order for Turkish banks to increase their performance. Another key point is that by using these new and original methods, it is believed that this study makes an important contribution to the literature.
This study consists of 6 different parts. After the introduction, the second part gives general information about Turkish banking sector. Within this context, the number of the banks and employees and amount of total assets, loans and deposits will be analyzed. The third part surveys the similar studies in the literature. In the fourth part, DEMATEL, GRA and MOORA approaches will be detailed. The fifth part gives information about the application in Turkish banking sector. In the final part, recommendations about the results will be shared.
2. General Information About Turkish Banking Sector
In deposit banks, foreign banks have the highest numbers (21) and private banks have the second highest number (9). Additionally, there are 3 state banks in Turkey. Moreover, 13 development and investment banks and 5 participation banks operate in Turkey. On the other side, private banks have the highest number of personnel. Moreover, although there are only 3 state banks, their numbers of employee are quite similar to the numbers of foreign banks.
Table 1:Number of Banks and Employees in 2016
Type of the Banks Number of Banks Number of Employees (thousand people)
Deposit Banks 34 191
State Banks 3 58
Private Banks 9 74
Foreign Banks 21 60
Controlled by SDIF 1 0.2
Development and Investment Banks 13 5
Participation Banks 5 15
Total 52 211
Source:The Banks Association of Turkey
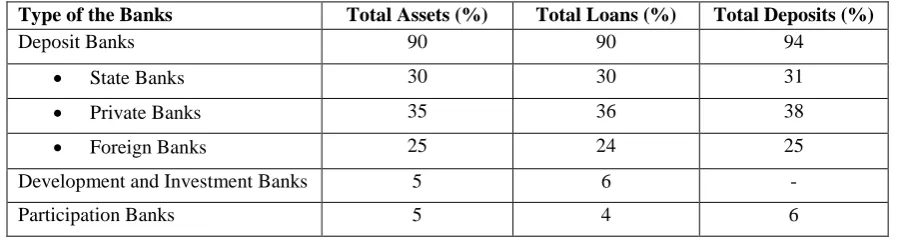
The information about the proportion of assets, loans, and deposits of different types of the banks is demonstrated in Table 2. Deposit banks are the most important bank categories in Turkey because 90% of the total assets in banking sector is held by deposit banks. In addition, they also have 90% of total loans and 94% of total deposits. In deposit banks, private banks have the highest percentage in all categories. Moreover, state banks have the second highest percentages of total assets, loans, and deposits. Another important point is that participation banks have a very small percentage in Turkish banking sector.
Table 2:Asset, Loan and Deposit Distribution of the Banks in 2016
Type of the Banks Total Assets (%) Total Loans (%) Total Deposits (%)
Deposit Banks 90 90 94
State Banks 30 30 31
Private Banks 35 36 38
Foreign Banks 25 24 25
Development and Investment Banks 5 6 -
Participation Banks 5 4 6
Source: The Banks Association of Turkey
3. Literature Review
The subject of bank performance attracted the attention of many different researchers in the literature. Some of these studies are shown in Table 3.
economies. By inspecting regression analysis results, it was concluded that state banks are more profitable, but take more risk than other banks. In spite of this study, Saghi-Zedek (2016) reached the opposite results. He worked on 710 different European banks by using the same methodology. It was emphasized that state banks have lower performance in comparison with others. Moreover, Shaban and James (2017) also underlined the similar results by using the same methodology for Indonesia. On the other hand, Akhigbe et. al. (2017b) focused on US banking sector and identified that there is not an important difference between the performance of public and private banks.
Furthermore, some studies emphasized the importance of bank specific factors in the performance of the banks. Dong et. al. (2016) made a study for China by using regression analysis. They found a positive relationship between the size and the performance of the banks. Gerhardt and Vander Vennet (2016) also emphasized the similar results for 114 European banks with the help of logit method. Additionally, Bitar et. al. (2016) worked for the countries in MENA region by using regression analysis. They found that there is a positive relationship between capital adequacy ratio and the performance of the banks. Sun et. al. (2017) and de Bandt et. al. (2017) also reached the same results by using a different technique. In addition, Salim et. al. (2016) and King et. al. (2016) concluded that the education level of CEOs has a positive influence on the performance of the banks.
With respect to the bank specific factors, some studies underlined that technical efficiency of the banks is important to increase the performance. Chai et. al. (2016) made a study for Malaysia by using regression analysis. They reached the conclusion that technological efficiency of the banks improves the performance. Meles et. al. (2016) also emphasized the similar results for US banking sector by using the same methodology. Juo et. al. (2016) focused on Taiwanese banking sector by using data envelopment analysis. They concluded that technical efficiency of the banks affects the profitability. In addition to the technological efficiency, Bian and Deng (2017) and Fukuyama and Matousek (2017) identified that there is a relationship between non-performing loans and the performance of the banks.
Table 3:Featured Studies in the Literature
Author Scope Model Result
Mirzaei and Moore
(2016) Qatar
Regression Analysis
There is a relationship between industry growth and bank performance.
Ghosh (2016) 169 different
countries GMM
Banking-sector globalization has a decreasing effect on the profitability of the banks.
Chai et. al. (2016) Malaysia Regression Analysis
The technological efficiency of the banks increases the performance.
Salim et. al. (2016) Australia Data Envelopment Analysis
Board size and committee meetings have a positive impact on the performance of the banks.
Dong et. al. (2016) China Regression Analysis
There is a positive relationship between the size and the performance of the banks.
King et. al. (2016) US Regression Analysis
The education level of CEOs has a positive influence on the performance of the banks.
Meles et. al. (2016) US Regression
Analysis Technologic improvement of the banks increases profitability.
Nagano (2016) 11 emerging economies
Regression Analysis
It is understood that state banks take more risk than other types of the banks.
Bitar et. al. (2016) MENA Region Regression Analysis
There is a positive relationship between capital adequacy ratio and the performance of the banks.
Cai et. al. (2016) China Regression Analysis
Geographical expansion improves the performance of the banks.
Saghi-Zedek (2016) 710 European banks
Regression
Analysis State banks have lower performance in comparison with others.
Mamatzakis and
Bermpei (2016) US
Dynamic Panel Threshold
Analysis
Unconventional monetary policies have a negative influence on the performance of the banks.
Ali and Azmi (2016) Malaysia GMM Religion orientation does not have any effect on the performance of the banks.
Juo et. al. (2016) Taiwan Data Envelopment
Analysis Technical efficiency of the banks affects the profitability. Gerhardt and Vander
Vennet (2016)
114 European
banks Logit
Capital adequacy ratio, size and the quality of the loans are main indicators of the performance of the banks.
Cornett et al. (2016) US Regression Analysis
Corporate social responsibility activities affect the performance of the banks.
Bian and Deng (2017) China Regression Analysis
Non-performing loan ratio is the most significant indicator of the performance of the banks.
Jawadi et. al. (2017) 12 Islamic banks Regression
Analysis The performance of Islamic banks depends on the region.
Sun et. al. (2017)
105 different commercial
banks
GMM Capital adequacy ratio and management quality influence the performance of the banks.
Scott et. al. (2017) 29 different countries
Regression Analysis
Adoption of the SWIFT system has an important effect on the performance of the banks.
Fukuyama and
Matousek (2017) Japan
Data Envelopment Analysis
There is a relationship between non-performing loans and the performance of the banks.
Akhigbe et. al. (2017a) US Regression
Analysis Transparency increases the performance of the banks.
Boubakri et. al. (2017) 48 different countries
Regression Analysis
Banks in collectivist societies performed better than the banks in individualistic societies during the financial crisis.
de Bandt et. al. (2017) France GMM Capital has a positive impact on the performance of French banks.
Shaban and James
(2017) Indonesia
Regression Analysis
State banks have lower performance than the private and foreign banks.
Akhigbe et. al. (2017b) US Stochastic Frontier Analysis
There is not an important difference between the performance of public and private banks.
Psillaki and Mamatzakis (2017)
10 European countries
Stochastic Frontier Analysis
Structural reforms on business markets have a positive impact on the performance of the banks.
Carvallo and Kasman (2017) 19 Latin American countries Maximum Likelihood Estimator
There are many studies in the literature focusing on the determinants affecting the performance of the banks. Most of these studies underlined the importance of bank specific factors to increase the performance whereas some others emphasized the importance of country specific variables. In addition to this aspect, it can also be understood that different types of analysis methods were used in these studies, such as regression, logit, data envelopment analysis, and generalized method of moment approach. Therefore, it is identified that there is a need for a new study that focuses on the performance of the banking sector by using novel methods.
4. Methodology
4.1. DEMATEL
Decision Making Trial and Evaluation Laboratory (DEMATEL) method gives a contribution to solving the complex problems. It was developed in 1976 by the Institute of Geneva Battelle Memorial. The main advantage of DEMATEL method in comparison with others is that it is very helpful to evaluate the way and the power of the relationship between the variables (Chen, 2016). The steps of DEMATEL approach are demonstrated below (Bacudio et. al., 2016).
Step 1: Initial direct relation matrix is generated. This matrix is illustrated in Equation 1. The matrix is created based on the opinions of the experts.
𝐴𝑘= [
0 ⋯ 𝑎1𝑛𝑘
⋮ ⋱ ⋮
𝑎𝑛1𝑘 ⋯ 0 ] (1)
Step 2: Initial influence matrix is calculated. In this step, the relationship among the elements can be identified.
Step 3: Direct relation matrix is normalized. In this process, Equation 2 is used. In this equation, the term “bij” takes values between 0 and 1.
𝐵 = [𝑏𝑖𝑗]𝑛𝑥𝑛 = 𝐴
𝑚𝑎𝑥 ∑𝑛 𝑎𝑖𝑗
𝑗=1
(2)
Step 4: Total relation matrix is developed which is shown in Equation 3. In this equation, “C” represents total relation matrix and “I” gives information about identity matrix.
𝐶 = [𝑐𝑖𝑗]𝑛𝑥𝑛 = 𝐵(𝐼 − 𝐵)−1 (3)
Step 5: The prominence (D+E) and cause-effect (D-E) values are calculated. For this purpose, Equation 4 and 5 are taken into the consideration.
𝐷 = [𝑑𝑖𝑗]𝑛𝑥1 = [∑ 𝑐𝑖𝑗 𝑛
𝑗=1 𝑖𝑗
]
𝑛𝑥1
𝐸 = [𝑒𝑖𝑗]1𝑥𝑛 = [∑ 𝑐𝑖𝑗
𝑛
𝑗=1 𝑖𝑗
]
1𝑥𝑛
(5)
Step 6: Inner dependence matrix is defined. In this process, entries, which are less than the threshold value, are eliminated. The threshold value can be calculated by using Equation 6.
𝑎 =∑ ∑ 𝑐𝑖𝑗
𝑛 𝑖=1 𝑛
𝑗=1
𝑛2 (6)
DEMATEL method was frequently used in the literature to evaluate the performance of different complex systems such as creating a model for sustainable consumption and production (Luthra et al., 2017); evaluating CRM partners (Büyüközkan et. al., 2017); defining critical success factors in emergency management (Zhou, 2017); evaluating the performance of supply chain for hospitals (Supeekit et al., 2016).
4.2. Grey Relational Analysis (GRA)
In grey relational analysis, the word “grey” refers to the condition between black and white. In this aspect, “black” means that there is no information whereas “white” shows that all information is available. In other words, grey demonstrates the complex and fuzzy situation. It can be said that grey relational analysis tries to select the best condition in various alternatives by considering the complex situation. This approach was developed by Julong Deng in 1982. It helps to make decision when the conditions are very complex (Deng, 1982). The steps of grey relational analysis are demonstrated below.
Step 1: Referential series and decision matrix are created. The details are shown in Equation 7. In this equation, X_1 (n) shows the value of alternative 1 and criterion n.
𝑋𝑖 = [
𝑋1(1) ⋯ 𝑋1(𝑛)
⋮ ⋱ ⋮
𝑋𝑛(1) ⋯ 𝑋𝑛(𝑛)] (7)
Step 2: The data set is normalized. The details of “larger is better” situation are given by Equation 8.
𝑋𝑖∗(𝑗) =𝑚𝑎𝑥𝑋𝑖(𝑗) − 𝑚𝑖𝑛𝑗𝑋𝑖(𝑗)
𝑗𝑋𝑖(𝑗) − 𝑚𝑖𝑛𝑗𝑋𝑖(𝑗) (8)
If the condition is “smaller is better”, Equation 9 can be used.
𝑋𝑖∗(𝑗) = 𝑚𝑎𝑥𝑗𝑋𝑖(𝑗) − 𝑋𝑖(𝑗)
𝑚𝑎𝑥𝑗𝑋𝑖(𝑗) − 𝑚𝑖𝑛𝑗𝑋𝑖(𝑗) (9)
After the normalization the matrix becomes:
𝑋𝑖∗= [𝑋1
∗(1) ⋯ 𝑋
1∗(𝑛)
⋮ ⋱ ⋮
𝑋𝑛∗(1) ⋯ 𝑋𝑛∗(𝑛)] (10)
∆0𝑖(𝑗) = [
∆01(1) ⋯ ∆01(𝑛)
⋮ ⋱ ⋮
∆0𝑚(1) ⋯ ∆0𝑚(𝑛)
] (11)
Step 4: Grey relational coefficient is calculated. The details are given by Equation 12. In this equation, “A” takes the value between 0 and 1.
𝑟0𝑖(𝑗) = ∆𝑚𝑖𝑛+ 𝐴∆𝑚𝑎𝑥
∆0𝑖(𝑗) + 𝐴∆𝑚𝑎𝑥 (12)
Step 5: The degree of grey coefficient is calculated as shown in Equation 13. In this equation, “W” refers to the weight criteria. Subsequently, the alternative, which has the highest degree of grey coefficient, will be selected as the best alternative.
𝛤0𝑖 = ∑𝑛𝑗=1(𝑊𝑖(𝑗)𝑋𝑟0𝑖(𝑗) (13)
Grey relational analysis is mainly used in the literature in order to select the best alternative. For example, GRA is applied to select the best supplier in the telecom industry of Iran (Ahmadi et al., 2017); to evaluate the suppliers for Turkish food manufacturing firms (Sarı et al., 2016); to select the best stock in Istanbul Stock Exchange (Bayramoğlu and Hamzaçebi, 2016); to select the best web service (Li et al., 2016); to create a model for machine selection (Kabak and Dağdeviren, 2017).
4.3. MOORA
Multi-Objective Optimization on the basis of Ratio Analysis (MOORA) approach was developed by Brauers and Zavadskas in 2006. This method is used in order to evaluate complex alternatives. While making this evaluation by MOORA approach, some limitations should be taken into the consideration. The steps of this approach are given below (Brauers and Zavadskas, 2006).
Step 1: Different alternatives are defined by creating a decision matrix. The details of this matrix are shown in Equation 14. In this equation, Xijgives information about the value of the alternative j and the criterion i.
𝑋𝑖𝑗 = [
𝑋11 ⋯ 𝑋1𝑛
⋮ ⋱ ⋮
𝑋𝑚1 ⋯ 𝑋𝑚𝑛
] (14)
Step 2: The fuzzy matrix is normalized while considering vector normalization as shown in Equation 15. In this equation, the denominator shows all alternatives whereas the numerator explains the situation for alternative j and criteria i.
𝑋𝑖𝑗∗ = 𝑋𝑖𝑗
√∑ 𝑋2
𝑖𝑗 𝑚 𝑗=1
(15)
𝑌𝑖 = ∑ 𝑋𝑖𝑗∗ − ∑ 𝑋
𝑖𝑗∗ (16) 𝑛
𝑗=ℎ+1 ℎ
𝑗=1
Step 4: Weighted results are identified as shown in Equation 17.
𝑌𝑖∗ = ∑ 𝑊
𝑗𝑋𝑖𝑗∗ − ∑ 𝑊𝑗𝑋𝑖𝑗∗ (17) 𝑛
𝑗=ℎ+1 ℎ
𝑗=1
Step 5: The results are ranked, and the best alternative can be chosen.
MOORA method was used in many different studies in the literature to analyze several complex decision-making problems such as the sector selection of the students of industrial engineering departments in Turkey (Akkaya et al., 2015); evaluation of the performance of airline companies (Dinçer et. al., 2017); selection of the best logistic provider in the plastic industry (Mavi et al., 2017); selection of the best car for car renting firms (Bircan et al., 2017).
5. An Application on Turkish Banking Sector 5.1. Data and Variables
In this study, an integrated multi-criteria decision-making approach has been applied for measuring the performance of Turkish deposit banks. For this purpose, two integrated approaches entitled DEMATEL-MOORA and DEMATEL-GRA are constructed for the comparative decision-making.
Two different kinds of data have been used to analyze the criteria and alternatives. The data for the criteria has been obtained from the ScienceDirect (http://www.sciencedirect.com); while the data on alternatives (i.e. banks) is obtained from the Banks Association of Turkey. 23 deposit banks in Turkey, called as alternatives in the analysis, have been considered for ranking the performance. According to the ownership, first three banks are state-owned banks, A4 to A11 are defined as private banks while others are foreign banks.
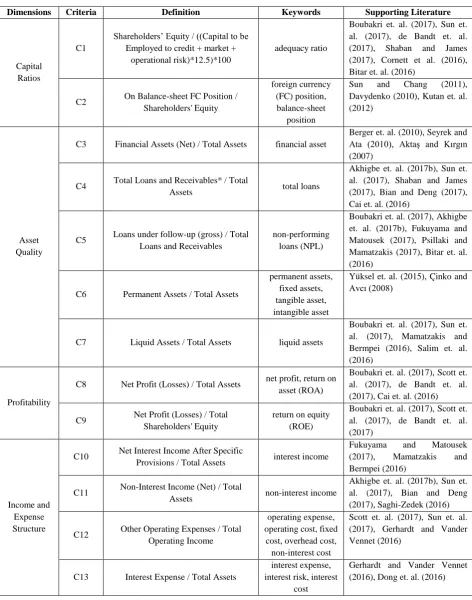
For the analysis, a set of variables extracted from the financial statements of the banks in 2015 has been defined and 13 criteria have been selected with the defined keywords based on the literature. Table 4 illustrates the selected criteria and keywords for the decision-making analysis.
5.2.Analysis Results
on this text file has been utilized. By using regular expressions, the frequency of keywords in Table 4 has been taken out of all results of the text-mining process.
Table 4: Variables Used in the Analysis
Dimensions Criteria Definition Keywords Supporting Literature
Capital Ratios
C1
Shareholders’ Equity / ((Capital to be Employed to credit + market +
operational risk)*12.5)*100
adequacy ratio
Boubakri et. al. (2017), Sun et. al. (2017), de Bandt et. al. (2017), Shaban and James (2017), Cornett et al. (2016), Bitar et. al. (2016)
C2 On Balance-sheet FC Position / Shareholders' Equity
foreign currency (FC) position, balance-sheet
position
Sun and Chang (2011), Davydenko (2010), Kutan et. al. (2012)
Asset Quality
C3 Financial Assets (Net) / Total Assets financial asset
Berger et. al. (2010), Seyrek and Ata (2010), Aktaş and Kırgın (2007)
C4 Total Loans and Receivables* / Total
Assets total loans
Akhigbe et. al. (2017b), Sun et. al. (2017), Shaban and James (2017), Bian and Deng (2017), Cai et. al. (2016)
C5 Loans under follow-up (gross) / Total Loans and Receivables
non-performing loans (NPL)
Boubakri et. al. (2017), Akhigbe et. al. (2017b), Fukuyama and Matousek (2017), Psillaki and Mamatzakis (2017), Bitar et. al. (2016)
C6 Permanent Assets / Total Assets
permanent assets, fixed assets, tangible asset, intangible asset
Yüksel et. al. (2015), Çinko and Avcı (2008)
C7 Liquid Assets / Total Assets liquid assets
Boubakri et. al. (2017), Sun et. al. (2017), Mamatzakis and Bermpei (2016), Salim et. al. (2016)
Profitability
C8 Net Profit (Losses) / Total Assets net profit, return on asset (ROA)
Boubakri et. al. (2017), Scott et. al. (2017), de Bandt et. al. (2017), Cai et. al. (2016)
C9 Net Profit (Losses) / Total Shareholders' Equity
return on equity (ROE)
Boubakri et. al. (2017), Scott et. al. (2017), de Bandt et. al. (2017)
Income and Expense Structure
C10 Net Interest Income After Specific
Provisions / Total Assets interest income
Fukuyama and Matousek (2017), Mamatzakis and Bermpei (2016)
C11 Non-Interest Income (Net) / Total
Assets non-interest income
Akhigbe et. al. (2017b), Sun et. al. (2017), Bian and Deng (2017), Saghi-Zedek (2016)
C12 Other Operating Expenses / Total Operating Income
operating expense, operating cost, fixed
cost, overhead cost, non-interest cost
Scott et. al. (2017), Sun et. al. (2017), Gerhardt and Vander Vennet (2016)
C13 Interest Expense / Total Assets
interest expense, interest risk, interest
cost
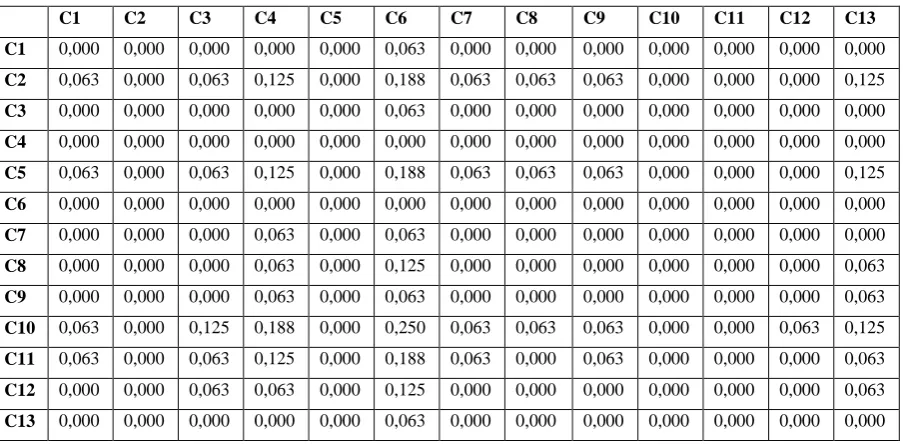
The frequency results have been utilized in the pairwise comparison matrices and accordingly the comparison results have been transformed to the five-point linguistic scales to build the direct relationship matrix and to evaluate the relative importance of each criterion with the DEMATEL method (see Table1a, in appendix). Then the direct relation matrix (see Table 2a, in appendix) is normalized and the total relation matrix is constructed (Table 5) which shows the direct/indirect relation of the criteria.
Table 5: Total relation matrix
C1 C2 C3 C4 C5 C6 C7 C8 C9 C10 C11 C12 C13
C1 0,000 0,000 0,000 0,000 0,000 0,063 0,000 0,000 0,000 0,000 0,000 0,000 0,000
C2 0,063 0,000 0,063 0,137 0,000 0,219 0,063 0,063 0,063 0,000 0,000 0,000 0,133
C3 0,000 0,000 0,000 0,000 0,000 0,063 0,000 0,000 0,000 0,000 0,000 0,000 0,000
C4 0,000 0,000 0,000 0,000 0,000 0,000 0,000 0,000 0,000 0,000 0,000 0,000 0,000
C5 0,063 0,000 0,063 0,137 0,000 0,219 0,063 0,063 0,063 0,000 0,000 0,000 0,133
C6 0,000 0,000 0,000 0,000 0,000 0,000 0,000 0,000 0,000 0,000 0,000 0,000 0,000
C7 0,000 0,000 0,000 0,063 0,000 0,063 0,000 0,000 0,000 0,000 0,000 0,000 0,000
C8 0,000 0,000 0,000 0,063 0,000 0,129 0,000 0,000 0,000 0,000 0,000 0,000 0,063
C9 0,000 0,000 0,000 0,063 0,000 0,066 0,000 0,000 0,000 0,000 0,000 0,000 0,063
C10 0,063 0,000 0,129 0,203 0,000 0,294 0,063 0,063 0,063 0,000 0,000 0,063 0,137
C11 0,063 0,000 0,063 0,133 0,000 0,207 0,063 0,000 0,063 0,000 0,000 0,000 0,066
C12 0,000 0,000 0,063 0,063 0,000 0,133 0,000 0,000 0,000 0,000 0,000 0,000 0,063
C13 0,000 0,000 0,000 0,000 0,000 0,063 0,000 0,000 0,000 0,000 0,000 0,000 0,000
Table 6 demonstrate the consecutive steps for the weights of the criteria with the DEMATEL approach. In the last step of the first stage, the impact degrees of the criteria (D+E) and the cause and effect relationship (D-E) have been computed as seen in Table 8.
Table 6: Impact degrees and weights of the criteria D E (D+E) (D-E) Weights
C1 0,0625 0,2500 0,3125 -0,1875 0,035
C2 0,8013 0,0000 0,8013 0,8013 0,091
C3 0,0625 0,378906 0,4414 -0,3164 0,050
C4 0,0000 0,859375 0,8594 -0,8594 0,097
C5 0,8013 0 0,8013 0,8013 0,091
C6 0,0000 1,517822 1,5178 -1,5178 0,172
C7 0,1250 0,25 0,3750 -0,1250 0,042
C8 0,2539 0,1875 0,4414 0,0664 0,050
C9 0,1914 0,25 0,4414 -0,0586 0,050
C10 1,0752 0 1,0752 1,0752 0,122
C11 0,6565 0 0,6565 0,6565 0,074
C12 0,3203 0,0625 0,3828 0,2578 0,043
C13 0,0625 0,65625 0,7188 -0,5938 0,081
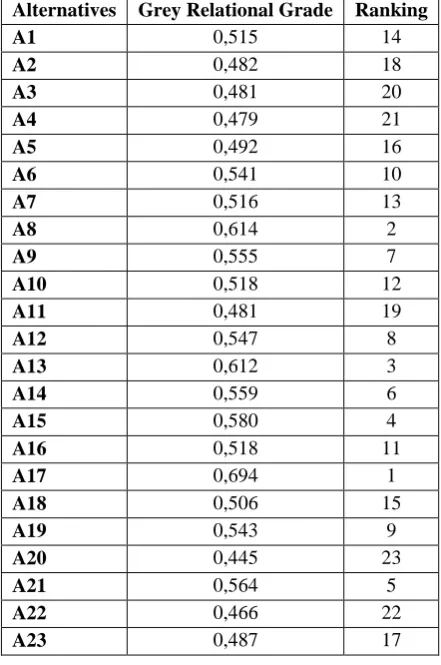
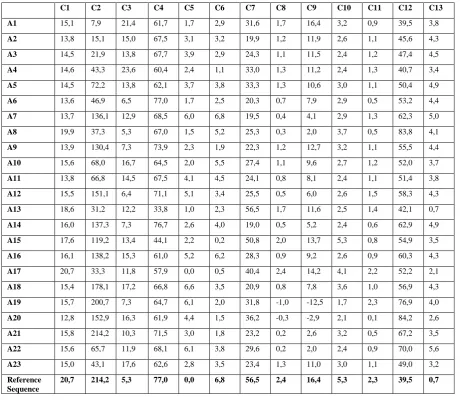
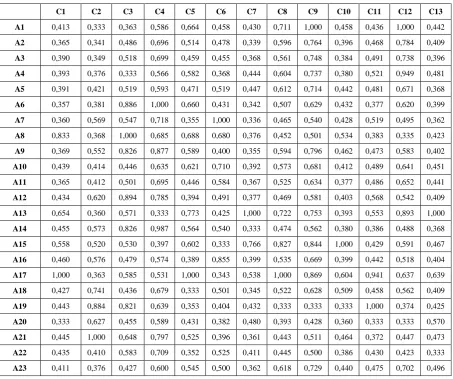
Next phase continues with the GRA method for ranking the alternative banks. The dataset for the alternatives and criteria as well as the reference sequence is given in Table 3a in appendix. The reference sequences for the variables have been appointed in the constraints of C5, C12, and C13 should be minimized while the others should be maximized (see Table 3a). In the following steps of GRA, the normalized values and deviation sequences have been employed to measure the grey relational coefficients (see Table 4a, in the appendix). The last step of the GRA method is to calculate the weighted coefficients for ranking alternatives. For this purpose, Grey relational grade has been calculated by multiplying the weights of the criteria and the values of the coefficients. Table 7 represents the weighted scores defining the grey relational grade.
Table 7: Grey Relational Grade and Ranking Results Alternatives Grey Relational Grade Ranking
A1 0,515 14
A2 0,482 18
A3 0,481 20
A4 0,479 21
A5 0,492 16
A6 0,541 10
A7 0,516 13
A8 0,614 2
A9 0,555 7
A10 0,518 12
A11 0,481 19
A12 0,547 8
A13 0,612 3
A14 0,559 6
A15 0,580 4
A16 0,518 11
A17 0,694 1
A18 0,506 15
A19 0,543 9
A20 0,445 23
A21 0,564 5
A22 0,466 22
A23 0,487 17
According to the Table 7, A17 has the best performance results in banking sector while A20 is the worst seat in the banks. It is understood that foreign banks have better performance while comparing with other types of the banks.
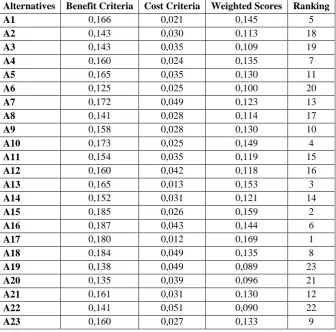
Another integrated multi-criteria decision-making approach is the DEMATEL-MOORA. This approach is divided into two main sections. In the first stage, the DEMATEL method has been adapted in the same steps in the second integrated methodology. That is why same weights have been considered in the remaining steps.
assumptions regarding the criteria have been employed for calculating the benefit and cost criteria. Accordingly, weighted scores and final ranking results are obtained (see Table 7).
Table 8: Benefit and Cost Criteria and Ranking Results
Alternatives Benefit Criteria Cost Criteria Weighted Scores Ranking
A1 0,166 0,021 0,145 5
A2 0,143 0,030 0,113 18
A3 0,143 0,035 0,109 19
A4 0,160 0,024 0,135 7
A5 0,165 0,035 0,130 11
A6 0,125 0,025 0,100 20
A7 0,172 0,049 0,123 13
A8 0,141 0,028 0,114 17
A9 0,158 0,028 0,130 10
A10 0,173 0,025 0,149 4
A11 0,154 0,035 0,119 15
A12 0,160 0,042 0,118 16
A13 0,165 0,013 0,153 3
A14 0,152 0,031 0,121 14
A15 0,185 0,026 0,159 2
A16 0,187 0,043 0,144 6
A17 0,180 0,012 0,169 1
A18 0,184 0,049 0,135 8
A19 0,138 0,049 0,089 23
A20 0,135 0,039 0,096 21
A21 0,161 0,031 0,130 12
A22 0,141 0,051 0,090 22
A23 0,160 0,027 0,133 9
Table 9: Comparative analysis results of the integrated models DEMATEL-GRA DEMATEL-MOORA
Alternatives Scores Ranking Scores Ranking
A1 0,515 14 0,145 5
A2 0,482 18 0,113 18
A3 0,481 20 0,109 19
A4 0,479 21 0,135 7
A5 0,492 16 0,130 11
A6 0,541 10 0,100 20
A7 0,516 13 0,123 13
A8 0,614 2 0,114 17
A9 0,555 7 0,130 10
A10 0,518 12 0,149 4
A11 0,481 19 0,119 15
A12 0,547 8 0,118 16
A13 0,612 3 0,153 3
A14 0,559 6 0,121 14
A15 0,580 4 0,159 2
A16 0,518 11 0,144 6
A17 0,694 1 0,169 1
A18 0,506 15 0,135 8
A19 0,543 9 0,089 23
A20 0,445 23 0,096 21
A21 0,564 5 0,130 12
A22 0,466 22 0,090 22
A23 0,487 17 0,133 9
6. Discussion and Conclusion
Performance measurement of the banking sector remains a prominent issue in the competitive financial markets. There are several methods and variables to evaluate the banks and make a right decision on the investment. By the way, some debates consider the lack of the multidimensional effects while many set aside the knowledge extraction-based decision making approaches. That is the reason why data mining methods recently arise as important techniques that should be combined with the different kinds of decision-making methods. Financial decision-making needs for the multidimensional comparison including the interdependencies together with text mining approach whereas the most studies in finance commonly do not care the different effects for the investment decisions expect the financial data. Financial topic with text mining is still one of outstanding issues in knowledge extraction-based modeling. Thus, fuzzy based modeling using the integrated text mining method could be useful for further studies.
properly in the multidimensional decision-making. Finally, the method could be extended by using different kinds of multi-criteria decision-making models and several data mining processes such as web mining could be added for the comprehensive analysis. Another important conclusion of this study is that foreign banks have better performance than state and private banks.
References
Ahmadi, H. B., Petrudi, S. H. H., & Wang, X. (2016). Integrating sustainability into supplier selection with analytical hierarchy process and improved grey relational analysis: a case of telecom industry. The International Journal of Advanced Manufacturing Technology, 9(90), 2413-2427.
Akhigbe, A., McNulty, J. E., & Stevenson, B. A. (2017a). Additional evidence on transparency and bank financial performance. Review of Financial Economics, 32, 1-6. doi:10.1016/j.rfe.2016.09.001
Akhigbe, A., McNulty, J. E., & Stevenson, B. A. (2017b). Does the form of ownership affect firm performance? Evidence from US bank profit efficiency before and during the financial crisis. The Quarterly Review of Economics and Finance, 64, 120-129. doi:10.1016/j.qref.2016.07.015
Akkaya, G., Turanoğlu, B., & Öztaş, S. (2015). An integrated fuzzy AHP and fuzzy MOORA approach to the problem of industrial engineering sector choosing. Expert Systems with Applications, 42(24), 9565-9573. doi:10.1016/j.eswa.2015.07.061
Aktaş, H., & Kargın, M. (2007). Türk bankacılık sektöründeki yabancı ve ulusal bankaların finansal oranlar açısından karşılaştırılması. Yönetim ve Ekonomi, 14(2), 31-45.
Ali, M., & Azmi, W. (2016). Religion in the boardroom and its impact on Islamic banks' performance. Review of Financial Economics, 31, 83-88. doi:10.1016/j.rfe.2016.08.001 Bacudio, L. R., Benjamin, M. F. D., Eusebio, R. C. P., Holaysan, S. A. K., Promentilla, M. A. B.,
Yu, K. D. S., & Aviso, K. B. (2016). Analyzing barriers to implementing industrial symbiosis networks using DEMATEL. Sustainable Production and Consumption, 7, 57-65. doi:10.1016/j.spc.2016.03.001
Bayramoglu, M. F., & Hamzacebi, C. (2016). Stock Selection Based on Fundamental Analysis Approach by Grey Relational Analysis: A Case of Turkey. International Journal of Economics and Finance, 8(7), 178-184. doi:10.5539/ijef.v8n7p178
Berger, A. N., Hasan, I., & Zhou, M. (2010). The effects of focus versus diversification on bank performance: Evidence from Chinese banks. Journal of Banking & Finance, 34(7), 1417-1435. doi:10.1016/j.jbankfin.2010.01.010
Bian, W., & Deng, C. (2017). Ownership dispersion and bank performance: Evidence from China. Finance Research Letters. doi:10.1016/j.frl.2016.12.030
Bitar, M., Saad, W., & Benlemlih, M. (2016). Bank risk and performance in the MENA region: The importance of capital requirements. Economic Systems, 40(3), 398-421. doi:10.1016/j.ecosys.2015.12.001
Boubakri, N., Mirzaei, A., & Samet, A. (2017). National culture and bank performance: Evidence from the recent financial crisis. Journal of Financial Stability, 29, 36-56. doi:10.1016/j.jfs.2017.02.003
Brauers, W.K.M. and Zavadskas, E.K. (2006). The MOORA Method and Its Application to Privatization in a Transition Economy. Control and Cybernetics, 35, 445-469.
Büyüközkan, G., Güleryüz, S., & Karpak, B. (2017). A new combined IF-DEMATEL and IF-ANP approach for CRM partner evaluation. International Journal of Production Economics, 191, 194-206. doi:10.1016/j.ijpe.2017.05.012
Cai, W., Xu, F., & Zeng, C. (2016). Geographical diversification and bank performance: Evidence from China. Economics Letters, 147, 96-98. doi:10.1016/j.econlet.2016.08.022
Carvallo, O., & Kasman, A. (2017). Convergence in bank performance: Evidence from Latin American banking. The North American Journal of Economics and Finance, 39, 127-142. doi:10.1016/j.najef.2016.08.002
Chai, B. B. H., Tan, P. S., & Goh, T. S. (2016). Banking services that influence the bank performance. Procedia-Social and Behavioral Sciences, 224, 401-407. doi:10.1016/j.sbspro.2016.05.405
Chen, I. S. (2016). A combined MCDM model based on DEMATEL and ANP for the selection of airline service quality improvement criteria: A study based on the Taiwanese airline industry. Journal of Air Transport Management, 57, 7-18. doi:10.1016/j.jairtraman.2016.07.004 Cornett, M. M., Erhemjamts, O., & Tehranian, H. (2016). Greed or good deeds: An examination of
the relation between corporate social responsibility and the financial performance of US commercial banks around the financial crisis. Journal of Banking & Finance, 70, 137-159. doi:10.1016/j.jbankfin.2016.04.024
Çinko, M., & Avcı, E. (2008). CAMELS Derecelendirme Sistemi ve Türk Ticari Bankacılık Sektöründe Başarısızlık Tahmini. BDDK Bankacılık ve Finansal Piyasalar Dergisi, 2(2), 25-48.
Davydenko, A. (2010). Determinants of bank profitability in Ukraine. Undergraduate Economic Review, 7(1), Article 2.
de Bandt, O., Camara, B., Maitre, A., & Pessarossi, P. (2017). Optimal capital, regulatory requirements and bank performance in times of crisis: Evidence from France. Journal of Financial Stability
Gerhardt, M., & Vander Vennet, R. (2016). Bank bailouts in Europe and bank performance. Finance Research Letters.
Deng, J. (1982). Control problems of grey systems. Systems & Control Letters, 1(5), 288-294. doi:10.1016/S0167-6911(82)80025-X
Dong, Y., Firth, M., Hou, W., & Yang, W. (2016). Evaluating the performance of Chinese commercial banks: A comparative analysis of different types of banks. European Journal of Operational Research, 252(1), 280-295. doi:10.1016/j.ejor.2015.12.038
Fukuyama, H., & Matousek, R. (2017). Modeling bank performance: A network DEA approach. European Journal of Operational Research, 259(2), 721-732. doi:10.1016/j.ejor.2016.10.044 Ghosh, A. (2016). Banking sector globalization and bank performance: A comparative analysis of
low income countries with emerging markets and advanced economies. Review of Development Finance, 6(1), 58-70. doi:10.1016/j.rdf.2016.05.003
Jawadi, F., Jawadi, N., Cheffou, A. I., Ameur, H. B., & Louhichi, W. (2017). Modelling the effect of the geographical environment on Islamic banking performance: A panel quantile regression analysis. Economic Modelling. doi:10.1016/j.econmod.2017.01.018
Juo, J. C., Fu, T. T., Yu, M. M., & Lin, Y. H. (2016). Non-radial profit performance: An application to Taiwanese banks. Omega, 65, 111-121. doi:10.1016/j.omega.2016.01.003
Kabak, M., & Dağdeviren, M. (2017). A hybrid approach based on ANP and grey relational analysis for machine selection. Tehnički vjesnik, 24(Supplement 1), 109-118.
King, T., Srivastav, A., & Williams, J. (2016). What's in an education? Implications of CEO education for bank performance. Journal of Corporate Finance, 37, 287-308. doi:10.1016/j.jcorpfin.2016.01.003
Kutan, A. M., Ozsoz, E., & Rengifo, E. W. (2012). Cross-sectional determinants of bank performance under deposit dollarization in emerging markets. Emerging Markets Review, 13(4), 478-492. doi:10.1016/j.ememar.2012.07.003
Li, W., Li, Y., & Tang, C. (2016). Web Service Selection Method Based on Grey Relational Analysis. International Journal of Hybrid Information Technology, 9(3), 117-124. doi:10.14257/ijhit.2016.9.3.11
Luthra, S., Govindan, K., & Mangla, S. K. (2017). Structural model for sustainable consumption and production adoption—A grey-DEMATEL based approach. Resources, Conservation and Recycling, 125, 198-207. doi:10.1016/j.resconrec.2017.02.018
Mamatzakis, E., & Bermpei, T. (2016). What is the effect of unconventional monetary policy on bank performance?. Journal of International Money and Finance, 67, 239-263. doi:10.1016/j.jimonfin.2016.05.005
Mavi, R. K., Goh, M., & Zarbakhshnia, N. (2017). Sustainable third-party reverse logistic provider selection with fuzzy SWARA and fuzzy MOORA in plastic industry. The International Journal of Advanced Manufacturing Technology, 1-18. doi:10.1007/s00170-016-9880-x Meles, A., Porzio, C., Sampagnaro, G., & Verdoliva, V. (2016). The impact of the intellectual capital
efficiency on commercial banks performance: Evidence from the US. Journal of Multinational Financial Management, 36, 64-74. doi:10.1016/j.mulfin.2016.04.003
Mirzaei, A., & Moore, T. (2016). Banking performance and industry growth in an oil-rich economy: Evidence from Qatar. The Quarterly Review of Economics and Finance, 60, 58-69. doi:10.1016/j.qref.2015.06.001
Oktar, S., & Yüksel, S. (2016). Bankalarin Türev Ürün Kullanimini Etkileyen Faktörler: Mars Yöntemi ile Bir Inceleme/Determinants of the Use Derivatives in Banking: An Analysis with MARS Model. Finans Politik & Ekonomik Yorumlar, 53(620), 31-46.
Psillaki, M., & Mamatzakis, E. (2017). What drives bank performance in transitions economies? The impact of reforms and regulations. Research in International Business and Finance, 39, 578-594. doi:10.1016/j.ribaf.2016.09.010
Salim, R., Arjomandi, A., & Seufert, J. H. (2016). Does corporate governance affect Australian banks' performance?. Journal of International Financial Markets, Institutions and Money, 43, 113-125. doi:10.1016/j.intfin.2016.04.006
Saghi-Zedek, N. (2016). Product diversification and bank performance: does ownership structure matter?. Journal of Banking & Finance, 71, 154-167. doi:10.1016/j.jbankfin.2016.05.003 Sarı, T., Baynal, K., & Ergül, Ö. (2016). Supplier Selection with Grey Relational Analysis.
International Journal of Emerging Research in Management & Technology, 5, 61-70. Scott, S. V., Van Reenen, J., & Zachariadis, M. (2017). The long-term effect of digital innovation on
bank performance: an empirical study of SWIFT adoption in financial services. Research Policy, 46(5), 984-1004. doi:10.1016/j.respol.2017.03.010
Seyrek, İ. H., & Ata, H. A. (2010). Veri Zarflama Analizi ve Veri Madenciliği ile Mevduat Bankalarında Etkinlik Ölçümü. Journal of BRSA Banking & Financial Markets, 4(2), 67-84. Shaban, M., & James, G. A. (2017). The effects of ownership change on bank performance and risk
exposure: Evidence from Indonesia. Journal of Banking & Finance.
Sun, L., & Chang, T. P. (2011). A comprehensive analysis of the effects of risk measures on bank efficiency: Evidence from emerging Asian countries. Journal of Banking & Finance, 35(7), 1727-1735. doi:10.1016/j.jbankfin.2010.11.017
Sun, P. H., Mohamad, S., & Ariff, M. (2017). Determinants driving bank performance: A comparison of two types of banks in the OIC. Pacific-Basin Finance Journal, 42, 193-203. doi:10.1016/j.pacfin.2016.02.007
Supeekit, T., Somboonwiwat, T., & Kritchanchai, D. (2016). DEMATEL-modified ANP to evaluate internal hospital supply chain performance. Computers & Industrial Engineering, 102, 318-330. doi:10.1016/j.cie.2016.07.019
Yüksel, S. (2017). Determinants of the Credit Risk in Developing Countries After Economic Crisis: A Case of Turkish Banking Sector. In Global Financial Crisis and Its Ramifications on Capital Markets (pp. 401-415). Springer International Publishing. doi:10.1007/978-3-319-47021-4_28
Yüksel, S., Dincer, H., & Hacioglu, U. (2015). CAMELS-based Determinants for the Credit Rating of Turkish Deposit Banks. International Journal of Finance & Banking Studies, 4(4), 1-17. Yüksel, S., & Zengin, S. (2017). Influencing Factors of Net Interest Margin in Turkish Banking
Sector. International Journal of Economics and Financial Issues, 7(1), 178-191.
APPENDIX A
Table 1a: Direct relationship matrix
C1 C2 C3 C4 C5 C6 C7 C8 C9 C10 C11 C12 C13
C1 0 0 0 0 0 1 0 0 0 0 0 0 0
C2 1 0 1 2 0 3 1 1 1 0 0 0 2
C3 0 0 0 0 0 1 0 0 0 0 0 0 0
C4 0 0 0 0 0 0 0 0 0 0 0 0 0
C5 1 0 1 2 0 3 1 1 1 0 0 0 2
C6 0 0 0 0 0 0 0 0 0 0 0 0 0
C7 0 0 0 1 0 1 0 0 0 0 0 0 0
C8 0 0 0 1 0 2 0 0 0 0 0 0 1
C9 0 0 0 1 0 1 0 0 0 0 0 0 1
C10 1 0 2 3 0 4 1 1 1 0 0 1 2
C11 1 0 1 2 0 3 1 0 1 0 0 0 1
C12 0 0 1 1 0 2 0 0 0 0 0 0 1
C13 0 0 0 0 0 1 0 0 0 0 0 0 0
Table 2a: Normalized direct relationship matrix
C1 C2 C3 C4 C5 C6 C7 C8 C9 C10 C11 C12 C13
C1 0,000 0,000 0,000 0,000 0,000 0,063 0,000 0,000 0,000 0,000 0,000 0,000 0,000
C2 0,063 0,000 0,063 0,125 0,000 0,188 0,063 0,063 0,063 0,000 0,000 0,000 0,125
C3 0,000 0,000 0,000 0,000 0,000 0,063 0,000 0,000 0,000 0,000 0,000 0,000 0,000
C4 0,000 0,000 0,000 0,000 0,000 0,000 0,000 0,000 0,000 0,000 0,000 0,000 0,000
C5 0,063 0,000 0,063 0,125 0,000 0,188 0,063 0,063 0,063 0,000 0,000 0,000 0,125
C6 0,000 0,000 0,000 0,000 0,000 0,000 0,000 0,000 0,000 0,000 0,000 0,000 0,000
C7 0,000 0,000 0,000 0,063 0,000 0,063 0,000 0,000 0,000 0,000 0,000 0,000 0,000
C8 0,000 0,000 0,000 0,063 0,000 0,125 0,000 0,000 0,000 0,000 0,000 0,000 0,063
C9 0,000 0,000 0,000 0,063 0,000 0,063 0,000 0,000 0,000 0,000 0,000 0,000 0,063
C10 0,063 0,000 0,125 0,188 0,000 0,250 0,063 0,063 0,063 0,000 0,000 0,063 0,125
C11 0,063 0,000 0,063 0,125 0,000 0,188 0,063 0,000 0,063 0,000 0,000 0,000 0,063
C12 0,000 0,000 0,063 0,063 0,000 0,125 0,000 0,000 0,000 0,000 0,000 0,000 0,063
Table 3a: Dataset and Reference Sequence
C1 C2 C3 C4 C5 C6 C7 C8 C9 C10 C11 C12 C13 A1 15,1 7,9 21,4 61,7 1,7 2,9 31,6 1,7 16,4 3,2 0,9 39,5 3,8
A2 13,8 15,1 15,0 67,5 3,1 3,2 19,9 1,2 11,9 2,6 1,1 45,6 4,3
A3 14,5 21,9 13,8 67,7 3,9 2,9 24,3 1,1 11,5 2,4 1,2 47,4 4,5
A4 14,6 43,3 23,6 60,4 2,4 1,1 33,0 1,3 11,2 2,4 1,3 40,7 3,4
A5 14,5 72,2 13,8 62,1 3,7 3,8 33,3 1,3 10,6 3,0 1,1 50,4 4,9
A6 13,6 46,9 6,5 77,0 1,7 2,5 20,3 0,7 7,9 2,9 0,5 53,2 4,4
A7 13,7 136,1 12,9 68,5 6,0 6,8 19,5 0,4 4,1 2,9 1,3 62,3 5,0
A8 19,9 37,3 5,3 67,0 1,5 5,2 25,3 0,3 2,0 3,7 0,5 83,8 4,1
A9 13,9 130,4 7,3 73,9 2,3 1,9 22,3 1,2 12,7 3,2 1,1 55,5 4,4
A10 15,6 68,0 16,7 64,5 2,0 5,5 27,4 1,1 9,6 2,7 1,2 52,0 3,7
A11 13,8 66,8 14,5 67,5 4,1 4,5 24,1 0,8 8,1 2,4 1,1 51,4 3,8
A12 15,5 151,1 6,4 71,1 5,1 3,4 25,5 0,5 6,0 2,6 1,5 58,3 4,3
A13 18,6 31,2 12,2 33,8 1,0 2,3 56,5 1,7 11,6 2,5 1,4 42,1 0,7
A14 16,0 137,3 7,3 76,7 2,6 4,0 19,0 0,5 5,2 2,4 0,6 62,9 4,9
A15 17,6 119,2 13,4 44,1 2,2 0,2 50,8 2,0 13,7 5,3 0,8 54,9 3,5
A16 16,1 138,2 15,3 61,0 5,2 6,2 28,3 0,9 9,2 2,6 0,9 60,3 4,3
A17 20,7 33,3 11,8 57,9 0,0 0,5 40,4 2,4 14,2 4,1 2,2 52,2 2,1
A18 15,4 178,1 17,2 66,8 6,6 3,5 20,9 0,8 7,8 3,6 1,0 56,9 4,3
A19 15,7 200,7 7,3 64,7 6,1 2,0 31,8 -1,0 -12,5 1,7 2,3 76,9 4,0
A20 12,8 152,9 16,3 61,9 4,4 1,5 36,2 -0,3 -2,9 2,1 0,1 84,2 2,6
A21 15,8 214,2 10,3 71,5 3,0 1,8 23,2 0,2 2,6 3,2 0,5 67,2 3,5
A22 15,6 65,7 11,9 68,1 6,1 3,8 29,6 0,2 2,0 2,4 0,9 70,0 5,6
A23 15,0 43,1 17,6 62,6 2,8 3,5 23,4 1,3 11,0 3,0 1,1 49,0 3,2
Reference Sequence
Table 4a: Grey Relational Coefficients
C1 C2 C3 C4 C5 C6 C7 C8 C9 C10 C11 C12 C13 A1 0,413 0,333 0,363 0,586 0,664 0,458 0,430 0,711 1,000 0,458 0,436 1,000 0,442
A2 0,365 0,341 0,486 0,696 0,514 0,478 0,339 0,596 0,764 0,396 0,468 0,784 0,409
A3 0,390 0,349 0,518 0,699 0,459 0,455 0,368 0,561 0,748 0,384 0,491 0,738 0,396
A4 0,393 0,376 0,333 0,566 0,582 0,368 0,444 0,604 0,737 0,380 0,521 0,949 0,481
A5 0,391 0,421 0,519 0,593 0,471 0,519 0,447 0,612 0,714 0,442 0,481 0,671 0,368
A6 0,357 0,381 0,886 1,000 0,660 0,431 0,342 0,507 0,629 0,432 0,377 0,620 0,399
A7 0,360 0,569 0,547 0,718 0,355 1,000 0,336 0,465 0,540 0,428 0,519 0,495 0,362
A8 0,833 0,368 1,000 0,685 0,688 0,680 0,376 0,452 0,501 0,534 0,383 0,335 0,423
A9 0,369 0,552 0,826 0,877 0,589 0,400 0,355 0,594 0,796 0,462 0,473 0,583 0,402
A10 0,439 0,414 0,446 0,635 0,621 0,710 0,392 0,573 0,681 0,412 0,489 0,641 0,451
A11 0,365 0,412 0,501 0,695 0,446 0,584 0,367 0,525 0,634 0,377 0,486 0,652 0,441
A12 0,434 0,620 0,894 0,785 0,394 0,491 0,377 0,469 0,581 0,403 0,568 0,542 0,409
A13 0,654 0,360 0,571 0,333 0,773 0,425 1,000 0,722 0,753 0,393 0,553 0,893 1,000
A14 0,455 0,573 0,826 0,987 0,564 0,540 0,333 0,474 0,562 0,380 0,386 0,488 0,368
A15 0,558 0,520 0,530 0,397 0,602 0,333 0,766 0,827 0,844 1,000 0,429 0,591 0,467
A16 0,460 0,576 0,479 0,574 0,389 0,855 0,399 0,535 0,669 0,399 0,442 0,518 0,404
A17 1,000 0,363 0,585 0,531 1,000 0,343 0,538 1,000 0,869 0,604 0,941 0,637 0,639
A18 0,427 0,741 0,436 0,679 0,333 0,501 0,345 0,522 0,628 0,509 0,458 0,562 0,409
A19 0,443 0,884 0,821 0,639 0,353 0,404 0,432 0,333 0,333 0,333 1,000 0,374 0,425
A20 0,333 0,627 0,455 0,589 0,431 0,382 0,480 0,393 0,428 0,360 0,333 0,333 0,570
A21 0,445 1,000 0,648 0,797 0,525 0,396 0,361 0,443 0,511 0,464 0,372 0,447 0,473
A22 0,435 0,410 0,583 0,709 0,352 0,525 0,411 0,445 0,500 0,386 0,430 0,423 0,333
Table 5a: Dimensionless Number for MOORA Analysis