Emilia Irzmańska
1, Magdalena Charłusz
2, Jolanta Kujawa
2, Jan Kowalski
3,
Lucjan Pawlicki
3, Robert Irzmański
2Using Impedance Plethysmography
to Evaluate Antidecubital Underlay Systems
for Chronically Immobilized Patients*
Zastosowanie pletyzmografii impedancyjnej do oceny
podłoży przeciwodleżynowych u chorych przewlekle unieruchomionych
1 Department of Personal Protective Equipment, Central Institute for Labour Protection, National Research
Institute, Warszawa, Poland
2 Laboratory of Ergonomics and Exercise Physiology, Medical University of Lodz, Łódź, Poland
3 Clinic of Internal Diseases and Cardiological Rehabilitation, Medical University of Lodz, Łódź, Poland
Abstract
Background. Recently more and more attention has been paid to the design of variable-geometry mattresses that provide
differentiated pressure on the skin. However, the mattress is only one component of an antidecubital underlay system, and it is the bed sheets that come into direct contact with the patient’s skin. It therefore seems that the properties of the bed sheet fabric – the layer in direct contact with the skin – resulting from the type of fibers used, their spatial layout in the fabric structure and the type of contact with the patient’s body (point contact or continuous contact) are of significance in the prevention of skin lesions. The use of fibers with varying degrees of water absorbency – both hydrophilic and hydro-phobic fibers, with the hydrohydro-phobic layer directly under the skin of a person who is immobilized long-term – may help to stabilize heat distribution and humidity when the thermoregulation mechanism is disrupted. It may also improve the efficacy of vascular perfusion in areas at the highest risk of decubitus ulceration.
Objectives. To evaluate impedance plethysmography as a method of assessing local blood flow in areas at risk of
decubitus ulcer formation in chronically immobilized persons.
Material and Methods. The study involved 47 people. The examinations were performed in four groups and two
subgroups of patients. The used antidecubital underlay systems were modified, using bed sheets of corrugated fabric in group 2 and subgroup 2a, while in group 3 and subgroup 3a, bed sheets with satin weave were used. In Group 4, traditional cotton bed sheets with linen weave were used. The method of impedance pletismography was applied for evaluation of local blood flow changes in areas at high risk of decubital ulceration development in chroni-cally immobilised patients with normal and increased body temperature. Tissue blood flow changes were measured, following the procedure, described in the instruction manual of the used Niccomo monitor (Medis, Germany), designed for evaluation of haemodynamic parameters by the method of impedance cardiography with an adapter for plethysmographic measurements. Taking into account the available parameters, the selection for evaluation included those which were reflected by the plethysmographic curve, drawn by the monitor for the examined area in an on-line examination mode.
Results and Conclusions. The study shows that using impedance plethysmography to evaluate local blood flow
changes in chronically immobilized patients is a useful method for precise and repeatable monitoring of flow parameters in the area under examination. It also serves to prompt appropriate prevention activities and the prepa-ration of anti-decubitus underlay structures at the early stages of skin lesion formation in patients who are
bedrid-den long-term with restricted body positions (Adv Clin Exp Med 2010, 19, 5, 637–651).
Key words: anti-decubitus underlay system, bed sheets, hydrophilic and hydrophobic fibers, impedance
plethys-mography, evaluation of local blood flow changes. Adv Clin Exp Med 2010, 19, 5, 637–651
ISSN 1230-025X
oRIGINAL PAPERS
© Copyright by Wroclaw Medical University
Skin lesions observed in chronically immobi-lized persons – both superficial ones, such as skin abrasions or erythemas (i.e., reactive hyperaemias) and internal ones,such as ischemia and/or tissue necrosis with progressive compression of local vas-cular systems – lead to the formation of decubitus ulcers [1]. The common factor in skin lesions that are defined as decubitus ulcerations or compres-sion ulcers is local tissue disorder that occurs after a period of chronic ischemia [2, 3].
Among the important external factors initi-ating decubitus ulcer formation are variations in average skin temperature and humidity, associated with thermoregulatory disruption in the organism as a result of long-term motor inactivity. The actual status of the disorders mentioned depends largely on the properties of the antidecubital underlay systems used [4, 5], because in chronically immo-bilized patients, the efficiency of heat distribution is closely associated not only with perspiration rate and external conditions, but also with the efficacy of the local vascular system, which is responsible for heat transfer from the muscles to the skin [6]. Therefore, evaluation of the local circulation sta-tus in areas at risk of decubista-tus ulcer development – i.e., in the most protruding anatomical parts, for example, the sacral bone region – is quite
use-ful for the preliminary identification of processes conducive to decubitus ulcer development.
In recent years, more and more attention has been paid to the design of variable-geometry mattresses that provide differentiated pressure on the skin. However, the mattress is only one com-ponent of an antidecubital underlay system, and it is the bed sheets that come into direct contact with the patient’s skin. It therefore seems that the properties of the bed sheet fabric, resulting from the type of fibers used, their spatial layout in the fabric structure and the type of contact with the patient’s body (point contact or continuous con-tact), are of significance in the prevention of skin lesions [7].
The use of fibers with varying degrees of water absorbency – both hydrophilic and hydrophobic fibres, with different physical microstructures, mechanical durability and elasticity, with the hy-drophobic layer situated directly under the skin of a person immobilized long-term – may help to stabilize heat distribution and humidity when the thermoregulation mechanism is disrupted. It may also improve the efficacy of vascular perfusion in areas at the highest risk of decubitus ulceration [8]. The goal of this study was impedance pleth-ysmography as a method of assessing local blood
Streszczenie
Wprowadzenie. W ostatnich latach coraz większą wagę przywiązuje się do projektowania materacy o zmiennej
geometrii nacisku na skórę. Materac jest jednak jedną ze składowych podłoża przeciwodleżynowego, bezpośrednio bowiem ze skórą chorego styka się prześcieradło. Wydaje się, że właściwości tkaniny prześcieradłowej – warstwy ścisłego kontaktu ze skórą – związane z rodzajem użytych włókien, ich przestrzennym rozkładem w strukturze tka-niny oraz charakterem kontaktu z ciałem chorego – punktowym lub ciągłym, mają istotne znaczenie w zapobieganiu uszkodzeniom skóry. Zastosowanie włókien o zróżnicowanej zdolności do sorpcji wody – hydrofilowych, różniących się fizyczną mikrostrukturą i trwałością mechaniczną, oraz hydrofobowych o różnej budowie tworzywa i zróżnicowa-nej sprężystości, z usytuowaniem warstwy włókien hydrofobowych przy skórze osoby długotrwale unieruchomiozróżnicowa-nej, może mieć wpływ na stabilizację dystrybucji ciepła i wilgoci w zaburzonym mechanizmie termoregulacji. Może rów-nież poprawić sprawność perfuzji naczyniowej w obszarach największego ryzyka wystąpienia odleżyn.
Cel pracy. ocena przydatności pletyzmografii impedancyjnej jako metody badania zmian miejscowego przepływu krwi
w miejscu narażonym na powstanie odleżyn u chorych przewlekle unieruchomionych.
Materiał i metody. Materiał badań stanowiło 47 osób. Badania wykonano w czterech grupach i dwóch podgrupach
chorych. Podłoża przeciwodleżynowe zmodyfikowano, stosując odpowiednio w grupie 2 i podgrupie 2a przeście-radła z tkaniny gofrowanej, w grupie 3 i podgrupie 3a prześcieprzeście-radła o splocie atłasowym. W grupie 4 zastosowano tradycyjne prześcieradła bawełniane o splocie płóciennym. Do oceny zmian miejscowego przepływu krwi w obszarze dużego ryzyka powstawania odleżyn u chorych długotrwale unieruchomionych z normalną i podwyższoną tempera-turą ciała, zastosowano metodę pletyzmografii impedancyjnej. Pomiary zmian tkankowego przepływu krwi określo-no zgodnie z procedurą opisaną w instrukcji aparatu Niccomo – niemieckiej firmy Medis, do oceny parametrów hemodynamicznych metodą kardiografii impedancyjnej z przystawką do pomiarów pletyzmograficznych. Spośród dostępnych wskaźników do oceny wybrano te, które są opisane przez krzywą pletyzmograficzną wykreślaną przez urządzenie dla badanego obszaru w systemie on-line.
Wyniki i wnioski. Badania wykazały iż zastosowanie pletyzmografii impedancyjnej u chorych przewlekle
unieru-chomionych do oceny zmian miejscowego przepływu krwi pozwala na precyzyjne i powtarzalne monitorowanie wskaźników przepływu w badanym obszarze. Umożliwia także podejmowanie odpowiednich działań prewencyj-nych dotyczących konstrukcji podłoża przeciwodleżynowego na wczesnym etapie formowania zmian skórprewencyj-nych
u chorych, z różnych przyczyn pozostających przez dłuższy czas w łóżku w wymuszonej pozycji ciała (Adv Clin
Exp Med 2010, 19, 5, 637–651).
Słowa kluczowe: podłoże przeciwodleżynowe, pościel, włókna hydrofobowe i hydrofilowe, pletyzmografia
flow in areas at risk of decubitus ulcer formation in chronically immobilized persons.
Material and Methods
The impedance plethysmography method was used to evaluate local blood flow changes in ar-eas at high risk of decubitus ulcer development in chronically immobilized patients with normal and increased body temperature [9]. The study proto-col was approved by the Bioethical Commission of the Medical University in Łódź (Approval No. RNN/134/03/KB).
A Niccomo monitor (Medis, Germany), de-signed for the evaluation of hemodynamic pa-rameters by the impedance cardiography method, was used with an adapter for plethysmographic measurements. Tissue blood flow changes were measured following the procedure described in the instruction manual. This monitor uses its own algorithm, an integral part of its firmware, during both cardiographic and plethysmographic exami-nations.
The parameters selected for evaluation in-cluded those reflected by the plethysmographic curve drawn by the monitor for the area examined in an on-line examination mode. on this curve, an ascending (anacrotic) arm is visible, rising steeply – almost vertically – along with a descend-ing (catacrotic) arm slopdescend-ing gently from the wave crest downwards (Fig. 1a). Fairly often, a so-called dicrotic notch appears on the catacrotic arm with a subsequent small dicrotic wave, which occurs at the time of semilunar valve closure. Both the notch and the dicrotic wave may remain invisible on the
curves from blood flow records in peripheral arter-ies.
on the basis of the plethysmographic curve obtained, the following hemodynamic parameters were evaluated (see Fig. 1a, b):
– PAmpl (pulse wave amplitude) – PSlope (systolic slope)
– CT (crest time)
– PT (propagation time), measured from the beginning of the R wave of the ECG to the begin-ning of the systolic wave slope in the plethysmo-gram.
The examinations were performed in four groups and two subgroups of patients. The anti-decubital underlay systems used were varied: Bed sheets of corrugated fabric were used in groups 2 and 2a, while in groups 3 and 3a, bed sheets with a satin weave were used. In group 4, traditional cot-ton bed sheets with a linen weave were used. Four groups of patients with normal body temperature were identified: group 1 consisted of 14 subjects (10 male, 4 female) with a mean age of 60 years, hospitalized at the time of the examination, with-out any major limitation to motor ability; group 2 was made up of 12 subjects (7 male and 5 female) with a mean age of 62 years, chronically immo-bilized after ischemic stroke; group 3 consisted of 10 patients (6 male, 4 female) with a mean age of 61 years, chronically immobilized after ischemic stroke; group 4 comprised 11 patients (7 male, 4 female) with a mean age of 60 years, chronically immobilized after ischemic stroke;
In addition, two subgroups of patients with in-creased body temperature were identified: group 2a consisted of 4 patients (2 male, 2 female) with a mean age of 60 years, chronically immobilized after isch-emic stroke, in a subfebrile state and with a mean
Fig. 1. Impedance measurements of blood flow in the examined vascular area: (a) a schematic curve and (b) a
real-time presentation
Ryc. 1. Impedancyjny pomiar przepływu krwi w badanym obszarze naczyniowym; w ujęciu a) schematycznym –
krzy-wa i b) rzeczywistym
body temperature of 38.2oC; group 3a was made up of 3 patients (1 male, 3 female) with a mean age of 59 years, chronically immobilized after ischemic stroke, with a mean body temperature of 37.9oC.
Taking into account the horizontal body po-sition of the patients during hospitalization, the longest contact with decubitus-ulcer-inducing factors was in the region of the caudal bone, so a 4-electrode monitoring system was applied in that region. one of the two electrodes conduct-ing high-frequency signals (black) was attached on the thigh, and the second one in the region of the distal thoracic vertebrae, while the measuring electrodes (yellow) were placed in the region of the caudal bone (Fig. 2).
In groups 1–4, the examinations were per-formed once daily for seven days between 7:00
Fig. 2. The layout of the measuring electrodes on the
patient’s body surface during an examination. The elec-trodes are attached in the vicinity of the caudal bone
Ryc. 2. Układ elektrod pomiarowych na powierzchni ciała
pacjenta w obrębie kości ogonowej podczas badania
Fig. 3. An incidental crease in bed-sheet fabric results in blood vessel compression, suppressing blood flow
in the subcutaneous layer, d – fabric length, N – compression force
Ryc. 3. Przypadkowe zagniecenie tkaniny prześcieradłowej, powodując kompresję naczynia krwionośnego
ograniczającą przepływ krwi w warstwie podskórnej, d – długość tkaniny, N – siła nacisku an incidental crease in a flat bed sheet structure
przypadkowy załamek (zagniecenie) na płaskiej strukturze
small skin blood vessels małe naczynie krwionośne skóry turbulent blood/flow
przepływ krwi burzliwy laminar blood flow
przepływ krwi warstwowy (laminarny)
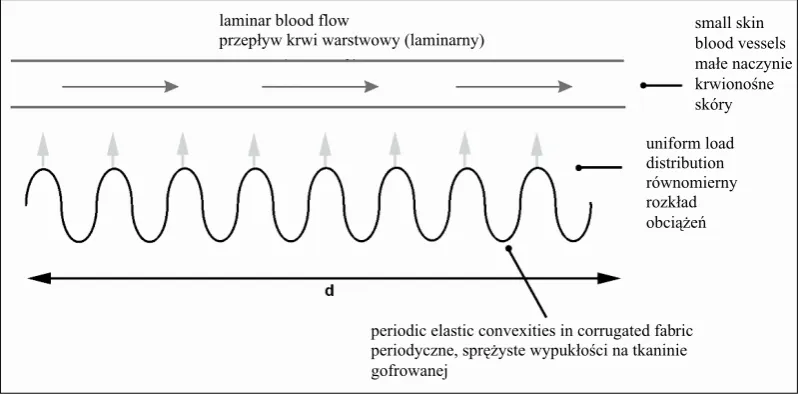
Fig. 4. Theperiodic elastic convexities in corrugated fabric result in adaptive blood vessel deformation, improving
blood flow in the subcutaneous layer, d – fabric length, N – compression force
Ryc. 4. Periodyczne sprężyste wypukłości tkaniny gofrowanej, powodujące adaptacyjną deformację naczynia
krwionośnego, usprawniającą przepływ krwi w warstwie podskórnej, d – długość tkaniny, N – siły nacisku periodic elastic convexities in corrugated fabric periodyczne, sprężyste wypukłości na tkaninie gofrowanej
uniform load distribution równomierny rozkład obciążeń laminar blood flow
and 8:00 in the morning, after at least seven hours of night rest in an air-conditioned hospital room with an air temperature of 21°C and relative hu-midity of 55%. In groups 2a and 3a, plethysmo-graphic evaluations of local circulation were per-formed on the third day of the examinations, from 8:00 a.m to 8:00 p.m.with the same temperature and relative humidity conditions. All the examina-tions were done by the same person. Patients with major cardiovascular defects and/or disseminated atherosclerosis were excluded from the study.
Statistical analysis of the results obtained was performed using the STATISTICA PL 5.1 software package, inputting the calculated median values of the studied variables and the standard deviations. Differences between the various study groups’ evaluated parameters were analysed by the ANo-VA test. In order to assess distribution normality, the distribution variance of the studied variables was evaluated by the Shapiro-Wilk test, and the homogeneity of variance by the F test. Then the analysis was continued for unpaired data by Stu-dent’s t test. Differences were regarded as statisti-cally significant when p < 0.05.
Results
Statistically significant differences in blood flow were observed at the region of high risk for decubitus ulcer development in the chronically immobilized patients using bed sheets made of the studied fabrics.
The results of the study for patients with
nor-mal body temperature using bed sheets of corru-gated fabric (group 2), satin fabric (group 3) and traditional (cotton) fabric (group 4) during seven days of hospitalization, considering four plethys-mographic parameters (PAmpl, PSlope, CT and PT), vs. the same values in the group of hospital-ized patients without any major limitations of mo-tor ability (group 1), were as follows:
– Regarding the PAmpl parameter, a statisti-cally significant difference was observed between the patients of group 1 and the patients of groups 2, 3 and 4. In groups 2 and 3, a statistically signifi-cant increase in the PAmpl parameter was noted on the fifth day of the study vs. group 4. During the subsequent two days of the study, significant differences were maintained between groups 2 & 3 and group 4 (p < 0.05). on the last day of the study, a statistically significant increase of the PAmpl parameter was observed in group 2 vs. group 3 (p < 0.05) (Tables 1 and 2; Fig. 5).
– Regarding the PSlope parameter, a statisti-cally significant difference was observed between the patients in group 1 and the patients in groups 2, 3 and 4. In groups 2 and 3, a statistically signifi-cant increase in the PSlope parameter was noted on the seventh (the last) day of the study vs. group 4 (p < 0.05). A statistically significant increase in the PSlope parameter was also observed in group 2 vs. group 3 (p < 0.05). (Tables 3 and 4; Fig. 6).
– With regard to the CT parameter, a statistical-ly significant difference was observed between the pa-tients in group 1 and the papa-tients in groups 2, 3 and 4. In groups 2 and 3, a statistically significant decrease of the CT parameter was noted on the fifth day of the
Table 1. PAmpl parameters [p.m] in groups 1, 2, 3 and 4
Tabela 1. Zestawienie wyników dla grup 1, 2, 3 i 4 badanych osób dotyczących parametru PAmpl [p.m]
Day 1 Day 2 Day 3 Day 4 Day 5 Day 6 Day 7
Group 1 0.856 ± 0.115 0.896 ± 0.118 0.903 ± 0.166 0.888 ± 0.168 0.890 ± 0.189 0.890 ± 0.100 0.942 ± 0.187 Group 2 0.661 ± 0.017 0.633 ± 0.010 0.667 ± 0.016 0.669 ± 0.016 0.691 ± 0.019 0.707 ± 0.029 0.741 ± 0.034 Group 3 0.652 ± 0.018 0.631 ± 0.007 0.654 ± 0.008 0.653 ± 0.012 0.678 ± 0.015 0.690 ± 0.020 0.711 ± 0.024 Group 4 0.646 ± 0.022 0.623 ± 0.029 0.656 ± 0.010 0.658 ± 0.019 0.595 ± 0.061 0.592 ± 0.051 0.556 ± 0.034
Table 2. Comparison of PAmpl parameters [p.m] in groups 1, 2, 3 and 4
Tabela 2. Porównanie uzyskanych wyników w grupach 1, 2, 3 i 4 badanych osób dotyczących parametru PAmpl [p.m]
Day 1 Day 2 Day 3 Day 4 Day 5 Day 6 Day 7
Gr1–Gr2 Gr1–Gr3 Gr1–Gr4 Gr2–Gr3 Gr2–Gr4 Gr3–Gr4
p < 0.05 p < 0.05 p < 0.05 p > 0.05 p > 0.05 p > 0.05
p < 0.05 p < 0.05 p < 0.05 p > 0.05 p > 0.05 p > 0.05
p < 0.05 p < 0.05 p < 0.05 p < 0.05 p > 0.05 p > 0.05
p < 0.05 p < 0.05 p < 0.05 p < 0.05 p > 0.05 p > 0.05
p < 0.05 p < 0.05 p < 0.05 p > 0.05 p < 0.05 p < 0.05
p < 0.05 p < 0.05 p < 0.05 p > 0.05 p < 0.05 p < 0.05
study vs. group 4. During the two subsequent days of the study, the significant differences between groups 2 & 3 and group 4 were maintained (p < 0.05). on the last day of the study, a statistically significant rise in the CT parameter was noted in Group 2 vs. group 3 (p < 0.05). (Tables 5 and 6; Fig. 7).
– As for the PT parameter, a statistically signifi-cant increase was noted in Group 4 on the sixth and seventh days of the study vs. groups 1, 2 and 3 (p < 0.05). However, no significant differences were noted between groups 2 and 3 with regard to the PT param-eter (p > 0.05). (Tables 7 and 8; Fig. 8)
The results for the patients with elevated body temperature during twelve hours of
hospitaliza-tion, considering four plethysmographic param-eters (PAmpl, PSlope, CT and PT) in patients with a mean body temperature of 38.2°C using bed sheets of corrugated fabric (group 2a) and those with a mean body temperature of 37.9°C using bed
sheets of satin fabric (group 3a) were as follows: – Regarding the PAmpl parameter, a statisti-cally significant increase was noted in the seventh hour of the observation in group 3a vs. group p2a (p < 0.05). (Table 9; Fig. 9).
– Regarding the PSlope parameter, a statisti-cally significant increase was noted in the seventh hour of the observation in group 3a vs. group 2a (p < 0.05) (Table 10; Fig. 10).
Fig. 5. Correlations observed in PAmpl parameters [p.m] in groups 1–4
Ryc. 5. Graficzne przedstawienie obserwowanych zależności dla grup 1–4 badanych osób dotyczących parametru
PAmpl [p.m]
group 1 – healthy subjects (fully mobile)/osoba zdrowa (poruszająca się)
group 2 – patients using corrugated bed sheets/chorzy użytkujący prześcieradła z tkanin gofrowanych group 3 – patients using satin bad sheets/chorzy użytkujący prześcieradła z tkanin atłasowych group 4 – patients using traditional bed sheets/chorzy użytkujący tradycyjne prześcieradła
days (from 1st to 7th)
pulse wave amplitude PAmpl [p.m] amplituda fali pulsu PAmpl [p.m]
Table 3. PSlope parameters [p.m/s] in groups 1, 2, 3 and 4
Tabela 3. Zestawienie wyników dla grup 1, 2, 3 i 4 badanych osób dotyczących parametru PSlope [p.m/s]
Day 1 Day 2 Day 3 Day 4 Day 5 Day 6 Day 7
Group 1 10.75 ± 1.09 10.90 ± 1.91 11.89 ± 1.44 10.47 ± 1.47 10.26 ± 1.18 10.30 ± 1.21 12.19 ± 1.10 Group 2 8.83 ± 0.33 8.47 ± 0.48 8.72 ± 0.42 8.84 ± 0.53 9.35 ± 0.78 9.37 ± 0.69 9.84 ± 0.89 Group 3 9.02 ± 0.35 8.56 ± 0.43 8.91 ± 0.40 8.79 ± 0.51 9.17 ± 0.38 9.21 ± 0.30 9.19 ± 0.36 Group 4 8.87 ± 0.25 8.49 ± 0.38 8.90 ± 0.38 8.80 ± 0.51 8.25 ± 0.75 8.01 ± 1.05 7.29 ± 0.51
Table 4. Comparison of PSlope parameters [p.m/s] in groups 1, 2, 3 and 4
Tabela 4. Porównanie uzyskanych wyników w grupach 1, 2, 3 i 4 badanych osób dotyczących parametru PSlope [p.m/s]
Day 1 Day 2 Day 3 Day 4 Day 5 Day 6 Day 7
Gr1–Gr2 Gr1–Gr3 Gr1–Gr4 Gr2–Gr3 Gr2–Gr4 Gr3–Gr4
p < 0.05 p < 0.05 p < 0.05 p > 0.05 p > 0.05 p > 0.05
p < 0.05 p < 0.05 p < 0.05 p > 0.05 p > 0.05 p > 0.05
p < 0.05 p < 0.05 p < 0.05 p > 0.05 p > 0.05 p > 0.05
p < 0.05 p < 0.05 p < 0.05 p > 0.05 p > 0.05 p > 0.05
p < 0.05 p < 0.05 p < 0.05 p > 0.05 p < 0.05 p < 0.05
p < 0.05 p < 0.05 p < 0.05 p > 0.05 p < 0.05 p < 0.05
Fig. 6. Correlations observed in PSlope parameters [p.m/s] in groups 1–4
Ryc. 6. Graficzne przedstawienie obserwowanych zależności dla grup 1–4 badanych osób dotyczących parametru
PSlope [p.m/s]
group 1 – healthy subjects (fully mobile)/osoba zdrowa (poruszająca się)
group 2 – patients using corrugated bed sheets /chorzy użytkujący prześcieradła z tkanin gofrowanych group 3 – patients using satin bad sheets/chorzy użytkujący prześcieradła z tkanin atłasowych group 4 – patients using traditional bed sheets/chorzy użytkujący tradycyjne prześcieradła systolic slope of pulse wave PSlope [p.m/s]
skurczowe nachylenie fali pulsu PSlope [p.m/s]
days (from 1st to 7th)
Table 5. CT parameters [ms] in groups 1, 2, 3 and 4
Tabela 5. Zestawienie wyników dla grup 1, 2, 3 i 4 badanych osób dotyczących parametru CT [ms]
Day 1 Day 2 Day 3 Day 4 Day 5 Day 6 Day 7
Group 1 138.80 ± 9.00 135.60 ± 12.74 133.80 ± 17.09 132.60 ± 8.72 135.90 ± 9.21 135.60 ± 8.82 132.50 ± 12.59 Group 2 159.83 ± 13.75 170.17 ± 16.63 158.08 ± 12.75 157.42 ± 14.41 148.17 ± 10.96 146.92 ± 11.32 142.83 ± 12.55 Group 3 165.40 ± 20.51 177.30 ± 23.72 164.20 ± 16.75 163.30 ± 14.86 156.10 ± 12.10 153.60 ± 13.08 147.70 ± 12.60 Group 4 172.10 ± 28.22 179.60 ± 30.74 168.10 ± 22.58 167.50 ± 20.40 183.20 ± 21.14 182.40 ± 23.17 206.30 ± 28.84
Table 6. Comparison of CT parameters [ms] in groups 1, 2, 3 and 4
Tabela 6. Porównanie uzyskanych wyników w grupach 1, 2, 3 i 4 badanych osób dotyczących parametru CT [ms]
Day 1 Day 2 Day 3 Day 4 Day 5 Day 6 Day 7
Gr1–Gr2 Gr1–Gr3 Gr1–Gr4 Gr2–Gr3 Gr2–Gr4 Gr3–Gr4
p < 0.05 p < 0.05 p < 0.05 p > 0.05 p > 0.05 p > 0.05
p < 0.05 p < 0.05 p < 0.05 p > 0.05 p > 0.05 p > 0.05
p < 0.05 p < 0.05 p < 0.05 p > 0.05 p > 0.05 p > 0.05
p < 0.05 p < 0.05 p < 0.05 p > 0.05 p > 0.05 p > 0.05
p < 0.05 p < 0.05 p < 0.05 p > 0.05 p < 0.05 p < 0.05
p < 0.05 p < 0.05 p < 0.05 p > 0.05 p < 0.05 p < 0.05
p > 0.05 p < 0.05 p < 0.05 p > 0.05 p < 0.05 p < 0.05
– With regard to the CT parameter, a statisti-cally significant decrease was noted in the seventh hour of the observation in group 3a vs. group 2a (p < 0.05) (Table 11; Fig. 11).
– No statistically significant changes were found in the PT parameter values during the 12-hour observation period in groups 2a and 3a (p > 0.05). (Table 12; Fig. 12).
Discussion
disorders in tissues exposed to long-term external pressure [12] depend largely on the type of contact between the underlay systems and the skin.
In the current study, in the findings for the groups of patients with normal body temperature using bed sheets manufactured of the fabrics stud-ied, statistically significant differences were ob-served in blood flow changes in the regions at risk for skin lesions. A significant progression in local circulation disturbances was noted in the group of patients using generally-available linen weave cot-ton bed sheets (group 4). In that group of patients,
perfusion disorders identified while observing the risk-affected region led to the observation period being limited to seven days for ethical reasons. on the fifth day, a significant decrease in the PAmpl parameter with CT time extension were observed, while the PSlope parameter significantly decreased on the seventh day. These results indicate a rapid rise in local circulation disorders in the area at high risk for decubitus ulceration. The result of propagation time analysis is another piece of evi-dence for the unfavorable character of the intra-vascular changes observed. on the sixth day of the
Fig. 7. Correlations observed in CT parameters [ms] in groups 1–4
Ryc. 7. Graficzne przedstawienie obserwowanych zależności dla grup 1–4 badanych osób dotyczących parametru CT [ms]
group 1 – healthy subjects (fully mobile)/osoba zdrowa (poruszająca się)
group 3 – patients using satin bad sheets/chorzy użytkujący prześcieradła z tkanin atłasowych group 4 – patients using traditional bed sheets/chorzy użytkujący tradycyjne prześcieradła
days (from 1st to 7th)
crest time CT [ms]
czas do szczytu fali CT [ms]
group 2 – patients using corrugated bed sheets/chorzy użytkujący prześcieradła z tkanin gofrowanych
Table 7. PT parameters [ms] in groups 1, 2, 3 and 4
Tabela 7. Zestawienie wyników dla grup 1, 2, 3 i 4 badanych osób dotyczących parametru PT [ms]
Day 1 Day 2 Day 3 Day 4 Day 5 Day 6 Day 7
Group 1 186.10 ± 21.29 187.90 ± 20.00 186.80 ± 17.42 189.90 ± 24.32 187.60 ± 18.30 191.70 ± 28.72 188.20 ± 24.27 Group 2 201.25 ± 12.17 201.33 ± 15.52 202.25 ± 18.30 203.42 ± 20.11 202.92 ± 16.12 202.42 ± 11.37 203.83 ± 13.09 Group 3 202.80 ± 12.48 203.30 ± 15.10 205.60 ± 15.11 203.50 ± 13.29 202.20 ± 15.02 205.10 ± 13.25 209.90 ± 35.71 Group 4 205.20 ± 14.19 204.30 ± 12.20 202.50 ± 11.70 202.10 ± 13.00 201.50 ± 15.68 214.40 ± 14.84 224.10 ± 12.90
Table 8. Comparison of PT parameters [ms] in groups 1, 2, 3 and 4
Tabela 8. Porównanie uzyskanych wyników w grupach 1, 2, 3 i 4 badanych osób dotyczących parametru PT [ms]
Day 1 Day 2 Day 3 Day 4 Day 5 Day 6 Day 7
Gr1–Gr2 Gr1–Gr3 Gr1–Gr4 Gr2–Gr3 Gr2–Gr4 Gr3–Gr4
p < 0.05 p < 0.05 p < 0.05 p > 0.05 p > 0.05 p > 0.05
p > 0.05 p > 0.05 p < 0.05 p > 0.05 p > 0.05 p > 0.05
p > 0.05 p < 0.05 p < 0.05 p > 0.05 p > 0.05 p > 0.05
p > 0.05 p > 0.05 p > 0.05 p > 0.05 p > 0.05 p > 0.05
p < 0.05 p > 0.05 p > 0.05 p > 0.05 p > 0.05 p > 0.05
p > 0.05 p > 0.05 p > 0.05 p > 0.05 p > 0.05 p > 0.05
study, the propagation time increased significantly in group 4 as compared to the other groups of tients in the study. This behaviour of the PT pa-rameter is associated with significant blood flow limitation.
on the other hand, in the patients using bed sheets made of specially designed fabrics (groups 2 and 3), key changes were recorded on approxi-mately the fifth day of the study. At that time, in both of these groups, a significant increase in the PAmpl parameter was observed, with simultane-ous CT reduction; and a significant increase in the PSlope parameter occurred on the seventh day of the study. This trend in the changes in the plethys-mographic parameters indicates progress towards blood flow normalization, following a period of insignificant disruption of hemodynamic balance observed in the studied area on the second day of the study. It should be emphasized that on the last day of the study, a particularly significant increase in the Pampl and PSlope parameter values was noted, along with CT reduction, in the group of patients, using bed sheets of satin-weave fabric.
It should also be noted that during the entire observation period, the mean propagation time did not change significantly in either group 2 or group 3. There was no significant difference noted between the PT parameter in either of these groups of patients (using corrugated-fabric bed sheets or bed sheets of satin-weave fabric) and the PT pa-rameter of the subjects with full motor ability, i.e., not bedridden. That fact confirms the effective pro-tection of local circulation provided by bed sheets made of the fabrics studied, particularly the corru-gated fabric.
Considering thesignificant differences in heat
and humidity transfer found in model studies of the fabrics used at temperature of 39.5°C, additional clinical studies were undertaken in two groups of patients with elevated body temperatures [13]. It appears from the model studies that, in fever, hu-midity transfer is more effective with corrugated bed sheets, while heat transfer is improved by bed sheets with a satin weave. Twelve-hour observa-tions demonstrated significantly increased values in the PAmpl and PSlope hemodynamic param-eters along with CT reduction in the seventh hour of febrile status in the group of patients using sat-in-weave bed sheets as compared with the group using corrugated-fabric bed sheets. At the same time, no significant changes were observed in the PT parameter. Analysis of the plethysmographic parameters indicates blood flow normalization in the studied area in the patients using satin bed sheets, thus confirming the usefulness and suit-ability of satin fabrics for effective distribution of accumulated heat when the organism is in a febrile state.
A comparison of the results of previous clini-cal studiesmaysupport theconclusion that ther-moregulation disorders that lead to elevated body temperatures (the febrile state) also impair the mi-croclimate of the skin of chronically immobilized persons, accelerating the occurrence of conditions conducive to decubitus formations on the skin. This is consistent with thesignificant increase in the values of the Pampl, PSlope and CT hemody-namic parameters in the groups of patients using bed sheets as compared with subjects with full mo-tor ability.
Local blood flow disorders in the groups of pa-tients in the study occurred at the very beginning of
Fig. 8. Correlations observed in PT parameters [ms] in groups 1–4
Ryc. 8. Graficzne przedstawienie obserwowanych zależności dla grup 1–4 badanych osób dotyczących parametru PT [ms]
group 2 – patients using corrugated bed sheets/chorzy użytkujący prześcieradła z tkanin gofrowanych group 1 – healthy subjects (fully mobile)/osoba zdrowa (poruszająca się)
group 3 – patients using satin bad sheets/chorzy użytkujący prześcieradła z tkanin atłasowych group 4 – patients using traditional bed sheets/ chorzy użytkujący tradycyjne prześcieradła
days (from 1st to 7th)
Table 9. PAmpl parameters [p.m] in groups 2a and 3a Tabela 9 . Zestawienie wyników dla grup 2a i 3a badanych osób dotyczących parametru PAmpl [p.m] 1st hour 2nd hour 3rd hour 4th hour 5th hour 6th hour 7th hour 8th hour 9th hour 10th hour 11th hour 12th hour Gr 2a 0.680 ± 0.018 0.673 ± 0.040 0.688 ± 0.021 0.663 ± 0.017 0.683 ± 0.015 0.635 ± 0.038 0.633 ± 0.038 0.628 ± 0.043 0.625 ± 0.071 0.615 ± 0.059 0.613 ± 0.056 0.598 ± 0.054 Gr 3a 0.660 ± 0.010 0.660 ± 0.020 0.647 ± 0.021 0.643 ± 0.051 0.650 ± 0.020 0.697 ± 0.021 0.717 ± 0.015 0.707 ± 0.006 0.733 ± 0.015 0.730 ± 0.026 0.737 ± 0.035 0.720 ± 0.030 p p > 0.05 p > 0.05 p < 0.05 p > 0.05 p > 0.05 p > 0.05 p < 0.05 p < 0.05 p > 0.05 p < 0.05 p < 0.05 p < 0.05 Fig. 9. Correlations observed in PT parameters [ms] in groups 2a and 3a Ryc. 9. Graficzne przedstawienie obserwowanych zależności dla grup 2a i 3a badanych osób dotyczących parametru PAmpl [p.m] hours (fr
om 1st to 12th
)
group 2a – patients using corrugated bed sheets/chorzy użytkujący prześcieradła z tkanin gofrowanyc
h
group 3a – patients using satin bad sheets/chorzy użytkujący prześcieradła z tkanin atłasowyc
h
pulse wave amplitude
PA
mpl [p.m
]
amplituda fali pulsu
PA
mpl [p.m
Table 10. PSlope parameters [p.m/s] in groups 2a and 3a Tabela 10. Ze sta wi en ie wy ni kó w dl a g ru p 2 i 3 ba da ny ch o só b dotyczących pa ra m etr u PS lo pe [p .m /s] 1st hour 2nd hour 3rd hour 4th hour 5th hour 6th hour 7th hour 8th hour 9th hour 10th hour 11th hour 12th hour Gr 2a 8.79 ± 0.30 8.85 ± 0.24 8.64 ± 0.62 8.59 ± 0.56 8.41 ± 0.56 8.38 ± 0.61 8.35 ± 0.40 8.05 ± 0.17 8.23 ± 0.53 8.28 ± 0.62 8.35 ± 0.29 8.03 ± 0.15 Gr 3a 8.67 ± 0.15 8.67 ± 0.15 8.44 ± 0.26 8.33 ± 0.15 8.17 ± 0.25 8.70 ± 0.26 8.83 ± 0.35 8.77 ± 0.68 9.07 ± 0.21 9.10 ± 0.17 9.13 ± 0.25 9.23 ± 0.12 p p > 0.05 p > 0.05 p > 0.05 p > 0.05 p < 0.05 p > 0.05 p > 0.05 p > 0.05 p > 0.05 p > 0.05 p < 0.05 p < 0.05 Fig. 10. Graphic presentation of the correlations observed in PSlope parameters [p.m/s] in groups 2a and 3a Ryc. 10. Graficzne przedstawienie obserwowanych zależności dla grup 2a i 3a badanych osób dotyczących parametru PSlope [p.m/s] hours (fr
om 1st to 12th
)
group 2a – patients using corrugated bed sheets/chorzy użytkują
cy prześcieradła z tkanin gofrowanyc
h
group 3a – patients using satin bad sheets/chorzy użytkujący pr
ześcieradła z tkanin atłasowyc
h
systolic slope of pulse wave PSlope [p.m/s
]
skurczowe nachylenie fali pulsu PSlope [p.m/s
]
Table 11. CT parameters [ms] in groups 2a and 3a Tabela 11. Ze sta wi en ie wy ni kó w dl a g ru p 2a i 3a b ad an yc h os ób dotyczących pa ra m et ru C T [m s] 1st hour 2nd hour 3rd hour 4th hour 5th hour 6th hour 7th hour 8th hour 9th hour 10th hour 11th hour 12th hour Gr 2a 155.50 ± 3.87 153.25 ± 4.50 154.75 ± 12.95 153.75 ± 14.08 156.25 ± 11.24 170.75 ± 5.56 173.75 ± 6.18 179.75 ± 8.14 174.75 ± 7.14 175.25 ± 6.65 172.25 ± 5.97 182.75 ± 5.50 Gr 3a 156.33 ± 3.06 157.00 ± 2.65 155.33 ± 6.03 160.67 ± 24.42 158.00 ± 19.31 149.67 ± 15.50 146.33 ± 13.01 147.67 ± 9.71 142.67 ± 1.53 142.33 ± 10.50 143.33 ± 5.86 145.67 ± 2.08 p p > 0.05 p > 0.05 p > 0.05 p > 0.05 p > 0.05 p < 0.05 p < 0.05 p < 0.05 p < 0.05 p < 0.05 p < 0.05 p < 0.05 Fig. 11. Correlations observed in CT parameters [ms] in groups 2a and 3a Ryc. 11. Graficzne przedstawienie obserwowanych zależności dla grup 2a i 3a badanych osób dotyczących parametru CT [ms] hours (fr
om 1st to 12th
)
group 2a – patients using corrugated bed sheets/chorzy użytkujący prześcieradła z tkanin gofrowanyc
h
group 3a – patients using satin bad sheets/chorzy użytkujący prześcieradła z tkanin atłasowyc
h
crest time CT
[ms]
czas do szczytu fali CT
Table 12. PT p ar am et er s [ m s] in groups 2a and 3a Tabela 12. Ze sta wi en ie wy ni kó w dl a g ru p 2a i 3a b ad an yc h os ób dotyczących pa ra m et ru P T [m s] 1st hour 2nd hour 3rd hour 4th hour 5th hour 6th hour 7th hour 8th hour 9th hour 10th hour 11th hour 12th hour Gr 2a 203.25 ± 5.85 202.50 ± 13.67 200.75 ± 3.10 203.75 ± 13.87 200.75 ± 2.22 203.00 ± 7.44 202.00 ± 10.89 199.25 ± 3.10 203.25 ± 9.74 201.25 ± 5.32 203.50 ± 12.18 201.25 ± 9.57 Gr 3a 205.67 ± 5.03 206.33 ± 10.97 205.67 ± 9.87 206.33 ± 6.11 203.67 ± 6.43 204.33 ± 6.66 206.00 ± 14.93 204.00 ± 6.24 207.00 ± 8.00 206.33 ± 10.12 206.67 ± 12.42 205.33 ± 7.64 p p > 0.05 p > 0.05 p > 0.05 p > 0.05 p > 0.05 p > 0.05 p > 0.05 p > 0.05 p > 0.05 p > 0.05 p > 0.05 p > 0.05 Fig. 12. Correlations observed in PT parameters [ms] in groups 2a and 3a Ryc. 12. Graficzne przedstawienie obserwowanych zależności dla grup 2a i 3a badanych osób dotyczących parametru PT [ms] hours (fr
om 1st to 12th
)
propagation time PT
[ms]
czas propagacji PT
[ms]
group 2a – patients using corrugated bed sheets/chorzy użytkujący prześcieradła z tkanin gofrowanyc
h
immobilization (on the second day). The results of the study suggest that local blood flow disorders ob-served early in the immobilization, and the accom-panying elevation in body temperature and skin hu-midity, intensify skin lesion processes. Asher [14] expresses a similar opinion, studying physiological indicators that manifest in the early period of im-mobility; according to that author, it is associated with limited muscular tissue activity, as well as with progressive blood rheological disorders.
Prior clinical studies confirm the practical suit-ability of specially designed fabrics, regardless of the nature of their contact with human skin – continu-ous contact (fabric with a satin weave) or point con-tact (fabric that is corrugated during the weaving process). According to Van Langenhove, the main causes of decubitus ulcer formation in chronically immobilized subjects include incidental creases and folds in bed sheet fabrics [15]. An incidental fabric deformation can cause considerable compression of vessels in the subcutaneous layer, changing blood flow from laminar to turbulent. The compression of vesselsradically suppressing the blood flow in the vessel, reduces the metabolism of neighboring tissues and increases the changes associated with oxygen deficiency, which is conducive to the for-mation of decubitus ulceration. However, when the
fabric structure has programmed, regular convex elements (corrugated fabric), the physiological re-action of the local vascular system seems to be more complex. Fabric with properly designed surface ge-ometry and appropriate elasticity in its convex frag-ments, causing adaptive deformation of vessels in the subcutaneous layer, does not limit blood flow but, paradoxically, improves it [16]. It seems that the main role in this mechanism belongs to the density of the convex elements of corrugated fabric, which support laminar blood flow stability in vessels un-der uniform compression [17]. on this basis it may be concluded that designed point contact with the skin is especially favorable in terms of blood flow dynamics in the small vessels of the subcutaneous layer (Figs 3 and 4).
In conclusion, the authors wish to emphasize that using impedance plethysmography to evalu-ate local blood flow changes in chronically immo-bilized patients is a useful method for precise and repeatable monitoring of flow parameters in the area under examination. It also serves to prompt appropriate prevention activities and the prepara-tion of anti-decubitus underlay structures at the early stages of skin lesion formation in patients who are bedridden long-term with restricted body positions.
References
[1] Seiler WO, Stähelin HB: Decubitus ulcers in geriatrics – pathogenesis, prevention and therapy. Ther Umsch 1991,
48, 5, 329–340.
[2] Kosiak M: Etiology and pathology of ischemic ulcers. Arch Phys Med Rehabil 1959, 40, 62–69.
[3] McInnes E, Bell-Syer SE, Dumville JC, Legood R, Cullum NA: Support surfaces for pressure ulcer prevention.
Cochrane Database Syst Rev 2008, 8, 4, CD001735.
[4] Cochran G, Palmieri V: Development of test methods for evaluation of wheelchair cushions. Bull Prosthet Res
1980, 17, 9–30.
[5] Stewart S, Palmieri V, Cochran G: Wheelchair cushion effect on skin temperature, heat and relative humidity.
Arch Phys Med Rehabil 1980, 61, 229–233.
[6] Wywiałowski EF: Tissue perfusion as a key underlying concept of pressure ulcer development and treatment.
J Vasc Nurs 1999, 17, 12–16.
[7] Cullum N, Deeks J, Sheldon TA, Song F, Fletcher AW: Beds, mattresses and cushions for pressure sore
preven-tion and treatment. Cochrane Database Syst Rev 2004, 3, CD001735.
[8] Nicholson GP, Scales JT, Clark RP, Calcina-Goff MLD: A method for determining the heat transfer and water
vapour permeability of patient support systems. Med Eng Phys 1999, 21, 701–712.
[9] Siebert J, Poliński A: Badania modelowe zastosowania pletyzmografii impedancyjnej do badania przepływu krwi
w kończynach. Folia Cardiol 1999, 6, 417–422.
[10] Siebert J, Poliński A, Rogowski J: Pletyzmografia impedancyjna – ocena całkowitego przepływu krwi w
przed-ramieniu. Folia Cardiol 1999, 6, 359–362.
[11] Kozera G, Miszkowska E, Bieniaszewski L, Nyka W: Zakrzepica żył głębokich u chorych na udar mózgu. Neurol
Neuroch Pol 2007, 41, 3, 251–258.
[12] Mayrovitz HN, Sims N: Biophysical effects of water and synthetic urine on skin. Adv Skin Wound Care 2001, 14,
302–308.
[13] Irzmańska E, Lipp-Symonowicz B, Kujawa J, Irzmański R: Textiles preventing skin damages. Fibr Tex East Eur,
2009, in press.
[14] Bruck K: Thermal balance and the regulation of body temperature. Hum Physiol 1989, 624–627.
[15] Van Langenhove L: Formation of creases in bedsheets – a cause of decubitus. I International Conference Medical
Textiles, Bolton 1999.
[16] Sulzberger M, Cortese TA, Fishman L, Wiley HS: Studies on blister produced by friction. J Invest Dermatol 1996,
47, 456–465.
Address for correspondence:
Magdalena CharłuszLaboratory of Ergonomics and Exercise Physiology Medical University of Lodz
Hallera 1 90-647 Łódź Poland
Tel.: +48 42 63 93 082 E-mail: [email protected]
Conflict of interest: None declared Received: 25.05.2010

![Fig. 5. Correlations observed in PAmpl parameters [p.m] in groups 1–4](https://thumb-us.123doks.com/thumbv2/123dok_us/8771759.1757393/6.595.88.399.60.248/fig-correlations-observed-pampl-parameters-p-m-groups.webp)
![Fig. 6. Correlations observed in PSlope parameters [p.m/s] in groups 1–4](https://thumb-us.123doks.com/thumbv2/123dok_us/8771759.1757393/7.595.86.403.60.311/fig-correlations-observed-pslope-parameters-p-m-groups.webp)
![Fig. 7. Correlations observed in CT parameters [ms] in groups 1–4Ryc. 7. Graficzne przedstawienie obserwowanych zależności dla grup 1–4 badanych osób dotyczących parametru CT [ms]](https://thumb-us.123doks.com/thumbv2/123dok_us/8771759.1757393/8.595.95.458.62.283/correlations-parameters-graficzne-przedstawienie-obserwowanych-zaleznosci-dotyczacych-parametru.webp)
![Fig. 8. Correlations observed in PT parameters [ms] in groups 1–4](https://thumb-us.123doks.com/thumbv2/123dok_us/8771759.1757393/9.595.84.456.63.268/fig-correlations-observed-pt-parameters-ms-groups.webp)
![Fig. 9. Correlations observed in PT parameters [ms] in groups 2a and 3a](https://thumb-us.123doks.com/thumbv2/123dok_us/8771759.1757393/10.595.121.488.81.764/fig-correlations-observed-pt-parameters-ms-groups-a.webp)
![Fig. 10. Graphic presentation of the correlations observed in PSlope parameters [p.m/s] in groups 2a and 3a](https://thumb-us.123doks.com/thumbv2/123dok_us/8771759.1757393/11.595.114.487.69.768/fig-graphic-presentation-correlations-observed-pslope-parameters-groups.webp)
![Fig. 11. Correlations observed in CT parameters [ms] in groups 2a and 3a](https://thumb-us.123doks.com/thumbv2/123dok_us/8771759.1757393/12.595.119.477.80.754/fig-correlations-observed-ct-parameters-ms-groups-a.webp)
![Fig. 12. Correlations observed in PT parameters [ms] in groups 2a and 3a](https://thumb-us.123doks.com/thumbv2/123dok_us/8771759.1757393/13.595.136.483.68.767/fig-correlations-observed-pt-parameters-ms-groups-a.webp)
