University of New Orleans University of New Orleans
ScholarWorks@UNO
ScholarWorks@UNO
University of New Orleans Theses and
Dissertations Dissertations and Theses
Fall 12-20-2017
Conflict, constraint, and the evolution of the multivariate
Conflict, constraint, and the evolution of the multivariate
performance phenotype
performance phenotype
Ann M. Cespedes PhD
University of New Orleans, [email protected]
Follow this and additional works at: https://scholarworks.uno.edu/td Part of the Other Ecology and Evolutionary Biology Commons
Recommended Citation Recommended Citation
Cespedes, Ann M. PhD, "Conflict, constraint, and the evolution of the multivariate performance phenotype" (2017). University of New Orleans Theses and Dissertations. 2401.
https://scholarworks.uno.edu/td/2401
This Dissertation is protected by copyright and/or related rights. It has been brought to you by ScholarWorks@UNO with permission from the rights-holder(s). You are free to use this Dissertation in any way that is permitted by the copyright and related rights legislation that applies to your use. For other uses you need to obtain permission from the rights-holder(s) directly, unless additional rights are indicated by a Creative Commons license in the record and/ or on the work itself.
Conflict, constraint, and the evolution of the multivariate performance phenotype
A Dissertation
Submitted to the Graduate Faculty of the University of New Orleans in partial fulfillment of the requirements for the degree of
Doctor of Philosophy in
Conservation Biology
by
Ann M. Cespedes
B.S. Biology University of New Orleans, 2008
ii
Dedicated to to my mother, Liz Reeser, for supporting me, teaching me, and always being right, and to all the friends and family who were with me these past seven years.
iii
Acknowledgements
I would like to thank all of those who have helped make this dissertation possible. First, I would like to acknowledge my advisor, Dr. Simon Lailvaux, for contributing so much to the
development of this project and its execution. His mentorship, guidance, good advice, and belief in me helped me through so many difficult times in my graduate career. I will forever be grateful for giving me this opportunity and for supporting both my creativity and my development as a good biologist. Secondly, I must thank the members of my committee, Dr. Charles Bell, Dr. Nicola Anthony, Dr. Jerome Howard, and Dr. Jerry Husak, who have each given me invaluable advice and support during my career. Finally, my friends Dr. Jessica Edwards, Dr. Laura Alexander, Dr. Alex Figueroa for being so helpful along the way.
iv
Table of Contents
List of Tables ... vi
List of Figures ...vii
Abstract ... viii
Introduction ... 1
Aims and hypotheses...4
References...5
Chapter 1 ... 9
Abstract...10
Introduction...11
Materials and Methods...12
Results ... 19
Discussion...21
Acknowledgments...26
References...26
Chapter 2 ... 30
Abstract...31
Introduction...32
Materials and Methods ... 34
Results... 39
... Discussion...46
...Acknowledgments...48
... References...48
Chapter 3 ... 52
Abstract ... 53
Introduction ... 54
Materials and Methods ... 57
Results ... 63
Discussion... 72
Acknowledgments ... 74
References ... 75
Appendix: Chapter 1 Simulation code and results ... 78
Supplementary File S1 ... 79
Supplementary File S2 ... 93
Supplementary File S3 ... 93
v
List of Tables
Chapter 1
Table 1...15
Table 2...22
Table 3...23
Table 4...24
Chapter 2 Table 1...35
Table 2...39
Table 3...40
Table 4...41
Table 5...41
Table 6...42
Table 7...43
Table 8...44
Table 9...45
Table 10...45
Chapter 3 Table 1...59
Table 2...66
Table 3...66
Table 4...68
Table 5...68
vi
List of Figures
Chapter 1
Figure 1...14
Figure 2...20
Figure 3...21
Chapter 3
Figure 1...64
Figure 2...65
vii
Abstract
Performance is key to survival. From day-to-day foraging events, to reproductive activities, to
life-or-death crises, how well an organism performs these tasks can determine success or failure. Selection,
therefore, both natural and sexual, act upon performance, and performance demands on individuals
shape a population’s morphological and physiological trait distributions. While studies of
morphological adaptations to ecological pressures implicitly center on the idea that responses to
selection improve performance via changes in morphology, the relationships between morphology,
performance, and fitness are not always well understood. In this dissertation, I investigate these
relationships explicitly, as well as determine the effects that different ecological and genetic
contexts have on selection and how populations respond to performance pressures.
Using a model of lizard locomotor performance, I address three issues that may impact selection on
performance that are often overlooked in performance studies. First, performance is not a static
trait. Rather, individuals possess a range of performance abilities or intensities that can be expressed
as needed. Using a novel, individual-based, quantitative genetic simulation model, I demonstrate the
effects of variable performance expression and genetic constraints on how a population experiences
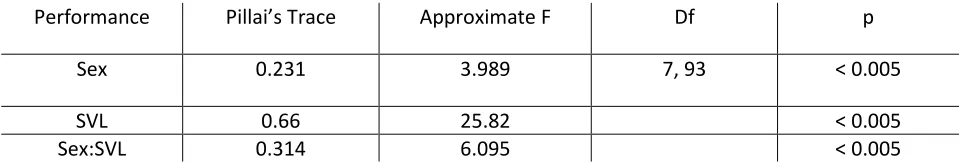
and responds to selection on sprint and endurance performance. Second, sex differences in
performance are expected in sexually dimorphic species, but empirical evidence for this is lacking. To
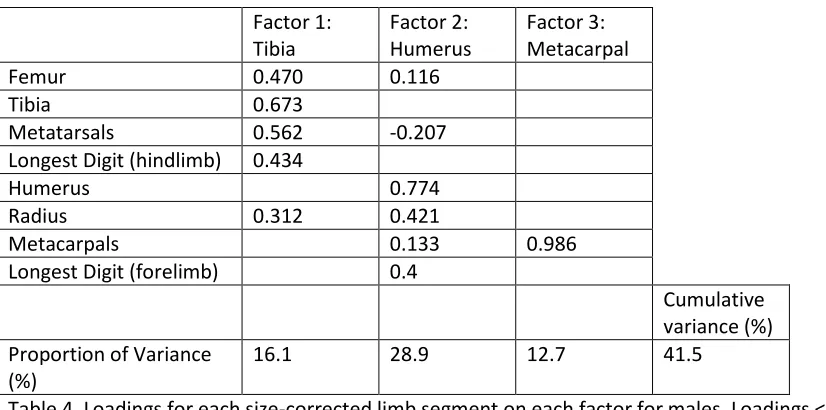
this end, I measured and analyzed multivariate morphology and performance in Anolis carolinensis
to identify sex-specific patterns in functional morphology and functional trade-offs within a broad
suite of performance traits. Third, intralocus sexual conflict should constrain the evolution of the
multivariate performance phenotype in both sexes. By extending the simulation model to include
correlated trait inheritance between sexes and sex-specific selection on certain performance traits, I
demonstrate the extent to which this sexual conflict constrains performance evolution. In combining
studies of natural populations with simulation studies of selection, this dissertation embraces the
complexity of performance to address the multiple contributing factors and constraints on
performance evolution, and demonstrates the importance of accounting for such complexity when
studying animal performance.
Keywords: Whole-organism performance; simulation study; functional morphology; sexual conflict;
1
Introduction
Whole organism performance, defined as how well an organism performs a dynamic,
ecologically relevant task (Bennet and Huey, 1990; Lailvaux & Irschick, 2006), is a primary target of
selection and therefore fundamental to our understanding of adaptation (Arnold, 1983; Garland &
Losos, 1994; Irschick & Garland, 2001). Performance traits represent the integrated output of a
complex, multivariate functional system, and evolve only when there is heritable variation on the
underlying morphological traits (Arnold, 1983; Garland, Bennett & Daniels, et al., 1990; Garland &
Losos, 1994; Garland & Carter, 1994, Geffeney et al., 2002). Given the complex pathways connecting
ecological and life history variables to whole organism performance, understanding and
reconstructing the evolution of performance requires an explicitly integrative approach (for
example, Brodie & Ridenhour, 2003). Locomotor performance, in particular, is thought to be under
generally strong selection given its importance in the day to day life of so many organisms.
With over forty years of investigations into reptile locomotor performance traits and their
role in ecomorphology and specialization from functional, ecological and morphological perspectives
(Garland & Losos, 1994), reptiles and, in particular, lizards are model organisms for investigating how
and when selection on performance traits drives phenotypic evolution and adaptation. The
relationship between locomotor performance and habitat use is well established for many lizard
groups, making them a model organism for studies of ecomorphology and adaptive radiation
(Garland & Losos, 1994; Aerts et al., 2000; Irschick & Garland, 2001). Locomotor performance is
important for a host of fitness-related activities, including predator escape, prey capture, and
resource and mate acquisition (e.g., Vanhooydonck & Van Damme, 2003; Husak, 2006a), and is a
function of both physiological and biomechanical properties (morphology – performance) and the environment (thermal properties, substrate, fluid surroundings). Lizard body plans are therefore
adapted to particular environments, and this adaptation has given rise to the variety of functional
forms seen today. Understanding the evolutionary ecology of locomotor performance traits in lizards
and the role these traits and their constitutive morphological components play in day-to-day life is
crucial to investigations of adaptive evolution.
Constraints and trade-offs characterize functional design in both biology and engineering.
Functional constraints stem from optimization problems in design. In locomotion, for example, a
design that optimizes speed may be at a disadvantage in terms of manoeuvrability due to the
conflicting demands on the same functional apparatus. Due to such trade-offs, specialization of
locomotion to a particular environment may often be correlated with decreased performance in
other environments and would come at an evolutionary cost in the long run if the environment
2
thus represent compromises between many competing trade-offs (Alexander, 2003). However, it is
the underlying genetic architecture of the organism that determines whether such compromises are
possible. Indeed, genetic constraints on phenotypic evolution can be absolute in that the underlying
properties of the genetic architecture may make it impossible for a given phenotype to exist, or they
can impose biases on the course of evolution (Arnold, 1992). The information regarding correlations
between traits (due to pleiotropy, for example) is summarized in the G-matrix, and from this
information one can predict the response of a suite of traits in response to selection on one trait
(Lande, 1979; Lande & Arnold, 1983; Arnold, Pfrender & Jones, 2001). This dissertation aims to
arrive at a better understanding of how selection acts on suites of performance traits, leading to
phenotypic shifts in populations in the context of these functional and genetic constraints. In
particular, I aim to investigate performance evolution with regard to constraints imposed by two
specific scenarios –intralocus sexual conflict and preferred versus maximal performance.
Sexual conflict and performance
Sexual conflict adds to the complexity of selection on performance because males and
females frequently experience divergent selective pressures on, and occupy different selective
optima for, a given trait or traits, yet also share a genome. Thus, the evolution of any resolution to
such conflict requires mechanisms that arise from and act on this shared genome. Intralocus sexual
conflict (IASC) refers to the displacement of sexes from their respective phenotypic optimum due to
selection on specific traits in one sex that are negatively correlated with performance traits on which
the other sex relies. This is distinct from interlocus sexual conflict (IRSC), which is the antagonistic
coevolution between loci in which one sex’s reproductive success is enhanced at the other’s expense (Bonduriansky & Chenoweth, 2009). A number of mechanisms are seen in nature as partial or
complete resolutions to sexual conflict, and this project focuses particularly on the evolution of
sexual size and shape dimorphism wherein the sexes can evolve along separate trajectories and
achieve separate optima (Lande, 1980). Similarly of interest is the emergence of behavioural and
physiological dimorphisms, which can act as compensatory mechanisms, mitigating some of effects
arising from sexual conflict (e.g. Husak et al., 2011).
Although sexual dimorphism in reptiles is easily observed and has been well documented
(e.g. Berry and Shine, 1980; Butler and Losos, 2002; Shine, 2003; Cox et al., 2007; Husak and Fox,
2008), demonstrating sexual differences in performance is less common and has only recently
gained attention (reviewed in Lailvaux 2007; but see Lailvaux et al., 2003; Kaliontzopoulou, Bandeira
& Carretero, 2013). Investigating sexual dimorphism in locomotor performance is important for a
clear understanding of adaptive evolution, as ignoring the interactions between separate selective
3
processes (Husak and Lailvaux 2014). By better understanding the proximate and ultimate causes of
sexual dimorphism, and the consequences of SD on multivariate performance response surfaces, we
can better understand adaptive evolution in general.
Preferred and maximal performance
The connection between locomotor performance and fitness is paramount to understanding
the evolution of morphological variation and adaptation within and among species, but how useful
are maximal laboratory measures of performance for understanding the realized effects of
morphology and performance trade-offs in nature? Furthermore, how do we interpret lab
performance measures in an ecological and evolutionary context? It is well understood that animals
do not necessarily always operate at maximal performance in nature, creating a mismatch between
nature and laboratory measures (Irschick, 2003; Irschick et al., 2005). Energy efficiency probably
plays a large role in limiting individual effort in everyday tasks in conjunction with innumerable costs
incurred during daily life, and thus performance is subject to compromises beyond those at the
morphological level. For example, survival in adult Collared Lizards showed a significant positive
relationship with the speed used while escaping a predator, but not maximum sprint speed (Husak,
2006b). Aside from individual variation in performance traits, the environment itself affects
expressed performance traits. Temperature determines much of an ectotherm’s ability to function
and perform tasks (e.g. Huey, 1974, 1982; Huey & Stevenson, 1979; Bennett, 1980; Marsh &
Bennett, 1986; Lailvaux, 2007; Lailvaux & Irschick, 2007) and properties of the substrate, such as
slope, perch diameter, friction, and compressibility or compliance all have measurable effects on
lizard performance (Huey & Hertz, 1982; reviewed in Garland &Losos, 1994; Losos & Irschick, 1996;
Losos & Sinervo, 1989; Sinervo & Losos,1991; Losos et al., 1993). Thus operating at suboptimal
temperatures or on suboptimal substrates incurs costs, either in the form of performance costs or
other costs of mitigating the effects behaviourally.
Because this framework of costs and energy efficiency probably drives the choice of optimal
speeds that animals select in nature (Wilson et al. 2015), any useful model of preferred/optimal
speed should incorporate those costs when attempting to explain why animals perform at the levels
that they do. Furthermore, ecological processes involve many highly complex causal paths between
a great many variables, and this complexity may have unpredictable consequences for how we
determine and interpret phenotypic responses to selection on whole organism performance. One
approach to dealing with these challenges is the use of simulation models, which allow us to
incorporate complexity, examine responses over a wide range of conditions and ultimately check
some of our assumptions (Judson 1994; Peck 2004). By manipulating selection pressures and
4
generate artificial evolutionary lineages that we can follow over the course of multiple generations,
and that we can use to directly test the effect of specific factors (such as the extent of maximum
performance capacities used during routine ecological tasks) on evolutionary trajectories under
known conditions (e.g., heritability parameters, sex ratios, starting morphological trait distributions
and environmental parameters).
Aims and hypotheses
With many various and interrelated pathways and variable selective contexts, our
understanding of deterministic processes regarding the effects of selection on performance starts to
break down. What are our null hypotheses regarding adaptation and evolution when so many
parameters are identified and interrelated? Are our attempts to simplify these processes realistic?
We know that behaviour, performance trade-offs, compensatory mechanisms, sex-specific selection,
and a host of life history factors complicate the relationships between morphology, performance
and fitness (Lailvaux & Husak, 2014; Husak & Lailvaux 2014). We also know there is a stochastic
component to differential fitness in that the ecological and environmental context ultimately affects
whether or not a given phenotype survives to reproduce (and that its offspring survive to reproduce,
and so on). Therefore, it is imperative that we incorporate this complexity into our understanding
and interpretation of ecological data and ecomorphological questions. In complex systems,
emergent properties arise that cannot be predicted from only data on the individual parts. Thus, this
dissertation aims to build on the prevailing reductionist paradigm in functional morphology and
describe such emergent properties, detangle their effects on our perception of adaptive evolution of
locomotor performance and determine when and how the whole may be greater than the sum of all
parts.
With this in mind, this dissertation tests three specific hypotheses:
1) Organisms that operate at some submaximal, preferred level of performance in nature enjoy
a fitness advantage over those that employ the full extent of their maximum performance
capacities in nature at all times. Testing this hypothesis involves building a quantitative
genetic simulation model harboring individual agents that survive and reproduce under
pre-defined selective regimes and subject to constraints regarding the use of their maximum
performance capacities.
2) Males and females may be sexually dimorphic for both morphology and performance, and
that dimorphism could drive sex-specific patterns of trade-offs among whole-organism
performance traits. Trade-offs among suites of performance traits are seldom measured in
5
entirely ignored. Empirical data pertaining to such trade-offs are required to understand
how morphology-performance relationships might differ between males and females.
3) The evolution of sex differences in the multivariate performance phenotype is constrained
by both the genetic architecture among component performance traits, and the functional
trade-offs among types of performance that rely on conflicting functional mechanisms for
optimal expression. By extending the above quantitative genetic model to a multivariate
scenario and imposing sex-specific selection on one aspect of the multivariate phenotype,
we can test the extent to which intralocus sexual conflict impedes the evolution of sex
differences in performance traits that are not necessarily always maximally expressed.
References
Aerts, P., Van Damme, R., Vanhooydonck, B., Zaaf, A. & Herrel, A. 2000. Lizard locomotion: how
morphology meets ecology. Neth. J. Zool. 50, 261–277.
Alexander, R. M. 2003. Animal Principles of Locomotion.Princeton University Press. Princeton, NJ.
Arnold, S.J., 1983. Morphology, performance and fitness. American Zoologist, 23: 347-361.
- 1992. Constraints on phenotypic evolution.The American Naturalist, 140:S85-S107.
Arnold, S.J., Bennett. A. F. 1988. Behavioral variation in natural populations. V. Morphological
correlates of locomotion in the garter snake Thamnophis radix. BiologicalJournal of the
Linnean Society, 34: 175-190.
Arnold, S. J., M. E. Pfrender, A. G. Jones. 2001. The adaptive landscape as a conceptual bridge
between micro- and macroevolution. Genetica 112/113: 9-32.
Bennett, A. F., and R. B. Huey. 1990. Studying the evolution of physiological performance. Pp.
251-284 in D. J. Futuyma, and J. Antonovics, eds. Oxford Surveys in Evolutionary Biology. Oxford
University Press, Oxford.
Bennett, A.F. 1980. The thermal dependence of lizard behavior. Animal Behavior, 28(4) 752-762.
Berry, J.F., Shine, R. 1980. Sexual size dimorphism and sexual selection in turtles (order Testudines).
Oecologia 44: 185-191.
Bonduriansky, R., Chenoweth, S.F. 2009.Intralocus sexual conflict. Trends in Ecology and Evolution,
24(5): 280-288.
Brodie, E.D., Ridenhour, B.J. 2003. Reciprocal selection at the phenotypic interface of
coevolution.Integrative and Comparative Biology, 43(3): 408-418.
Butler, M.A., Losos, J.B. 2002. Multivariate sexual dimorphism, sexual selection, and adaptation in
6
Cox, R.M., Butler, M.A., John-Alder, H.B. 2007. The evolution of sexual size dimorphism in reptiles, in
Sex, Size and Gender Roles: Evolutionary Studies of Sexual Studies of Sexual Size Dimorphism.
Fairbairn, D.J., Blanckenhorn, W.U., Székely, T. (eds.). Oxford University Press, NY.
Garland, T., Jr., Carter, P.A. 1994. Evolutionary physiology. Annu. Rev. Physiol,56: 579-621.
Garland, T., Jr., Losos, J.B.. 1994. Ecological morphology of locomotor performance in squamate
reptiles. in P.C. Wainwright and S. Reilly, Eds., Ecological Morphology: Integrative
Organismal Biology. University of Chicago Press: Chicago. Pp. 240-302
Garland, T., Jr., A. F. Bennett, and C. B. Daniels. 1990. Heritability of locomotor performance and its
correlates in a natural population. Experientia, 46: 530-533.
Geffeney, S., P. C. Ruben, E. D. Brodie Jr., and E. D. Brodie III. 2002. Mechanisms of adaptation in a
predator-prey arms race: TTX resistant sodium channels. Science, 297: 1336-1339.
Huey, R.B., Hertz, P.E. 1982. Effects of body size and slope on sprint speed of a lizard (Stellio(Agama)
stellio). Animal Behaviour, 30: 676-679.
Huey, R. B., and R. D. Stevenson. 1979. Integrating thermal physiology and ecology of ectotherms: A
discussion of approaches. Amer. Zool, 19357-366.
Huey, R. B. 1974. Behavioral thermoregulation in lizards: importance of associated costs. Science,
184: 1001-1003.
Huey, R.B. 1982.Temperature, physiology, and the ecology of reptiles. pp. 25-91, In: C. Gans and F. H.
Pough, eds., Biology of the Reptilia Vol. 12. Academic Press, London.
Husak, J.F. and Fox, S.F. 2008. Sexual selection on locomotor performance. Evol. Ecol. Res., 10: 213–
228.
Husak, J. F., Fox, S. F., Lovern, M. B. and Van Den Bussche, R. A. (2006b). Faster lizards sire more
offspring: Sexual selection on whole-animal performance. Evolution, 60: 2122-2130.
Husak, J. F. 2006. Does survival depend on how fast you can run or how fast you do run? Functional
Ecology, 20: 1080-1086.
Husak, J. F., Ribak, G., Wilkinson, G. S., Swallow, J. G. 2011. Sexual dimorphism in wing beat
frequency in relation to eye span in stalk-eyed flies (Diopsidae). Biological Journal of the
Linnean Society, 104: 670-679.
Husak, J.F., and Lailvaux, S.P. 2014. An evolutionary perspective on conflict and compensation in
physiological and functional traits. Current Zoology 60:755-767.
Irschick DJ. 2003. Studying performance in nature: Implications for fitness variation within
7
Irschick DJ, Garland T. Jr. 2001. Integrating function and ecology in studies of adaptation:
Investigations of locomotor capacity as a model system. Annual Reviews of Ecology and
Systematics, 32:367-396.
Irschick DJ, Herrel A, VanHooydonck B, Huyghe K, Van Damme R. 2005. Locomotor compensation
creates a mismatch between laboratory and field estimates of escape speed in lizards: A
cautionary tale for performance to fitness studies. Evolution. 59:1579-1587.
Kaliontzopoulou, A., Bandeira, V., Carretero, M. A. 2013. Sexual dimorphism in locomotor
performance and its relation to morphology in wall lizards (Podarcisbocagei). Journal of
Zoology, 289: 294-302.
Lailvaux, S. P. 2007. Interactive effects of sex and temperature on locomotion in reptiles. Integrative
and Comparative Biology, 47:189-199.
Lailvaux, S.P., Husak, J.F. 2017. The life-history of whole-organism performance. Quarterly Review of
Biology 89: 285-318.
Lailvaux, S. P., Irschick. D. J. 2006. A functional perspective on sexual selection: insights and future
prospects. Animal Behaviour, 72:263-273.
-2007. Effects of sex and temperature on jump performance and biomechanics in the lizard Anolis
carolinensis. Functional Ecology, 21, 534-543.
Lailvaux, S.P., Alexander, G.J., Whiting, M.J. 2003. Sex-based differences and similarities in locomotor
performance, thermal preferences, and escape behavior in the lizard Platysaurus
intermedius wilhelmi. Physiol. Biochem. Zool. 76, 511-521.
Lande, R., Arnold, S.J. 1983. The measurement of selection on correlated
characters. Evolution, 37(6): 1210-1226.
Lande, R. 1979. Quanitative genetic analysis of multivariate evolution, applied to brain: body size
allometry. Evolution. 33(1): 402-416.
Lande, R. 1980. Sexual dimorphism, sexual selection, and adaptation in polygenic
characters.Evolution, 34(2): 292-305.
Losos JB, Irschick DJ. 1996. The effect of perch diameter on the escape behavior of Anolis lizards:
Laboratory-based predictions and field tests. Animal Behaviour 51:593-602.
Losos, J.B., Sinervo, B. 1989. The effects of morphology and perch diameter on sprint performance of
Anolis lizards.Journal of Experimental Biology, 145: 23-30.
Losos, J.B., Walton, B.M., Bennett, A.F. 1993. Trade-offs between sprinting and clinging ability.
Functional Ecology, 7: 281-286.
Marsh, R., Bennett, A. F. Thermal dependence of sprint performance of the lizard Sceloporus
8
Shine, R. 2003. Locomotor speeds of gravid lizards: placing 'costs of reproduction' within an
ecological context. Functional Ecology, 17:526-533.
Sinervo, B., and J.B. Losos. 1991. Walking the tight rope: arboreal sprint performance
among Sceloporus occidentalis lizard populations. Ecology 72: 1225-1233.
Vanhooydonck, B. and R. Van Damme (2003) Relationships between locomotor performance,
microhabitat use and antipredator behavior in lacertid lizards. Functional Ecology, 17:
160-169.
Wilson, R. S., J. F. Husak, L. G. Halsey, and C. J. Clemente. 2015. Predicting the movement speeds of
9
Chapter 1
An individual-based simulation approach to the evolution of locomotor
performance
Ann M. Cespedes and Simon P. Lailvaux
Department of Biological Sciences, University of New Orleans, New Orleans, LA
Integrative and Comparative Biology. (2015)
10
Abstract
Maximal whole-organism performance traits measured in the laboratory and the levels of performance
expressed in the field often exhibit a mismatch, complicating our understanding of the selection
pressures influencing the evolution of performance traits. To better understand the evolution of
locomotor performance, we built an individual-based simulation to test hypotheses about selection on
locomotor performance. Starting with a population of individuals with two correlated but variable
performance traits, we simulated these individuals surviving and reproducing in a complex environment,
presenting each individual with successive ecological challenges requiring specific performance
capabilities over their lifespan. While most challenges require sub-maximal speeds, intermittent bouts
requiring increased performance, such as escape from predators, introduce strong, but infrequent,
selection for maximal performance. By comparing the results of simulations run with individuals that
only perform at their maximum levels versus those that adjust this effort, we show that intra-individual
variation in speed confers a selective advantage, regardless of the extent of that variation. We also show
that the direction and strength of the correlation between the two performance traits affects the
evolutionary trajectory of phenotypic change. Ultimately, this model allows us to simulate the evolution
of movement speeds over a range of selective contexts, offering insight into the factors affecting the
11
Introduction
Whole-organism performance capacities (defined as quantitative measures of the ability of an
individual to perform dynamic, ecologically relevant tasks such as jumping, running, or biting) (Bennett
& Huey 1990; Irschick & Garland 2001; Lailvaux and Irschick 2006) provide a direct and intuitive link
between the individual and fitness across several different selective contexts (Husak and Fox 2008;
Irschick et al. 2008). In turn, locomotor performance represents the outcome of a variety of interacting
selection pressures, all of which have operated over evolutionary time to shape the diversity of
performance traits that we see today (Lailvaux & Husak 2014). However, the selective benefits
maintaining a trait can differ from those driving its origin (Chandler et al. 2013). Understanding the
evolution of locomotor performance therefore requires not only quantifying contemporary selection
pressures in nature, but also testing hypotheses regarding how selection may have acted on
performance in the past.
Measuring selection on performance in nature presents a number of challenges. These range
from incomplete or inaccurate characterization of the long-term, dynamic selective environment
(Kingsolver and Pfennig 2007; Irschick et al. 2007; Bell 2010) to limitations in our understanding of the
relationships both among performance traits (Vanhooydonck et al. 2001; Van Damme et al. 2002;
Wilson et al. 2014) and between performance and other key traits that are important to fitness
(Ghalambor et al. 2003; Lailvaux and Husak 2014). An additional challenge is comprehending the
relationships between the maximal performance capacities commonly measured in the laboratory and
the extent to which animals use those capacities in the field (Irschick 2003). It is well understood that
animals do not necessarily always perform at maximal capacity in nature, creating a mismatch between
field and laboratory measures (Irschick et al. 2005). For example, Crotaphytus collaris lizards do not rely
consistently on their maximal sprint capacities in nature, and will alter their sprint speed depending on
whether they are foraging, escaping from a predator, or defending a territory (Husak and Fox 2006).
Consequently, measures of selection on maximal performance capacity may be misleading if organisms
perform at their maximum only rarely or infrequently (Irschick 2003). Alternatively, it may be that high
maximal capacities are meaningful in nature, and are maintained due to their extreme importance in
relatively rare situations, with disproportionate effects on survival or fitness.
Predicting the evolution of preferred movement speed depends not only on our understanding
of the integrated selective context, but also of the factors enabling the response to selection within that
context. Prime among these factors are 1) the additive genetic variance of the trait in question, and 2)
12
selective pressures (Lande and Arnold 1983; Blows 2007). Performance exists within an integrated,
multivariate phenotype (Ghalambor et al. 2003), and as such the evolution of single performance traits
cannot be considered in isolation from the rest of that phenotype (Ghalambor et al. 2004; Lailvaux and
Husak 2014). Any estimate of preferred performance evolution should therefore consider the
relationships among the performance trait of interest and other, related traits in addition to accounting
for the behavioral modulation of the performance trait itself (Garland and Losos 1994). Conducting this
type of integrated and comprehensive evolutionary study is by no means trivial, and empirical attempts
to characterize selection on preferred performance have thus far met with limited success. In particular,
our current poor understanding of the additive genetic (co)variances underlying both performance and
correlated traits that are also key targets of selection (Lailvaux and Husak 2014) precludes this predicted
evolutionary approach in all but a few species (e.g. Le Galliard et al. 2004; Lailvaux et al. 2010).
Individual-based simulations have proven to be useful in situations in whichconducting
complex, large-scale selection studies is difficult or unfeasible (e.g. Jones et al. 2003, 2004; Melo and
Merroig 2015). These simulations therefore constitute a promising alternative approach to investigating
the evolution of preferred performance. Here we present such an approach to modelling selection on
two correlated whole-organism performance traits. We apply our approach to an idealized population of
lizards occupying a small portion of a reasonably large habitat. By starting with this “virgin population”
and changing the selective context via the introduction of predators that put pressure on low-sprint
speed phenotypes, we consider the effects of the heritability and distribution of traits, and of inter- and
intra-individual variability in performance on the evolutionary trajectories of each trait. We therefore
aim to understand not only those factors currently maintaining preferred performance, but also to
simulate the basic selective conditions that might have led to contemporary performance capacities.
Specifically, we test the following hypotheses: 1) Varying between non-maximal (i.e. preferred) and
maximal performance used acts to buffer the effect of selection on performance; 2) Maximal and
optimal trait values depend on both the selective environment, and the nature of the genetic correlation
underlying the two performance traits.
Materials and Methods
The model
We used NetLogo (Wilensky 1999), a Java-based, programmable modelling environment tailored
to agent-based simulations to build and execute our model. NetLogo is a simple and customizable
13
simulation model (Supplementary File S1) of performance evolution consisting of a population of lizards
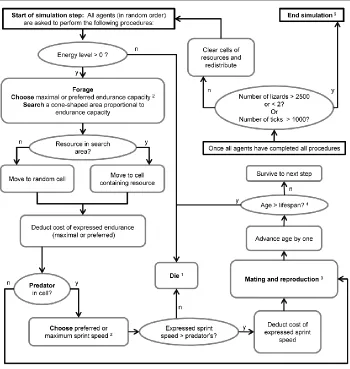
living, eating, reproducing, and dying in an environment according to simple, explicit rules (Figure 1).
Individuals in our model have two performance traits, sprint and endurance, which are subject to
selection based on user-defined “rules”. The expression of each trait is linked tothe individual’s
available energy budget via trait-specific cost-of-transport functions. The utility of each trait in our
model is context-specific: sprint speed is used by individuals to mediate successful or unsuccessful
encounters with predators, while endurance capacity dictates the size of the area an individual can
search for food, and, consequently, the probability that an individual will acquire energy. We define the
energetic costs of performance as a function of the expressed performance. Survival and reproduction
depend on both performance capacity and energy efficiency, depending on the environmental
parameter values. An overview of the simulation is presented in Figure 1.
The environment is a grid of cells that can contain either a predator or a resource, or both, or none.
Predators exist in the same location for the entire simulation, and have a sprint speed assigned at the
start of the simulation (i.e. in the P1 generation), drawn at random from a normal distribution with a
mean of one standard deviation below the mean sprint speed for the population (Table 1). Food is
redistributed before the beginning of every step of the simulation. Resources are depleted during each
step of the simulation as agents consume them. The probability that a resource will be depleted after
being consumed by a single agent is hardcoded as 0.5, thus introducing density effects on the agents’
abilities to acquire resources. The more lizards that are foraging, the greater the chances are that a
resource becomes locally depleted. There are no constraints on movement within the environment
except for the distance an agent can travel given its endurance capacity.
Trait assignment and inheritance
During the initial setup, a starting population of 500 individuals is created and assigned maximal
sprint capacities drawn at random from a normal distribution with mean and standard deviation set by
global simulation parameters (Table 1). Maximal endurance capacity is then determined by a regression
line with a slope equal to the covariance between sprint and endurance (Table 1). For our two-trait
model, we use a parent-offspring regression approach to characterize sprint speed transmission
(inheritance) (Lynch and Walsh 1998). We thus assigned sprint speed a heritability (h2) equal to the
slope of the mid-parent regression line between the parental and F1 generations as well as a separate
parameter governing the correlation between sprint and endurance (Table 1) (Lynch and Walsh 1998).
14
and each individual offspring within the clutch is assigned a value drawn at random from a specified
normal distribution defined by this value and a standard deviation equal to that for sprint speed. The
offspring’s endurance and sex are set using the same procedures as in the initial setup. Thus, sprint
speed and endurance are genetically correlated in our model such that heritable changes in sprint speed
effect changes in endurance determined by the value of the shared genetic covariance.
Figure 1: Simulation processes and scheduling.
1 At death, agents record age, number of offspring, and cause of death (predator, depletion of energy,
or old age).
2 Decision determined by probability of choosing maximum capacity (Table 1).
3 Mating occurs only every 40 steps. If the agent is female and has energy greater than an assigned
threshold, she is randomly paired with a male that also has sufficient energy. The female’s surplus
energy determines the clutch size, and both male and female incur energy costs proportional to the clutch size (Table 1). Mates’ identities are recorded as well as that of each parent-child pair, allowing for the analysis of pedigrees and determination of the number of offspring that survive to reproduce. 4 Occurs only every 50 steps.
5 At the end of a simulation, any remaining lizards update their records and record their cause of death
15
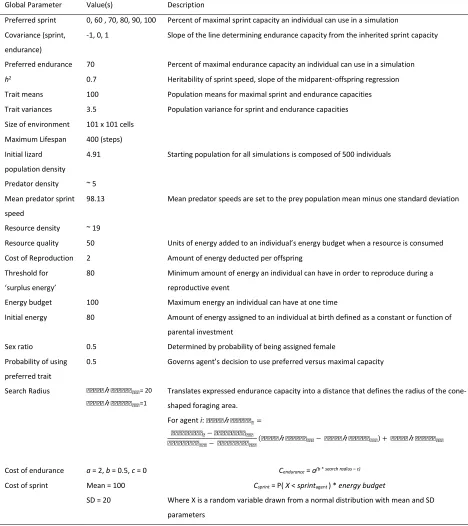
Global Parameter Value(s) Description
Preferred sprint 0, 60 , 70, 80, 90, 100 Percent of maximal sprint capacity an individual can use in a simulation Covariance (sprint,
endurance)
-1, 0, 1 Slope of the line determining endurance capacity from the inherited sprint capacity
Preferred endurance 70 Percent of maximal endurance capacity an individual can use in a simulation
h2 0.7 Heritability of sprint speed, slope of the midparent-offspring regression
Trait means 100 Population means for maximal sprint and endurance capacities Trait variances 3.5 Population variance for sprint and endurance capacities Size of environment 101 x 101 cells
Maximum Lifespan 400 (steps) Initial lizard
population density
4.91 Starting population for all simulations is composed of 500 individuals
Predator density ~ 5 Mean predator sprint speed
98.13 Mean predator speeds are set to the prey population mean minus one standard deviation
Resource density ~ 19
Resource quality 50 Units of energy added to an individual’s energy budget when a resource is consumed
Cost of Reproduction 2 Amount of energy deducted per offspring Threshold for
‘surplus energy’
80 Minimum amount of energy an individual can have in order to reproduce during a reproductive event
Energy budget 100 Maximum energy an individual can have at one time
Initial energy 80 Amount of energy assigned to an individual at birth defined as a constant or function of parental investment
Sex ratio 0.5 Determined by probability of being assigned female Probability of using
preferred trait
0.5 Governs agent’s decision to use preferred versus maximal capacity
Search Radius 𝑠𝑠𝑠𝑠𝑠ℎ𝑠𝑠𝑠𝑠𝑠𝑠𝑠𝑠𝑠= 20 𝑠𝑠𝑠𝑠𝑠ℎ𝑠𝑠𝑠𝑠𝑠𝑠𝑠𝑠𝑠=1
Translates expressed endurance capacity into a distance that defines the radius of the cone-shaped foraging area.
For agent i:𝑠𝑠𝑠𝑠𝑠ℎ𝑠𝑠𝑠𝑠𝑠𝑠𝑠=
𝑠𝑠𝑠𝑠𝑠𝑠𝑠𝑠𝑠𝑠−𝑠𝑠𝑠𝑠𝑠𝑠𝑠𝑠𝑠𝑠𝑠𝑠 𝑠𝑠𝑠𝑠𝑠𝑠𝑠𝑠𝑠𝑠𝑠𝑠− 𝑠𝑠𝑠𝑠𝑠𝑠𝑠𝑠𝑠𝑠𝑠𝑠
(𝑠𝑠𝑠𝑠𝑠ℎ𝑠𝑠𝑠𝑠𝑠𝑠𝑠𝑠𝑠− 𝑠𝑠𝑠𝑠𝑠ℎ𝑠𝑠𝑠𝑠𝑠𝑠𝑠𝑠𝑠) + 𝑠𝑠𝑠𝑠𝑠ℎ𝑠𝑠𝑠𝑠𝑠𝑠𝑠𝑠𝑠
Cost of endurance a = 2, b = 0.5, c = 0 Cendurance = a(b * search radius –c)
Cost of sprint Mean = 100 SD = 20
Csprint = P( X < sprintagent ) * energy budget
Where X is a random variable drawn from a normal distribution with mean and SD parameters
Table 1: Parameters and settings for simulations investigating intra-individual variation in sprint speed. All combinations of preferred sprint speed and Covariance (sprint, endurance) were run multiple times (SI 2). All parameters may also be defined by functions rather than constants. Heritability determines how closely offspring resemble their parents with 1 being a perfect correlation between parent and
offspring trait values, and zero denoting that each offspring’s sprint capacity will always be drawn from
the same distribution as the initial population. Endurancemin and endurancemax are the population’s
16
Costs of Performance
We calculated the costs of sprint speed using a cumulative distribution function for a normal
distribution, the shape of which corresponds to a nearly linear relationship between energetic cost and
speed near the mean sprint capacity for the population, but with decreasing slope as one moves
towards extremely low or high speeds, ultimately reaching a plateau (Biewener 2003). The parameters
describing the shape of the distribution are scaled such that individuals employing sprint speeds near
the population mean incur intermediate costs. Low sprint performers incur little to no energetic costs,
but failing to outsprint a predator means certain death. As we did not wish for endurance to overly
affect relative fitness, we modeled costs of endurance as an exponential function. We parameterized
this curve so that costs gently increase in a roughly linear fashion (assuming a constant metabolic rate)
(Taylor et al. 1982) over the range of values of endurance for the initial population. Thus, most
individuals incur low to intermediate costs. However, costs for endurance capacities far beyond the
range of the starting population become prohibitive, as endurance capacity is limited by physiology and
aerobic capacity (Biewener 2003; Bennett 1982), which are assumed to be unchanging in our model. The
functions and parameter settings for sprint and endurance are presented in Table 1.
Intra-individual variation in sprint speed: preferred versus maximal
To determine the consequences of varying sprint speed forthe intensity and direction of
selection on maximal sprint speed, we ran replicate simulations with all environmental variables and
selection pressure parameters held constant, with only the nature of the correlation between sprint and
endurance (positive, negative and no correlation) and the magnitude of the difference between
preferred and maximal sprint speeds allowed to vary between runs. Resource density was set such that
the average distances between cells containing resources were approximately less than or equal to the
average search radius of the population. Resource quality was set sufficiently high such that individuals
of intermediate phenotypes would remain in positive energy balance for an entire step of a simulation
when considering the costs of locomotion. Predator density was calibrated so that all individuals would
have a high probability of encountering a predator within their lifetimes, resulting in detectable
selection on sprint speed. We determined these settings (Table 1) during parameter sweeps during
development and debugging of the model, as well as by a parameter sweep of the current model,
17
Preferred performance is measured as the percent of maximal capacity that an individual can
use, and in all simulations individuals had a 0.5 probability of using a submaximal or “preferred” trait
value instead of their maximum. We ran at least 15 simulations for all combinations of correlation type
(i.e. -, 0, or +) and each of the following preferred speeds: 0; 60; 70; 80; 90; and 100% of maximal sprint
capacity. When preferred speed is equal to 100%, individuals do not vary sprint speed and always use
their maximal capacity. Endurance, for all simulations, was set to vary between maximal and 70% of
maximum, again with a 0.5 probability of using either preferred or maximum, allowing for variation in
foraging distance and softening the constraints on the system imposed by the costs of endurance. As
resource densities were sufficiently high, lower foraging distances do not greatly affect survival.
Simulations were allowed to run for 15 generations. Simulations ended prematurely if the population
became extinct or exceeded 5000 individuals, as larger populations would typically cause the simulation
to crash.
While Netlogo comes with broad mathematical functionality, we used the R-extension (Thiele
and Grimm 2010) for performing many of the calculations during simulations and also to prepare and
export the simulation output. Data recorded during a simulation is outlined in Fig. 1, and we used
customized R scripts to process this data and calculate selection parameters (Supplementary file S1).
For each generation of a simulated population, we were able to calculate the changes in trait means and
variances over time, as well as the intensity of selection on sprint speed, isprint, which is the change in
mean sprint speed after selection and before reproduction (i.e. the univariate selection differential)
standardized by the trait’s variance (Lande and Arnold 1983). We also estimated the linear selection
coefficient for sprint speed (βsprint) for each generation within each simulation from the regression of
relative fitness on sprint speed. To describe nonlinear selection affecting the variance of sprint speed
phenotypes, we derived a metric similar to the intensity of selection by calculating the difference in
variance during each interval between reproductive events. Finally, we have also included a method for
computing the multivariate selection coefficients for the linear, nonlinear, and correlated selection
coefficients for both traits, the details of which are presented in the Supplementary file S1.
We used generalized linear mixed models for continuous data with an identity link function (GLMM; lme
function, R package: nlme) (Pinheiro et al. 2015) to model how the form and intensity of selection
change over time during a simulation, as well as how these metrics are affected by both variation in
sprint speed and by the correlation between the two locomotor traits. For each dependent variable
(isprint, βsprint, and the magnitude of the change in variance), we constructed models with random
18
sprint and endurance (slope of the regression determining an individual’s endurance capacity given their
sprint capacity), and 3) preferred sprint speed. We first fit the saturated model with all predictors and all
interactions using maximum likelihood and found the minimum adequate model via log-likelihood ratio
deletion tests (stepAIC; R package: MASS) (Venables and Ripley 2002), and refit this model using REML.
Results
Varying individual sprint speed has clear effects on the form and intensity of selection. In the scenarios
wherein individuals always use 100% of their maximum capacity, isprint, βsprinta and the magnitude of the
decrease in variance due to selection are initially very high relative to scenarios in which individuals vary
sprint speed (Figs. 2 and 3), and within two to three generations, predator-imposed selection becomes
negligible while the population expands exponentially, rapidly exceeding 5000 individuals. When
individuals are allowed to employ lower-cost, preferred speeds, however, selection on sprint speed is
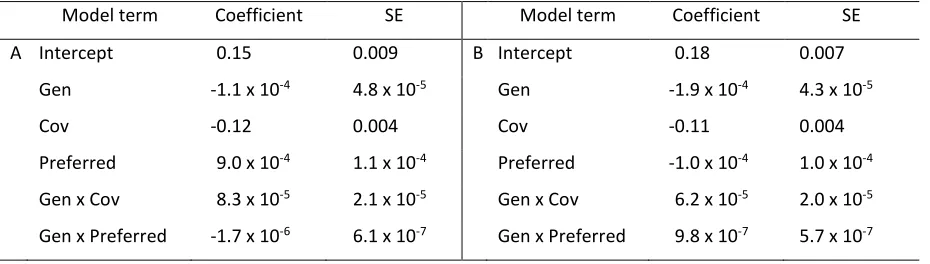
less intense and fluctuates asymptotically over time (Fig. 2). The best-fit model explaining isprint for all
simulations in this experiment (Table 2A) and for the subset of all simulations, excluding populations
that never vary in sprint performance (Table 2B), included terms for generation (time), correlation
structure between sprint and endurance, preferred speed, and interactions between generation and
covariation and generation and preferred speed (Table 2). The coefficient for the preferred-speed term
and the interaction of generation and preferred speed changes signs between the two datasets,
indicating that within the non-variable groups, the effect of this interaction is reversed.
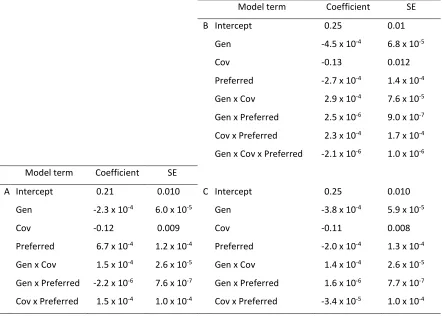
The slope of the linear relationship between maximimal sprint speed and relative fitness, βsprint,
behaved similarly to isprint over the course of our simulations. The best-fit GLMM for βsprint included terms
for generation (time), covariation between traits, preferred speed, and interactions between time and
covariation, time and preferred speed, and covariation and preferred speed (Table 3A). When we
excluded simulations in which individuals used only their maximum, the best model was the saturated
model, with all terms and interactions (Table 3B). To compare with the previous model (Table 3A), we
also fit the model without the three-way interaction, and there was a sign change for all terms involving
preferred speed (Table 3C).
Differences in selection on the variance of sprint speed were also evident in our simulations (Fig.
3). As with our previous selection metrics, the non-varying populations experienced a more dramatic
effect than those that varied sprint speed. The covariance between sprint and endurance did not
however significantly alter the trends observed between the variable and non-variable groups, and this
19
the changes in sprint variance over time (Table 4A). However, a GLMM performed with only the variable
sprint speed populations did retain terms for time and covariance, although the coefficient estimated
for covariance was not large relative to its standard error. Furthermore, differences in preferred speed
did not affect selection on the variance of sprint speed over time within this subset (Table 4B). As
nonlinear selection acts on the variance of a trait, this metric is descriptive of how populations
experience nonlinear selection in our simulation model.
Varying sprint speed not only affects the relationship between sprint capacity and relative
fitness, but also has indirect effects on endurance, especially when sprint and endurance share positive
genetic covariation. We found evidence of significant, negative nonlinear selection on endurance
characterized 249 out of 267 simulations (Supplementary file S3), with the remaining simulations
characterized by negative linear selection on endurance, reflecting the high energetic costs of
endurance. When individuals operated solely at their maximum, selection on sprint capacity was either
positive linear (higher sprint speeds had higher relative fitness) or negative nonlinear in conjunction with
a negative coefficient for the interaction term between sprint and endurance (selection for a negative
correlation between traits). However, when individuals vary sprint speed, the form of selection was
20
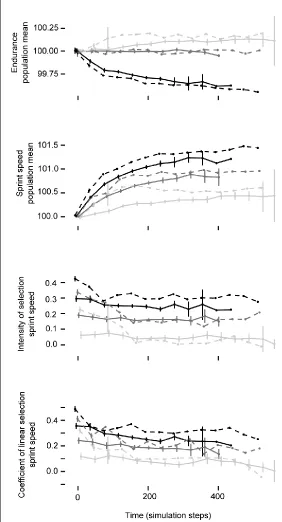
Figure 2: Correlation between traits affects the trajectory of phenotypic change in simulated
populations. For each type of correlation between sprint and endurance (negative – black; none – dark gray; positive – light gray) and performance strategy (individuals only use maximum sprint – dashed line; sprint speed variable – solid line), the mean maximum sprint speed increases over time, but the rate depends on the nature of the correlation between traits. Intensity of selection (isprint) and the coefficient of linear selection (βsprint ) decrease over time and differ depending on the nature of the trait’s
21
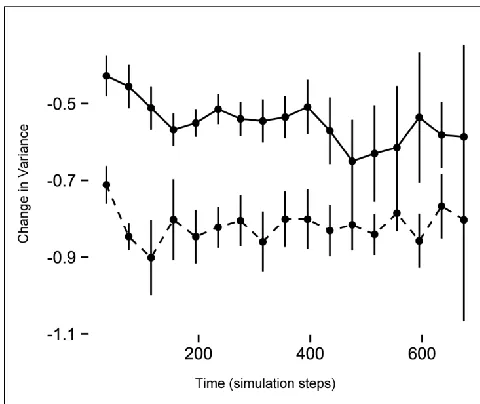
Figure 3: The difference in the change in variance between reproductive events (individuals only use maximum sprint – dashed line; sprint speed variable – solid line). Initially the variance decreases, as directional selection on the first generation truncates the distribution of phenotypes in a population, and this decrease is greater (more negative) in the non-variable group. As populations in either scenario respond to selection, and the mean for sprint speed increases (Fig. 2), selection on high endurance and sprint speed costs further reduces variance. Covariation structure did not significantly alter the trends within variable and non-variable simulations.
Discussion
Explaining the maintenance of higher maximal performance capacities than are typically used in
nature is a persistent problem in evolutionary physiology. We used an individual-based simulation
approach to model the evolution of two correlated performance traits, sprint and endurance, under
conditions of varying and non-varying sprint performance. Our results show that varying sprint
capabilities in a population has clear implications both for the form and intensity of selection and for the
efficiency of the response to selection. Both intensity of selection (isprint) and the linear coefficient of
selection on sprint speed (βsprint) over time follow a similar pattern across the three different trait
correlation conditions, but both metrics overall decrease as the correlation between sprint and
endurance goes from negative to positive. Furthermore, when these traits are positively correlated,
endurance capacity for the population tracks sprint capacity. Because the costs for endurance are much
higher than for sprint speed in our model, this suggests that endurance capacity imposes indirect costs
on high-speed phenotypes, manifesting as stabilizing selection on sprint speed. A positive relationship
22
and fitness to eventually become negative at higher speeds (Fig. 2). Also, as the population’s mean
sprint speed responds to selection and increases over time, the variance is continually reduced by
selection, stemming from indirect costs of high endurance when there is a positive correlation between
sprint and endurance, or from the increasing energetic costs of extremely high sprint speeds when the
correlation with endurance is negative or zero.
The change in sign for term coefficients involving preferred speed from our entire dataset (Table
2A) to just those simulations in which individuals had variable sprint speeds (Table 2B) indicates that
populations that never vary performance experience the same selective pressures in fundamentally
different ways from those that do vary their performance. Surprisingly, selection is not greatly affected
as preferred speed decreases relative to maximal capacity; populations that used preferred speeds
always experienced less intense selection than those that used maximal speeds, but selection intensities
were less influenced by the “level” of preferred performance. Thus, the magnitude of the difference
between maximum and preferred speed does not seem to alter the population’s phenotypic trajectory.
What we may conclude from this is that perhaps specific preferred speeds are not optimal speeds, and
what is optimal is the fact that there is variation in speed at all. Thus, populations in our simulations
could ameliorate the influence of selection on sprint speed simply by not moving at maximal speeds all
the time. The form of selection, as estimated by our best-fit selection models, met our expectations for
simulation runs in which individuals only operated at their maximal sprint speeds, in that the selection
we imposed via predators favored higher sprint capacities, and high costs for high endurance
(exponential cost function) favored intermediate endurance capacities.
Model term Coefficient SE Model term Coefficient SE
A Intercept 0.15 0.009 B Intercept 0.18 0.007
Gen -1.1 x 10⁻⁴ 4.8 x 10⁻⁵ Gen -1.9 x 10⁻⁴ 4.3 x 10⁻⁵
Cov -0.12 0.004 Cov -0.11 0.004
Preferred 9.0 x 10⁻⁴ 1.1 x 10⁻⁴ Preferred -1.0 x 10⁻⁴ 1.0 x 10⁻⁴
Gen x Cov 8.3 x 10⁻⁵ 2.1 x 10⁻⁵ Gen x Cov 6.2 x 10⁻⁵ 2.0 x 10⁻⁵
Gen x Preferred -1.7 x 10⁻⁶ 6.1 x 10⁻⁷ Gen x Preferred 9.8 x 10⁻⁷ 5.7 x 10⁻⁷
23
The behavior of our simulation when individuals vary sprint speed may stem from multiple
sources. While varying performance introduces stochasticity to predator interactions, it may also serve
to artificially increase the cut-off for predator selection away from the mean phenotype, which would
lead to erroneous quadratic estimates (Schluter 1988). Thus, estimating selection without accounting for
intra-individual variation in performance is likely to be misleading. Furthermore, the indirect constraints
on the phenotypic response to selection imposed by the costs of endurance clearly demonstrate the
necessity of multivariate selection analyses. The observed variation in results for selection metrics
involving sprint speed alone (Tables 2, 3; Fig. 2) was explained by differences in correlation with
endurance and with the performance strategy. Therefore, such estimates of the effects of selection on
mean phenotypes of one trait are hardly informative out of context, when other relevant fitness
predictors are not measured (Mitchell-Olds and Shaw 1987).
Model term Coefficient SE
B Intercept 0.25 0.01
Gen -4.5 x 10⁻⁴ 6.8 x 10⁻⁵
Cov -0.13 0.012
Preferred -2.7 x 10⁻⁴ 1.4 x 10⁻⁴
Gen x Cov 2.9 x 10⁻⁴ 7.6 x 10⁻⁵
Gen x Preferred 2.5 x 10⁻⁶ 9.0 x 10⁻⁷
Cov x Preferred 2.3 x 10⁻⁴ 1.7 x 10⁻⁴
Gen x Cov x Preferred -2.1 x 10⁻⁶ 1.0 x 10⁻⁶
Model term Coefficient SE
A Intercept 0.21 0.010 C Intercept 0.25 0.010
Gen -2.3 x 10⁻⁴ 6.0 x 10⁻⁵ Gen -3.8 x 10⁻⁴ 5.9 x 10⁻⁵
Cov -0.12 0.009 Cov -0.11 0.008
Preferred 6.7 x 10⁻⁴ 1.2 x 10⁻⁴ Preferred -2.0 x 10⁻⁴ 1.3 x 10⁻⁴
Gen x Cov 1.5 x 10⁻⁴ 2.6 x 10⁻⁵ Gen x Cov 1.4 x 10⁻⁴ 2.6 x 10⁻⁵
Gen x Preferred -2.2 x 10⁻⁶ 7.6 x 10⁻⁷ Gen x Preferred 1.6 x 10⁻⁶ 7.7 x 10⁻⁷
Cov x Preferred 1.5 x 10⁻⁴ 1.0 x 10⁻⁴ Cov x Preferred -3.4 x 10⁻⁵ 1.0 x 10⁻⁴
Table 3. Best fit model βsprint at each generation of each simulation. Best-fit models for (A.) simulations
with variable and nonvariable sprint speed included together and (B.) variable sprint speed only, as well
24
Model term Coefficient SE Model term Coefficient SE
A Intercept -0.44 0.03 B Intercept -0.47 0.01
Gen -1.4 x 10⁻⁴ 4.5 x 10⁻⁵ Gen -2.5 x 10⁻⁴ 5.0 x 10⁻⁵
Preferred -1.5 x 10⁻³ 3.1 x 10⁻⁴ Cov -0.019 0.01
Table 4. Best fit model for the change in variance during each interval between reproductive events for
for (A.) simulations with variable and nonvariable sprint speed included together and (B.) variable sprint
speed only. When all simulations are considered, (A.) time (Gen) and the percent of maximal sprint
capacity (Preferred) are significant, and the magnitude of the decrease in variance becomes greater over
time. However, when non-variable simulations are excluded (B.), only terms for time and the covariance
between sprint and endurance (Cov) are retained, although the coefficient estimate for the covariance
term is not large compared to its standard error. Thus, within the variable sprint group there is little
difference between simulations with differing preferred speeds.
As per our first hypothesis, intra-individual variation in movement speeds therefore does indeed appear
to “buffer” a population from selection. If we consider the differences in responses between
populations that always employed maximal sprint speed versus those that did not, the former
experienced more intense selection, and an immediate positive shift in the phenotypic distribution for
sprint capacity (Fig. 2), as well as a more dramatic decrease in the variance (Fig.3). While this efficiency
in response to a novel threat is beneficial in the short term, such a response would rapidly erode the
available genetic variation, constraining the potential for adaption in the long-term (Hoffman 2013). In
our simulations the selective pressures were essentially static for the entirety of each run. However,
selective pressures experienced by natural populations may fluctuate (Sinervo and DeNardo 1996;
Siepielski et al. 2009), which could favor lineages employing a conservative bet-hedging strategy that
maintains a low variance in fitness in the long term rather than a less conservative strategy in which
fitness is maximized in the short term (Simons, 2002). Thus, maintaining phenotypic variation in the face
of strong selection may be an optimal strategy ifselective pressures are ephemeral or fluctuate over
time or if adaptive trends reverse (e.g., Losos et al. 2006).
Our second hypothesis states that the selective environment as well as the genetic
underpinnings and correlations between performance traits determine and maintain maximal and
25
response to selection were modulated by the severity of environmental pressures in the form of
predator and resource densities as well as the amount of energy a resource contains. We also found
clear evidence that the genetic correlation between sprint and endurance had a measurable effect on
the trajectory of populations in phenotypic space over time (Fig. 2). A negative correlation with
endurance facilitated a rapid, positive shift in maximal sprint capacity, while a positive correlation with
endurance constrained this response.
Although the effects seen here are specific to the context of our particular energetic paradigm,
these findings nonetheless clearly demonstrate the utility of individual-based simulation approaches to
performance evolution. In building our model, we made a number of simplifying assumptions, as do all
modellers, and while our relatively simplistic model focused on only two correlated traits, we were
nonetheless able to observe emergent variation in the form and intensity of selection given only one or
two changes in parameters. Increasing the complexity of our model will add further biological realism
and allow testing of more detailed hypotheses related to the evolution of whole-organism performance.
For example, by allowing other organismal features such as the size of the energy budget to respond to
selection (via assigning a mode of heritability as we have with performance traits), the model could be
used to predict evolutionary responses in cases in which species adjust energy acquisition rather than
“choose sides” in an energetic trade-off (Roff and Fairbairn 2012). Furthermore, for more realistic
long-term data, the model can be adjusted to include dynamic predator-prey interactions (e.g. Brodie and
Ridenhour 2003). We chose to measure only a maximum of 15 generations for each simulation as we
would expect a real population to experience a change in environmental and genetic conditions over
that span (Roff and Fairbairn 2012). To focus on variation in selection in the short-term response to only
intra-individual variation in sprint speed and its genetic correlation with endurance, we chose to
disregard co-evolution in our initial model, nor do we consider evolved changes in the genetic
correlations between traits or in performance-use strategy. However, incorporating the evolution of
these parameters is feasible and interpretable within the simulation framework presented here.
While collecting real-world performance data is still limited by logistic constraints, there has
been a positive trend towards measuring multiple traits (see Lailvaux and Husak 2014). This inclusive
approach is necessary to avoid the pitfalls of taking things out of the integrated organismal context, such
as making inferences about selection on one trait while ignoring relevant, covarying traits also under
selection (Mitchell-Olds and Shaw 1987; Ghalambor et al. 2004; Hall et al. 2010; Lailvaux and Husak
2014). Organismal data always constitute a snapshot of the present, yet are representative not only of
26
us to preserve this complexity and create what are essentially a vast number of artificial selection lines
for which we can acquire complete, longitudinal data on fitness and phenotype in the context of known
environmental parameters. Beyond quantifying current trait distributions in study populations, we have
shown that considering such data in the context of a complex, explicitly modelled system is both feasible
and capable of alerting investigators to many varied explanations bridging ecological processes and the
evolutionary dynamics of performance.
In conclusion, individual-based simulations represent a promising approach to understanding
the origins and maintenance of whole-organism performance capacities, as well as for testing
hypotheses regarding their evolutionary trajectories. Using a relatively simple model, we have shown
that intra-individual variation in realized performance results in less intense selection on performance
regardless of the extent of variation, and furthermore that the evolutionary trajectories of multiple
performance traits dependent on a common pool of resources are affected by the nature of the
bivariate correlation between them. Future iterations of this model will be able to test further scenarios
of the evolution of performance under a variety of ecologically relevant conditions.
Funding
This work was not supported by any funding agency. Travel to this meeting was in part funded by the
University of New Orleans Department of Biological Sciences.
Acknowledgements
We would like to thank J. Husak and R. Wilson for inviting us to participate in this symposium. We also
thank R. Brooks for valuable discussion and L. J. Elhaj for significant technical support.
References
Bell G. 2010. Fluctuating selection: the perpetual renewal of adaptation in variable environments. Philos
T R Soc B. 365(1537):87-97.
Bennett, AF. 1982. The Energetics of Reptilian Activity. in Biology of the Reptilia Vol. 13. Gans C, Pough,
FH, Eds. London, Academic Press Inc. p.155-194.
Bennett AF, Huey RB. 1990. Studying the evolution of physiological performance. In: Futuyma DJ,
Antonovics J, editors. Oxford Surveys in Evolutionary Biology. Oxford: Oxford University Press. p.
251-284.