* Corresponding author. Tel: +98217724-5063. E-mail: [email protected]( F. Barzinpour)
© 2013 Growing Science Ltd. All rights reserved. doi: 10.5267/j.ijiec.2013.02.001
International Journal of Industrial Engineering Computations 4 (2013)227–240
Contents lists available at GrowingScience
International Journal of Industrial Engineering Computations
homepage: www.GrowingScience.com/ijiec
A novel framework in complex network analysis: Considering both structure of relations and individual characteristics in closeness centrality computation
F.Barzinpour* and B. H. Ali Ahmadi
Department of Industrial Engineering, Iran University of Science and Technology, Tehran, Iran C H R O N I C L E A B S T R A C T
Article history:
Received October252012 Received in revised format December 28 2012
Accepted January30 2013 Available online 1February2013
In this paper, we develop a novel framework for defining radial measures of centrality in complex networks. This framework is based on the combination of two approaches: social network analysis and traditional social science approach by considering both structure of relations and individual characteristics. It is always an important issue to detect communities in complex networks as efficiently as possible to understand both the structure and function of the networks and to interpret radial centrality measures. Therefore, we propose spectral clustering by determining the best number of communities as a prerequisite stage before finding radial measures. Based on the proposed framework, an algorithm to compute the closeness centrality in complex networks is developed. We test the proposed algorithm on Zachary’s karate club network, which is considerably used as a benchmark for community detection in a network. The preliminary results indicate that the new method is efficient at detecting both good inter-cluster closeness centrality and the appropriate number of clusters.
© 2013 Growing Science Ltd. All rights reserved
Keywords:
Complex networks Social network Community structure Spectral clustering Closeness centrality Node attribute
1. Introduction
The recent advances on complex networks represent an essential area of multidisciplinary research including physics, mathematics, chemistry, biology, social sciences, and information sciences, among others. These systems are commonly represented by (un)directed graphs techniques, which consist of sets of nodes representing the objects under investigation such as people or groups of people, molecular entities, computers, etc., joined together in pairs by links,showing the corresponding nodes are related by some kind of relationship. These networks include the Internet, World Wide Web, social networks, information networks, neural networks, food webs, reaction and metabolic networks, and protein– protein interaction networks(Estrada& Rodríguez-Velázquez, 2006; Mello et al., 2009).
Agarwal et al., 2011).One of the key problems in complex networks is how to detect community structures, which have dense internal links and a lower density of external links. Many studies have verified the community structure in various complex networks (for review papers see Newman(2004)and Fortunato(2010), and a comparison paper seeDanon et al.(2005)). For example, in protein-protein interaction networks, communities are likely to group proteins having the same specific function within the cell, in the graph of the World Wide Web they may correspond to groups of pages dealing with the same or related topics. In metabolic networks they may be associated with functional modules such as cycles and pathways, in food webs they may identify compartments, in economy they may represent a set of tightly coupled stocks or industrial sectors, and so on (Niu et al., 2008; Pollner et al., 2008; Zhang et al., 2007; Ghosh et al., 2011).
Clearly, the ability to detect community structure in a network has important practical applications. For instance, it can help us reduce complex networks to much simpler systems, since there is a growing need to deal with huge real-world networks and few of the existing methods scale up to large graphs (Liu & Liu, 2010). It gives us insights into the structure-functionality relationship (Ma et al., 2010) and can help us understand the network system, well.
Community detection plays important role for interpreting centrality measures; because identifying clusters and their boundaries allow for a classification of vertices based on their structural position in the modules. Therefore, vertices with a central position in their clusters, i.e. sharing large number of edges with other group partners, may have an important function of control and stability within the group. In addition, vertices lying at the boundaries among modules play an important role of mediation and lead the relationships and exchanges among different communities (Fortunato, 2010). On the other hand, some measures of centrality assign correct centrality scores only if the network has a core-periphery structure in which all nodes revolve more or less closely around a single core. Therefore, without such a cluster analysis, we cannot proceed with developing these kinds of centrality measures.
An individual’s propensity to make new connections may influence the extent and value of his or her social network. The effect of individual characteristics on social networks is important because empirical studies of the consequences of networks have discovered associations among the number, structure, strength and content of network ties and a range of individual and organizational outcomes, including personal influence, job performance, innovation, career success, satisfaction and affect (Bidart&Lavenu, 2005; Hu & Wang, 2012; Lippert&Spagnolo, 2011; Liu, 2011; Louch, 2000; Reagans, 1998; Simon &Tellier, 2011;Totterdell et al., 2008; Valente & Foreman, 1998).
Although social network research has examined the influence of observable individual attributes, such as gender, it has largely ignored the individual psychological characteristics that may shape personal networks. This is due, in part, to the fact that social network research has been principally concerned with the structure and effects of relations among people, groups or organizations, rather than on psychological attributes of the individuals. Nevertheless, such attributes are likely to contribute to the formation and maintenance of ties among people within networks. It will thereby impact the behavior of those networks (Borgatti& Everett, 1999). This conception, in which both individual agency and social structure determine action, offers an alternative to a strict structural perspective in which action derives solely from the structure of social networks.
As mentioned earlier, this work makes a novel framework on complex networks analysis by considering individual characteristics as well as structure of relations and it introduces an extended and improved algorithm to find closeness centrality that has five valuable advantages at the same time:
• The algorithm is suitable for (un)weighted, (un)directed graphs.
• It maps graph to separate nodes clustered via data clustering techniques and does not need clustering methods in graphs.
• Its dimensionality reduction (from n×n matrix to n×k matrix, (k<n)) makes computations
much simpler.
• It converts person-to-person data to person-to-attribute and provides the opportunity to
consider individual’s characteristics beside relations structure.
The present paper also validates the proposed algorithm on a real-world social network, Zachary’s karate club, which is by far the most investigated system used as a benchmark to test community detection algorithms. This network was the only standard network in Social Network Analysis (SNA) context we could find which has some information about vertices’ individual characteristics.
The remainder of the paper is organized as follows: The subsequent part, Section2, introduces the necessary background and notations. Then, in Section 3, three main problems in this context, which are derived from reviewing the related literature, are discussed and, their solutions introduced. The proposed framework and algorithm based on these solutions is then represented. Furthermore, section 4 applies the proposed algorithm to a commonly used benchmark for community-finding and compares the results to various state-of-the-art techniques. Finally, in section 5, conclusions and remarks as well as further works are presented.
2. Basic concepts
2.1. Centrality
Social Network Analysis (SNA) focuses on depicting the structure of the group, the most important members in it and the influence of the structure on individuals (Wasserman&Faust, 1994). Based on this, there are several measures, which help to identify key members or the most important members in the network as well as the underlying structure of the network itself. Among all introduced measures, four measures stand out as foundational in our field: degree, closeness, betweenness, and eigenvector centralities. Their prominence within the field of network analysis stems from the fact that they all have strong yet distinct theoretical underpinnings and that they are frequently applied for empirical analysis of social systems (Borgatti et al., 2006; Kuhnert et al., 2012). For these reasons, we will restrict the present paper to these four measures and introduce them as Guzman (2008) suggested:
• Degree Centrality (introduced by Nieminen (1974)): considers the number of connections at a
specific node (in directed graphs it is measured using the in-degree and out-degree as measures). This attribute is used as a surrogate for a measure of the level of potential communication activity from a specific node. The easier it is for an individual to communicate directly with others, the more degree centrality that individual has.
• Closeness Centrality (proposed by Sabidussi (1966)): represents a measure of the sum of the
geodesic distances between a specific node and the remaining nodes in the network. The lower the sum, the greater the centrality. A node is more "central" if it is closer to many more nodes than any other node. It also stands for a level of independence for a given node. When a specific node has the ability to communicate with many other nodes and has a minimum number of intermediaries, it is more autonomous and thus has higher independence.
• Betweenness Centrality (developed by Freeman (1979)): focuses on the ability to communicate
• Eigenvector centrality (presented by Bonacich (1987)): is based on the largest characteristic
eigenvalue of the adjacency matrix. In other words, it assesses a person’s centrality as a function of the centrality of the people, which is associated. This means that rather than measuring the extent in which a given actor “knows everybody”, it measures the extent to which the actor “knows everybody who is anybody (Borgatti& Everett, 2006).
Some centrality measures such as all degree-like, closeness-like and eigenvector-like measures evaluate volume or length of the walks (A walk from node u to node v is a sequence of adjacent nodes which
begins with u and ends with v and may have repeated nodes or edges) that emanate from or terminate
with a given node. Social network researchers refer to these as radial measures. Another kind of centrality measures which assess the number of walks that pass through a given node, are called medial measures, including all betweenness-like measures. The distinction between radial and medial measures is called Walk Position, which determines type of nodal participation (Borgatti& Everett, 2006). It is obvious that all centrality indices evaluate an overall summary of a node’s involvement in the walk structure of the network. It is a measure of how much of the walk structure is dependent on a given node but one may raise the question: under what conditions is it reasonable to summarize, with a single value, a node’s cohesion with all others? Consider the mean of any list of numbers. It can always be computed, but only serves as a summary when the distribution of the numbers is unimodal. Therefore, if the list is known to be normally distributed, one can produce the entire distribution by the mean and standard deviation. However, if the shape of the distribution is bimodal, the mean is a very
poor summary. For example, imagine the ideal serving temperature of milk is in the range of 30–45◦
for much of the population (because they like iced milk), and the ideal serving temperature for the other half of the population is in the range of 120–150◦ (because they like hot milk). Now, does the average of the ideal temperatures identify a good assessment of the population’s tastes? In other words, does a luke-warm temperature of 86.25◦ provide a right picture of what the people’s tastes are? Apparently not.According to Borgatti and Everett (2006) a radial centrality measure is unmistakably interpretable in a network which has unimodal dyadic cohesion, but not in one which has multimodal type. Namely, radial centrality makes sense in networks, which have, at most, one center and would not be partitioned in two or more components.
If a network contains more than one subgroup, eigenvector centrality will specify zeros to all nodes not in the largest subgroup, even if they are highly central in their own subgroup. Rather, those nodes load highly on the remaining eigenvectors. That is to say, the eigenvectors of a cohesion matrix measure strength of involvement of each node to each major component (subgroup).
A usual image in SNA and other fields is that of the core/periphery structure. Given its wide currency, it comes as a gap in related literature that the notion of a core/periphery structure is not often tested before computing a radial measure of centrality. It should be mentioned that medial centrality measures do not make the same one-group assumption. These measures correctly determine high centrality scores to nodes serving as bridges among components. Nevertheless, it is still the case that it is difficult to interpret a given value of medial centrality without specifying the group’s cohesive structure.
2.2. Spectral clustering approaches
In this section, we shall follow the nice tutorial by Fortunato (2010), with the focus on spectral clustering. Spectral clustering is made up of a change of representation of the initial set of objects into a set of points in space, whose coordinates are elements of eigenvectors: the obtained set of points is then clustered via standard techniques, like k-means clustering. Here a question is when one can directly
cluster the initial set of objects by applying the similarity matrix and why it is required to cluster the points resulting from the eigenvectors. The underlying fact is that the transformation induced by the eigenvectors makes the cluster properties of the initial data set much more obvious. In this way, spectral clustering is able to resolve data points, which could not be separated by applying direct k
-means clustering, for example one reason is that the latter tends to deliver convex sets of points. The Laplacian, which is by far the most used matrix in spectral clustering,is given by
, (1)
whereA is the adjacency matrix and D is the diagonal matrix whose elements are the vertex degrees. In
general, using the eigenvectors of the Laplacian, L, in spectral clustering is more promising and
applying A (or of its weighted counterpart W) is not reliable. In this way, from the components of the
eigenvectors one can identify the components of the graph. If a graph consists of k components, which
are disconnected from each other, its Laplacian has k zero eigenvalues. Otherwise, if the graph is
connected, but has k sub graphs which are weakly linked to each other, the spectrum of the Laplacian
will have one zero eigenvalue, with all others being positive. However, the lowest k-1 non-vanishing
eigenvalues are still close to zero. For instance, let us consider the n×k matrix, V, whose columns are
the k eigenvectors above mentioned. The n rows of Vare used to represent the graph vertices in a k
-dimensional Euclidean space, through a Cartesian system of coordinates. Therefore, techniques like k
-means clustering can clearly distinguish k groups of points, with the points of each group localized
close to each other and far from the other groups.
By reversing this argument, the number of clusters of a graph which has to be given as input, could be derived by checking whether there is an integer k such that the first k eigenvalues are small and the (k+1)-th is relatively large. However, when the clusters are very mixed with each other, it may be hard
to identify significant gaps between the eigenvalues.
2.3. Considering nodes attributes
Nowadays, even traditional social scientists are concerned with the structure and effects of relations among people, groups or organizations. People normally deal with networks more than individuals do, so in this paper we choose the network analysis paradigm but we also consider individuals attributes since such attributes influence the formation and maintenance of relationships among people within networks, and will thereby impact the behavior of those networks. This idea, in which both individual agency and social structure give direction to action, presents an alternative to a narrow structural perspective in which action originates exclusively from the structure of social networks or from the personal characteristics.
3.
Closeness centrality in complex network by considering both structure of relations and
industrial characteristics
3.1. General framework for computing closeness centrality in complex networks
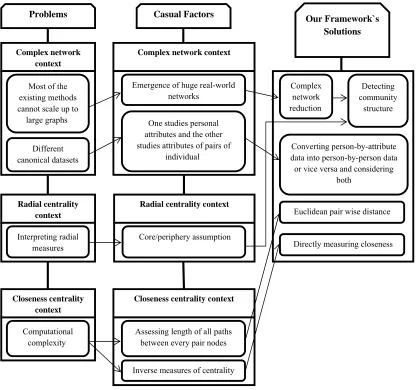
The resulting structure shown in Fig.1 is based on points mentioned in previous sections, classifies a series of problems, their casual factors and proposals for solutions and specifies the general framework in which every radial measures of centrality can be assessed and interpreted, properly.
Fig. 1 General framework for computing closeness centrality in complex networks
Our proposed solutions are then applied for the algorithm offered for computing closeness centrality in complex networks. The resulted framework indicates three main challenges; the first challenge in
Radial centrality context
Interpreting radial measures
Complex network context
Most of the existing methods cannot scale up to
large graphs
Different canonical datasets
Closeness centrality context
Computational complexity
Problems Casual Factors
Radial centrality context
Core/periphery assumption
Our Framework`s Solutions
Complex network context
Emergence of huge real-world networks
One studies personal attributes and the other studies attributes of pairs of
individual
Complex network reduction
Detecting community
structure
Converting person-by-attribute data into person-by-person data or vice versa and considering
both
Euclidean pair wise distance
Directly measuring closeness
Closeness centrality context
Assessing length of all paths between every pair nodes
complex network context is that in latest years we have encountered an unpredictable growth of interest and activity, which regards the structure and dynamics of complex networks. This is as a result of the appearance of motivating and challenging new cases of complex networks such as the internet and wireless communication networks.
Moreover, network models have become standard tools in social science, economics, the design of communication and transportation systems, banking systems, etc. In view of the fact that these networks are in general very complex and not many of the methods upgrade to large graphs, it is advantageous to see whether they can be cut down to much simpler systems. Particularly, much effort has gone into splitting networks into small numbers of communities. On the other hand, differential focus in traditional social science (which studies personal attributes) and social network analysis (studies attributes of pairs of individuals) is a considerable challenge too. Converting person-by-attribute data into person-by-person data or vice versa and considering both individual agency and social structure is our proposed solution to this challenge. In the second challenge, which occurs in radial centrality context, as a result of core/periphery assumption, radial measures may be assigned and interpreted, improperly. Therefore, determining whether the network satisfies the one-group requirement must be accomplished first and if the network contains more than one component, subgraph radial indices should be assigned. The last challenge is the computational complexity in closeness centrality context, which is detailed in section 3.3.
3.2. The proposed algorithm
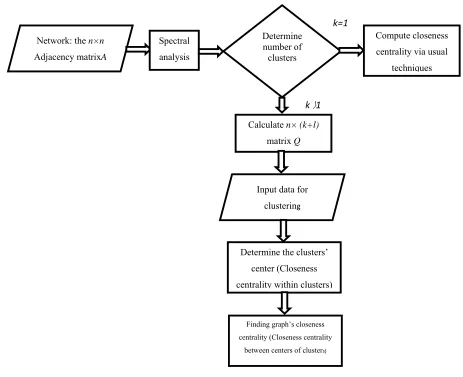
Based on the framework presented in Section 3.1, we propose an algorithm (Fig.2) consisting of the following steps:
• Form the input datasets according to the spectral analysis
• Given the input datasets. (For complex networks, these datasets is described by the
adjacency matrix such that Aij= 1if node i and j are connected by an edge and Aij= 0
otherwise.)
• Define D to be the diagonal matrix whose (i, i)-element is the sum of A’s i-th row, which
represents the degree of the node i. Then construct the normalized Laplacian, which is
defined as follows,
(2) • Find k nontrivial eigenvalues of the normalized Laplacian, Lrw, such that the first k
eigenvalues of Lrw are small and the (k+1) -th is relatively large; where k is the number of
clusters.
• Preparing a matrix as an input for clustering
• If k=1, then network has core-periphery structure; Compute closeness centrality via usual
techniques.
• If k>1, then Computinga n×k matrix, V, whose columns are eigenvectors of Lrw.
• Adding l attributes of individuals nodes to have a n×(k+l) matrix Q as an input for
clustering.
• Given the input matrix, Q and number of clusters, k, cluster the nodes using usual techniques like k
-means.
• Determine center of clusters (Closeness centrality within clusters).
• Finally, compute graph’s closeness centrality (Closeness centrality between centers of clusters).
3.3. Computational complexity
pairwise distances. The other steps of the framework, like computing the Laplacian matrix have insignificant computational cost compared with the computation of those mentioned above. All closeness centralities need computing distance matrix D (Borgatti& Everett, 2006).
Fig. 2 Data flow of the proposed algorithm
Freeman’s measure, closeness depends on geodesic distances where each dij entry in the geodesic
distance matrix can be viewed as the minimum of the vector of lengths of all paths from i to j. In spite
of this, if we do not suppose that a given substantive observable fact, such as diffusion of information, always makes use of the shortest paths, it implies to take into account all paths from i to j, perhaps by
choosing the median or mean length of all paths. The hardship in all this, is that they oblige defining all walks among every pair of nodes and assessing their length. However, our proposed measure uses the
adjacency matrix A, and pairwise Euclidean distance which makes the computation much faster than
that of the pairwise geodesic distances. In spite of this, other variants of closeness are inverse measures of centrality, because larger values specify less centrality. As a result, they technically measure farness rather than closeness (Borgatti& Everett, 2006) but our index is a direct measure of closeness (rather than farness) and does not need any transformation.
The spectral mapping necessitates computing the eigenvectors of potentially very large matrices. Though this may be computationally cost-effective, some concepts make this step actually faster. Primarily, in spectral mapping, approximating all the eigenvectors is not necessary, and in such circumstances, the classical speed-up techniques can be used for finding only the eigenvectors corresponding to the top eigenvalues. If further speed-up is required, classical techniques from Kernel
Network: the n×n
Adjacency matrixA
Spectral analysis
Determine number of clusters
Compute closeness centrality via usual
techniques
Calculate n× (k+l)
matrix Q
Input data for
clustering
Determine the clusters’ center (Closeness centrality within clusters)
Finding graph’s closeness centrality (Closeness centrality
between centers of clusters)
k=1
methods can be applied, where the eigenvectors are determined for a subset of the surface points, and then interpolated to the rest (Mahmoudi&Sapiro, 2009).
4.
Experimental results
4.1. Dataset description
Testing an algorithm implies applying it to a particular problem whose solution is identified and comparing such solution with that provided by the algorithm. In order to test our method on such networks, we have a big limitation, finding a standard dataset in which there are some precise information about the vertices and their properties as well as the relationships and edges among them. Since, as mentioned before, almostall network analysts focus on attributes of edges in a network, while on the other hand, social science researchers are interested in individual characteristics of vertices in a network.
Finally, we consider the well-known karate club friendship network studied by Zachary (1977), which has grown to be a commonly used benchmark for testing community-finding algorithms (Arenas et al., 2008; Duch& Arenas, 2005; E et al., 2008; Estrada, 2011; Fortunato et al., 2004; Girvan & Newman, 2002; Li et al., 2009;Newman, 2004, 2006a, 2006b; Newman & Girvan, 2004; Radicchi et al., 2004; Reichardt&Bornholdt, 2004; Wu &Huberman, 2004; Zhang et al., 2008; Zhang et al., 2011; Zhou, 2003). It is composed of 34 vertices, the members of a karate club in the United States, who were studied during a period of three years. Some individuals who were detected to interact outside the activities of the club are connected by edges. Sometime later, a conflict between the club president and the instructor causes the fission of the club into two separate factions, supporting the instructor and the president, respectively. Here, the question is whether the real partition in two social groups could be calculated from the graph topology.
4.2. Experimental settings and parameter tuning
We use the ‘faction’ feature in Zachary`s work (1977) as a node attribute which is added to edge attributes after mapping them in spectral space. ‘Faction’ gives the factional affiliation of the individual, either with that of John A. (the officer), or that of Mr. Hi (the instructor), or none. The strong/weak designations in this feature indicate whether the individual was a strong or a weak supporter of the faction's ideological position. We deal with this feature as an ordinal variable that varies from 1(John strong) to 5(Hi strong).
The other issue is the choice of the Laplacian matrix to use in this application; because the graph vertices do not have the same or similar degrees, the choice of the Laplacian significantly influences the results. Since in most cases, normalized Laplacians are more promising and of the normalized Laplacians, Lrw is more reliable, we choose Lrw as our Laplacian matrix.
Main computational stages of our algorithm are performed by using appropriate software; we use MATLAB for computing eigenvalues and vectors, SPSS Clementine for clustering, and UCINET for assessing centralities.
4.3. Results and discussions
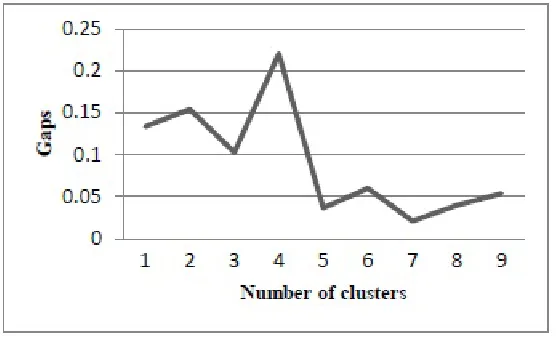
Based on our algorithm, we find eigenvalues of the normalized Laplacian, Lrw; Because first three
nontrivial eigenvalues were still close to zero, and that the forth was clearly different from zero, the vertex vectors of the first three nontrivial eigenvectors should still enable us to clearly distinguish the clusters in a 3-dimensional space and 4 communities would be the best partitioning of the network. Fig.3 shows the size of the eigen-gap between pairs of consecutive eigenvalues of the matrix Lrw, as a
correspond to elements of first three nontrivial eigenvectors, which is obtained from relationships among nodes (edges), and one feature corresponds to nodes ‘faction’ attributes. Results of our clustering with different community numbers done by SPSS Clementine software confirm this, i.e. four communities made less Sum of Squared Error (SSE).
Fig. 3.Functional representation of the gaps between pairs of consecutive eigenvalues of the matrix and
number of clusters
However, different clustering methods based on optimizing various modularity functions have proposed the same cluster numbers. For example, Fortunato (2010) proposed four clusters based on the best partition found by optimizing the modularity of Newman and Girvan (2004), and based on multi-resolution method by Arenas et al. (2008) indicated the most stable partition was two clusters. However, the partition obtained with straight modularity optimization consists of four clusters, which is less stable, Liu and Liu (2010) showed the community structure obtains the greatest modularity could be of four clusters, etc.
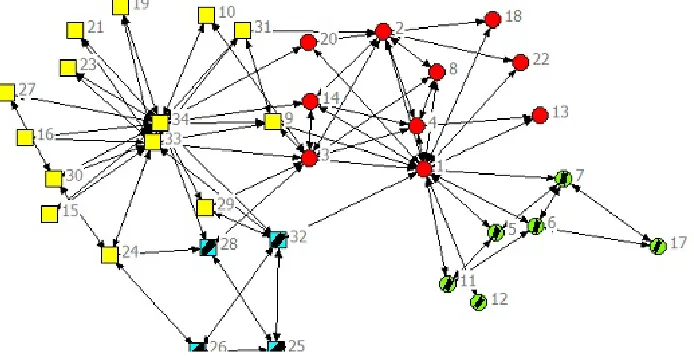
Fig.4 and Table 1 show results of applying our method on Zachary’s karate club network. In Table 1, the column named ‘Node with highest closeness centrality within each cluster’ determines the closest node to the cluster center, which is determined by k-means clustering technique. Since node 34 has less
‘Sum of proximities with other cluster centers’, it is obvious that node 34 has the greatest closeness centrality among these four central nodes and, thus, it is the whole network’s closeness centrality. In this case, our data were partitioned into two clusters via proposed method. The results obtained exactly match the social fission observed by Zachary (1977).
In order to examine the effect of considering individual node attributes on the results, we clustered 3 field data (removing ‘faction’ attribute) by our proposed method in two communities; which leads to 12 nodes misclassified as compared to the real fission in the karate club.
Fig. 4. Zachary`s karate club network. Squares and circles indicate the two communities observed by
Zachary, colors denote the subdivision found by our algorithm.
Table 1
Results of applying the proposed method on Zachary’s karate club network Cluster Number
of nodes
Nodes Cluster center Node with highest
closeness centrality within cluster
Sum of proximities with other cluster
centers 1 10 N1, N2, N3, N4, N8, N13, N14, N18,
N20,N22
(-0.082,0.184,0.026,0.0875) N2 2.82
2 4 N25, N26, N28, N32 (0.138, -0.129, -0.376, 0.062) N26 3.07
3 6 N5, N6, N7, N11, N12, N17 (-0.3,-0.268,-0.011,0.917) N11 2.95
4 14 , N9, N10, N15, N16, N19, N21, N23, N24, N27, N29, N30, N31, N33, N34
(0.132,-0.051,0.117,0.125) N34 2.77
Table 2
Closeness centrality analysis without clustering as a preprocessing stage, done by UCINET software
Node 1 2 3 4 5 6 7 8 9 10 11 12 13 14 15 16 17
Closeness centrality
56 48 55 46 37.9 38 38 44 51 43 37.9 36.6 37 51 37 37 28
Rank 1 7 2 8 15 14 14 11 4 12 15 18 17 4 17 17 20
Node 18 19 20 21 22 23 24 25 26 27 28 29 30 31 32 33 34 Closeness
centrality 37.5 37 49 37 37.5 37 39 37.5 37.5 36.2 45.8 45.2 38 45.8 54 50 54
Rank 16 17 6 17 16 17 13 16 16 19 9 10 14 9 3 5 3
which interaction took place between the two individuals involved and can call group members for meeting faster than others. This means they are not necessarily faction’s leader.
5.
Conclusions and future works
We have introduced a new algorithm based on a general framework aimed at computing closeness centrality in complex networks in an efficient and systematic way. The method combines spectral techniques, considering individual node attributes, and cluster analysis as preprocessing stages.
The nodes of the network are projected into a D-dimensional space, where D is a number of first
nontrivial eigenvectors of the Laplacian matrix; their coordinates are the node-projections on each eigenvector. Then nodes attributes are added and by computing Euclidean distance in such an
eigenvector space, k-means clustering technique are employed to generate network`s partition in
communities. The number of clusters giving the maximum modularity is taken as the output of the algorithm for a fixed D. It has also been discussed that in conditions where the clusters are not very
mixed with each other, D can be determined by assessing gaps between eigenvalues, providing a way
to avoid computing all or large number of eigenvalues, which significantly reduces computational complexity, and maximizes the modularity by defining the best number of communities as an input of clustering and thus enhance the performance of the method. The best results are obtained using both edge structure and node attributes.
Even if assessing closeness centrality have been profusely discussed before, we believe that our algorithm represents a step forward in studying complex networks, as it combines spectral techniques with (i) the novel concept of considering both node and edge attributes, which provide a link between traditional social studies and modern network research and (ii) a way to optimize the number of eigenvalues taken into consideration.
An interesting result we can see in this experiment is that by clustering the network as a preprocessing stage, the picture of the network after fission which happened later, is obvious. This again confirms that individual characteristics effect networks future status. Challenges in SNA can be classified into three broad areas: instance modeling, evolution modeling, and predictive modeling (Kaza, 2008). Instance modeling concentrates on the study of static network properties, evolution modeling investigates factors behind network growth, and predictive modeling looks at recognition of hidden and future network links. This essay focuses on instance modeling and examines the role of node status in network’s centrality. It is found that centrality indices as measured by both considering edge and node attributes can help us in evolution and predictive modeling.
Further work will be devoted to the extension and to the study of other centrality measures that lie in our proposed framework as well as the development of new clustering algorithms dealing, for instance, with other dissimilarity measures (for instance weighted distance, parametric Pearson product moment correlation, or angular distance (Yen et al., 2009)). We will also investigate the possibility of adapting multiple contexts (layers). Moreover, it would be interesting to study the behavior of the proposed algorithm in other real complex networks of larger size.
References
Agarwal, P., Sahai, M., Mishra, V., Bag, M., & Singh, V. (2011). A review of multi-criteria decision making techniques for supplier evaluation and selection.International Journal of Industrial Engineering Computations, 2, 801-810.
Bidart, C., &Lavenu, D. (2005).Evolutions of personal networks and life events.Social Networks, 27,
359-376.
Bonacich, P. (1987). Power and centrality: a family of measures. American Journal of Sociology, 92,
1170-1182.
Borgatti, S. P., & Everett, M. G. (1999).Network Analysis of 2-Mode Data.Social Networks, 19,
243-269.
Borgatti, S. P., & Everett, M. G. (2006).A Graph-theoretic perspective on centrality.Social Networks,
28, 466-484.
Borgatti, S. P., Carley, K. M., &Krackhardt, D. (2006).On the robustness of centrality measures under conditions of imperfect data.Social Networks, 28, 124-136.
Danon, L., Duch, J., Diaz-Guilera, A., &Arenas, A. (2005).Comparing community structure identification.Journal of Statistical Mechanics, 09008.
Donetti, L., &Muñoz, M.A. (2004).Detecting network communities: a new systematic and efficient algorithm. Journal of Statistical Mechanics, 10012.
Duch, J., &Arenas, A. (2005). Community detection in complex networks using external optimization.
Physics Review E, 72, 027104.
E, W., Li, T., &Vanden-Eijnden, E. (2008).Optimal partition and effective dynamics of complex networks.Proceeding of the National Academy of Sciences USA, 105 (23), 7907-7912.
Estrada,E. (2011).Community detection based on network communicability. Chaos, 21, 016103.
Estrada, E.,&Rodrı´guez-Vela´ zquez, J. A. (2006).Subgraph centrality and clustering in complex hyper-networks.Physica A, 364, 581-594.
Fortunato, S., (2010).Community detection in graphs.Physics Reports, 486, 75-174.
Fortunato, S., Latora, V., &Marchiori, M. (2004). Method to find community structures based on information centrality.Physics Review E, 70, 056104.
Freeman, L. (1979). Centrality in social networks: Conceptual clarification. Social Networks, 1,
215-239.
Ghosh, T., Sengupta, S., Chattopadhyay, M., & Dan, P. K. (2010). Meta-heuristics in cellular manufacturing: A state-of-the-art review. International Journal of Industrial Engineering Computations.
Girvan, M.& Newman, M. (2002).Community structure in social and biological networks. Proceeding of the National Academy of Sciences USA,99 (12), 7821-7826.
Guzman,M. (2008).A probabilistic programming approach in the analysis of social networks, Master
thesis, University of Arkansas, Arkansas.
Hu,H., & Wang, X. (2012). How people make friends in social networking sites—A microscopic Perspective. Physica A, 391, 1877.
Jabal-Ameli, M. S., Aryanezhad, M. B., & Ghaffari-Nasab, N. (2011). A variable neighborhood descent based heuristic to solve the capacitated location-routing problem. International Journal of Industrial Engineering Computations, 2(1), 141-154.
Kaza,S.(2008).Instance, evolution, and predictive modeling of social networks, PhD thesis, The
University of Arizona.
Kuhnert,M. T.,Geier, C.,&Elger, C. E. (2012). Identifying important nodes in weighted functional brain networks: A comparison of different centrality approaches.Chaos, 22, 023142.
Li, T., Liu, J.,& E., W. (2009).Probabilistic framework for network partition.Physics Review E, 80,
026106.
Lippert, S., Spagnolo, G. (2011).Networks of relations and Word-of-Mouth Communication.Games
and Economic Behavior, 72, 202-217.
Liu,C. (2011).The effects of innovation alliance on network structure and density of cluster.Expert Systems with Applications, 38, 299-305.
Liu,J., & Liu, T. (2010).Detecting community structure in complex networks using simulated annealing with k-means algorithms. Physica A, 389, 2300-2309.
Ma, X., Gao, L., Yong, X., &Fu,L. (2010).Semi-supervised clustering algorithm for community structure detection in complex networks. Physica A, 389, 187-197.
Mahmoudi,M., &Sapiro,G. (2009).Three-dimensional point cloud recognition via distributions of geometric distances.Graphical Models, 71, 22–31.
Mello, B.A., Batistuta, L.H., Boueri,R., &Cajueiro, D.O. (2009).Measuring the flow of information among cities using the diffusion power.Physics Letters A, 374, 126-130.
Newman,M. (2004).Detecting community structure in networks.European Physical Journal B, 38,
321-330.
Newman, M., &Girvan, M. (2004).Finding and evaluating community structure in networks. Physics
Review E, 69 (2), 026113.
Newman,M. (2006a). Finding community structure in networks using the eigenvectors of matrices.Physics Review E, 74, 036104.
Newman, M. (2006b).Modularity and community structure in networks. Proceeding of the National
Academy of Sciences USA, 103 (23), 8577-8582.
Nieminen, J. (1974). On centrality in a graph.Scandinavian Journal of Psychology, 15, 322-336.
Niu, Y. Q., Hu, B. Q., Zhang, W., & Wang, M. (2008).Detecting the community structure in complex networks based on quantum mechanics. Physica A, 387, 6215-6224.
Pollner, P., Palla, G., Ábel, D., Vicsek, A., Farkas, I. J., Derényi, I., &Vicsek,T. (2008).Centrality properties of directed module members in social networks. Physica A, 387, 4959-4966.
Radicchi, F., Castellano, C., Cecconi, F.,Loreto, V.&Parisi, D. (2004).Proceeding of the National Academy of Sciences USA, 101, 2658-2663.
Reagans,R. (1998). Differences in social difference: examining third party effects on relational stability.Social Networks, 20, 143-157.
Reichardt, J.,&Bornholdt,S. (2004).Detecting fuzzy community structures in complex networks with a Potts model.Physical Review Letters, 93, 218701.
Sabidussi, G. (1966). The centrality index of a graph.Psychometrika, 31, 581-603.
Simon, F., &Tellier, A. (2011). How do actors shape social networks during the process of new product
development? European Management Journal, 29, 414-430.
Totterdell,P., Holman, D., &Hukin, A. (2008).Social networkers: Measuring and examining individual differences in propensity to connect with others. Social Networks, 30, 283-296.
Valente, T. W.,& Foreman, R. K.(1998).Integration and radiality: measuring the extent of an individual`s connectedness and reachability in a network. Social Networks, 20, 89-105.
Wasserman, S.,& Faust, K. (1994).Social Network Analysis: Methods and Applications.
Cambridge:Cambridge University Press.
Wu,F., &Huberman, B.A. (2004).Finding communities in linear time: a physics approach.European
Physical Journal B, 38, 331-338.
Yen, L., Fouss, F., Decaestecker, C., Francq, P.,&Saerens, M. (2009). Graph nodes clustering with the
sigmoid commute-time kernel: A comparative study.Data and Knowledge Engineering, 68,
338-361.
Zachary,W. (1977).An information flow model for conflict and fission in small groups, Journal of
Anthropological Research 33 (4), 452-473.
Zhang, S., Wang, R., & Zhang, X. (2007). Identification of overlapping community structure in complex networks using fuzzy c-means clustering. Physica A, 374, 483-490.
Zhang, J., Zhang, S.,& Zhang, X. (2008). Detecting community structure in complex networks based on a measure of information discrepancy. Physica A, 387, 1675-1682.
Zhang, J., Xu, X., Li, P., Zhang, K., & Small, M. (2011). Node importance for dynamical process on networks: A multiscale Characterization. Chaos, 21, 016107.
Zhou, H. (2003). Distance, dissimilarity index, and network community structure, Physics Review E, 67