Responses of soil clay mineralogy in the Rothamsted Classical Experimentsin relation to
1
management practice and changing land use
2
1
A.M. Tye, 1S.J. Kemp and 2P.R. Poulton.
3 4
1
British Geological Survey, Keyworth, Nottingham, NG12 5GG, U.K.
5
2
Department of Soil Science, Rothamsted Research, Harpenden, AL5 2JQ, U.K.
6 7 8
Abstract
9
Changes in the clay mineralogy of soil samples collected from the Rothamsted Classical 10
Experiments over the past ~150 years were examined. Comparisons were undertaken to assess 11
the impact of (i) different fertiliser practices on the top soil and sub soil of the Park Grass 12
Experiment and (ii) the effects of changing land-use from agriculture to woodland where soil 13
pH either remained close to pH 7 or became acid. Analyses were undertaken on the <0.2 µm 14
clay fraction and measurements included cation exchange capacity (CEC), surface area and 15
X-ray diffraction (XRD). The fine clay fraction of all the samples is composed of 16
illite/smectite (I/S), illite and kaolinite minerals. Decomposition modelling of XRD spectra 17
identified three I/S phases including (i) a high smectite I/S phase (d(00l) ~15Å), (ii) a low 18
smectite I/S phase (d(00l) ~12.5Å) and (iii) an illite phase (d(00l) ~11.2Å). The I/S phase is 19
typically made up of ~60 % of high smectite I/S, ~20 % low smectite I/S and ~20 % illite. 20
Attempts to account for changes in clay CEC and surface area with time proved to be 21
inconclusive, possibly because of the differing proportions of the three I/S phases in each 22
sample. Some temporal changes in the d(00l) spacing of I/S mineral phases from the 23
decomposed XRD spectra (>0.4 Å) are reported in both top soil (0-23 cm) and sub soil (46-69 24
cm) and are likely related to (i) changes in soil K+ or NH4+ status and/or (iii) increasing soil 25
soil pH fell below 3.7. It is believed that solubilisation of hydroxyl-Al in smectite interlayers 27
enabled renewed access to K+ or NH4+ ions, leading to increased collapse in d001 spacing. 28
However, the results show that over a diverse range of soil conditions, I/S minerals of the 29
Batcombe series soils showed considerable resilience to major change. This is considered to 30
be a result of competition for sorption sites by the (i) presence of competing ions added as 31
fertiliser or liming materials, (ii) an increase in H+ ions as soil acidity increases, (iii) the 32
possible role of organic carbon in protecting I/S minerals and (iv) the role of the I/S minerals 33
as K+ reservoirs. However, the impact of decreasing soil pH should be considered when land 34
is re-forested as this may lead to irreversible decreases in the d(00l) spacing of I/S minerals, 35
thus compromising useful clay properties such as CEC. 36
37
Keywords: Clay minerals, Soils, Illite/Smectite, X-ray diffraction, Land management
38 39
1. Introduction
40
Clay mineral properties are fundamental to many soil functions including water and nutrient 41
retention, contaminant (pesticides, heavy metals) attenuation, carbon storage, the maintenance 42
of soil structure and the filtering of both ground and surface waters. However, relatively few 43
studies have been undertaken to examine how clay mineral structure may change with (i) the 44
inorganic chemical inputs of intensive agricultural systems and (ii) land use changes over long 45
periods of time. Thus, soil archives from long-term experiments provide a valuable resource, 46
allowing changes to be studied with knowledge of management practices over relatively long 47
periods (Velde & Peck, 2002). In addition, recent advances in X-ray diffraction (XRD) 48
techniques such as decomposition modelling have allowed greater interpretation of XRD 49
profiles, enabling more precise identification of different soil clay mineral phases (e.g. Mathé 50
the ‘Rothamsted Classical Experiments’ (Johnston, 1997) in relation to fertiliser additions and 52
changing land use. 53
54
In temperate regions, attention has largely focused on 2:1 clay minerals (smectite, vermiculite, 55
illite, chlorite and their intergrades) as they dominate the clay mineralogy of many soils (Velde, 56
2001). With respect to fertiliser applications, work has largely focussed on the interactions 57
between K+ and illite/smectite (I/S) mixed layer minerals (Singh & Goulding, 1997; Velde & 58
Peck, 2002; Pernes-Debuyser et al. 2003; Mathé et al., 2007; Barré et al. 2007a & b). These 59
studies have shown the importance of K+ in determining the nature of I/S minerals and the K+ 60
buffer capacity for plant nutrition. For example, Velde & Peck (2002) examined samples taken 61
between 1913 and 1996 from the Morrow Plot Experiment archive at the University of Illinois. 62
The major finding was that under continuous corn cropping and without fertilisation, the 63
extraction of K+ for plant nutrition led to an increase in the smectite content of I/S minerals. 64
Pernes-Debuyser et al. (2003) demonstrated that in soils where plant growth was absent, the 65
addition of K+ fertiliser resulted in an increase in the illite (non-expandable) content of the I/S. 66
These results, among others, led Barré et al. (2007a & b) to postulate that ‘illite-like layers’ can 67
be viewed as K+ reservoirs that can be potentially refuelled via the ‘nutrient uplift theory’ 68
suggested by Jobbagy & Jackson (2001). Therefore, in top soils where greater K+ is uplifted or 69
recycled than is required by plants the system could be pushed towards the illite end of the I/S 70
system. Changes in clay mineralogy have also been investigated in chronosequences under 71
natural conditions where the role of K+ has been important in determining changes in I/S 72
mineral structure. Velde et al. (2003) examined changes in poldered sediments under natural 73
pasture development. In the oldest profiles (>800 yrs), a disordered illitic I/S mineral became 74
dominant in the upper parts of the profile whilst in the lower part of the profile a smectitic I/S 75
polders in response to local environmental conditions and noted that with increasing age, 77
chlorite was removed and the illite content of I/S increased. Such reactions were triggered by 78
oxidation and in natural systems would last >1000 y but could be accelerated by artificial 79
drainage to complete the process in a few tens of years. 80
81
Less work has been undertaken on the role of inorganic N fertilisers on clay mineralogy despite 82
this representing the major input of chemical elements and acidity to intensive agricultural 83
systems. The biogeochemistry of N amendments depends on the form applied. Both NO3- and 84
NH4+ applications can affect the reduction of structural Fe3+ to Fe2+ in clays, a process essential 85
to the collapse of interlayers in smectitic minerals (Stuki, 1997). For example, in waterlogged 86
soils the presence of NO3- has been found to inhibit the reduction of structural Fe3+ to Fe2+ 87
(Chen et al., 2008; Matocha & Coyne, 2005), but its effect was found to be temporary, lasting 88
as long as sufficient NO3- was available. The application of ammonium fertilisers has been 89
found to increase Fe(III) reduction, probably through coupled NH4+ oxidation (Chen et al. 90
2008). The majority of this work has examined changes in the top-soil and relatively little is 91
known regarding changes in clay mineralogy in sub soils and how they react to agricultural 92
practice. However, understanding how they change with respect to time and land management 93
is important because of the role they play in the filtration and attenuation of contaminants for 94
surface and groundwater. 95
96
A second area of land management where changes in the structure of clay minerals may be 97
induced is where soils have undergone acidification either through natural or man-induced 98
processes. There has generally been a greater emphasis on using chemical, rather than 99
mineralogical measurements in these studies to demonstrate changes in clay function. The 100
McGahan et al. (2003), whilst Blake et al. (1999) examined the effects of natural acidification 102
as agricultural land has reverted to woodland in the Geescroft Classical Experiment at 103
Rothamsted. The formation of interlayer hydroxyl-aluminium was found to be important in the 104
buffering process against acidification and can lead to a loss in clay cation exchange capacity 105
(Ulrich, 1991). 106
107
This study aims to identify changes in clay mineral structure in soils from the archive of the 108
Rothamsted Classical Experiments that extend over ~150 years. Limited analyses of clay 109
mineralogy in some of these soils, has been undertaken as part of projects where greater focus 110
was placed on chemical measurements (Blake et al., 1999; Singh & Goulding, 1997). This 111
work undertakes a more systematic examination of archive samples from the Park Grass 112
Experiment and the Broadbalk and Geescroft Wildernesses using decomposition modelling of 113
XRD profiles to identify changes in clay mineralogy that have accompanied some of the 114
previously reported chemical changes (e.g. Blake et al., 1999). The changes found in clay 115
structure after (i) long-term and repeated application of N and K fertilisers and (ii) natural (re-116
forestation) and fertiliser induced acidification in the top and sub soil are reported. 117
118
2. Materials and Methods
119
2.1 Background and Sample Collection
120
Samples used in this study were taken from three of the Rothamsted Classical Experiments; 121
Park Grass, Geescroft Wilderness, and Broadbalk Wilderness. Soils from all the experiments 122
are representative of the Batcombe series or close variants. These are classified by the Soil 123
Classification for England and Wales as stagnogleyic palaeo-argillic brown earths (Avery, 124
1980) or Aquic Paleudalf (U.S.D.A, 1992). The top soil is silty clay loam forming on 125
Clay-with-Flints deposits were most likely derived from the Reading Formation (Lambeth 127
Group) and developed during warm periods between plateau drift and the Chalk bedrock 128
through clay particles and insoluble chalk residues infiltrating dissolution hollows in the Chalk. 129
During cold periods, cryoturbation possibly remixed this accumulation with the plateau drift 130
(Catt & Hodgson, 1976). The mineralogy of the sand fraction of the Batcombe series soils 131
found at Rothamsted is similar to that of the Reading Beds (Catt & Hodgson, 1976). Reading 132
Formation clay mineral assemblages are illite-dominated, with minor smectite, kaolin and 133
chlorite although altered ash, comprising smectite-dominated horizons are also found (Huggett 134
& Knox, 2006). 135
136
Soil samples (up to 1999) were collected with an open ended steel box (internal dimensions 15 137
x 15 x 23 cm deep). This was driven into the ground until it was flush with the surface; the soil 138
was then dug out (Poulton et al., 2003). Either 3, 4 or 6 holes were taken for a composite 139
sample from each treatment. However, one of the Park Grass Experiment samples (Plot 3, 140
Unlimed, 1966) was taken as a single 15 x 15 x 23 cm sample. Samples were sieved to <2 mm, 141
air-dried and stored in sealed glass jars within the Rothamsted Sample Archive. After 1999, 142
soils were sampled by taking cores with semi-cylindrical augers. Blake et al. (2000) examined 143
changes in properties of the soils maintained in the soil archive and found only minor changes 144
in exchangeable K+ between 1959 and 1991. 145
146
2.2 Comparisons undertaken
147
2.2.1 Fertiliser effects on top and sub soils using Park Grass samples
148
The Park Grass Experiment was started in 1856 on a site which had been in permanent 149
grassland for at least 100 years. The soil was slightly acid (pH(H2O) 5.4-5.6) and the nutrient 150
Park Grass Experiment were used (i) Plot 3, the Control plot where no lime or fertiliser had 152
been added since 1856, (ii) Plot 14 where 96 kg N ha-1 as NaNO3 has been applied each year 153
since 1858 and (iii) Plot 9 where 96 kg N ha-1 as (NH4)2SO4 has been applied each year since 154
1856. Atmospheric NH4-N deposition has been estimated as ~2.5 kg ha-1 a-1 from 1850 to 1900 155
before rising to ~10 kg ha-1 a-1 in 1975 and falling to ~2.5 kg ha-1 a-1 in the 1990’s (Blake et al. 156
1999). Similarly, inputs of H+ have varied between 0.1 and 0.4 kg ha-1 a-1. Treatments receiving 157
fertiliser N also receive yearly applications of 35 kg ha-1 P as triple superphosphate, 225 kg ha-1 158
K as K2SO4, 15 kg ha-1 Na as Na2SO4 and 10 kg ha-1 Mg as MgSO4. The whole experiment 159
received a small amount of chalk in the 1880s/1890s. Since then, plots have since been sub-160
divided to allow for different lime applications to produce a range of pH values from 3.5 to 7 161
amongst the various combinations of treatments. 162
163
In the present study, only soil samples from the unlimed plots or subplots collected in 1876, 164
1904, 1966/1984, and 2002 (0-23 cm) were used to give 4 points on the time-series for the top 165
soil. Changes in the sub soil (49-63 cm) clay mineralogy were monitored using samples from 166
1870/1876, 1906, 1991 and 2002. Table 1 provides a summary of the samples used. 167
168
2.2.2 Comparison between acidic (Geescroft Wilderness) and alkaline (Broadbalk
169
Wilderness) woodland top soils
170
The Geescroft Wilderness and Broadbalk Wilderness are situated ~700m apart and the soil at 171
both locations is the Batcombe series soil. Geescroft Wilderness was part of an experimental 172
field growing field beans from 1847 to 1878. After bare fallowing for 4 years, clover was 173
grown from 1883 to 1885 and it was then allowed to revert to the current wilderness area in 174
1886 (Poulton et al. 2003). It is dominated by mature oak, remains unlimed since the 18th 175
acidification in these soils and produced a conceptual model that is used as a backdrop to the 177
current XRD results. 178
179
Broadbalk Wilderness lies at the western end of the Broadbalk Wheat experiment. The area 180
that is now the wilderness was sown with wheat from 1843 to 1882 from which it was allowed 181
to revert to woodland (Poulton et al., 2003). It consists of three sections, the woodland which is 182
dominated by mature oak, a section where saplings have been regularly removed (stubbed) 183
since 1900 and an area that has been grazed since 1957. Most importantly, before the 184
Broadbalk wheat experiment had started in 1843, the field had been very heavily limed (up to 185
200 t ha-1); the wilderness area still has a pH of ~ 7. Therefore the comparisons between the 186
two wilderness areas will provide information on the changes of clay mineralogy (i) in top soil 187
when agricultural land is returned to forestry and (ii) caused by acidification as opposed to the 188
maintenance of pH through the liming of woodland. Only 3 sampling times were available for 189
analysis; the first of which, in 1881 or 1883, was when both sites were still under arable crops 190
or fallow (Table 1). 191
192
2.3 Laboratory methods
193
Changes in the clay mineralogy caused by land management practices are likely to be subtle 194
and difficult to detect and so the analytical work focussed on the fine clay fraction of the soil 195
(<0.2 µm). 196
2.3.1 Particle-size separation
197
Initially, organic C was not removed from the soil so as to protect the clay components from 198
potential changes caused by oxidising agents. The soils were dispersed in deionised water 199
(MSE)), before wet screening through a 63 µm sieve. The >63 µm (‘sand’) fraction was dried 201
at 40°C, weighed and stored. The <63 µm material was placed in a gas jar with 2 ml 0.1M 202
sodium hexametaphosphate ('Calgon') solution to disperse the individual clay particles and 203
prevent flocculation. After standing for a period determined using Stokes' Law (16 hours for 20 204
cm drop), a nominal <2 µm (‘clay’) fraction was removed to a stock beaker. The measuring 205
cylinders were then topped up with deionised water, stirred and the particles allowed to settle 206
before extracting further <2 µm material. This process was repeated until no clay was visibly 207
evident. The remaining 2-63 µm fraction was removed, dried at 40°C, weighed and stored. In 208
order to isolate a <0.2 µm fraction, the <2 µm material was centrifuged (Centaur 2 (MSE)) for 209
30 minutes at 3000 rpm before removing the supernatant (<0.2 µm) into a stock beaker. The 210
remaining material was then re-dispersed before repeating the procedure two further times. The 211
<0.2 µm (‘fine clay’) material and remaining 0.2-2 µm (‘coarse clay’) material were then dried 212
at 40°C, weighed and stored. Organic matter was removed from the <0.2 µm fractions by the 213
five-time application of 1M sodium hypochlorite/hydrochloric acid buffer (pH 8.0) following 214
the method of Kaiser et al. (2002). Siregar et al. (2005) suggest that this oxidising agent does 215
not attack pedogenic oxides and hydroxides and only slightly dissolves Al from the poorly 216
crystalline minerals and thus was less likely to cause alteration to the clay minerals than for 217
example, H2O2. 218
2.3.2 Measurements
219
Samples for total organic carbon (TOC) analysis were prepared by pre-drying at 100-105°C 220
(1.5 hours), acidifying (HCl, 50% v/v), drying at 100-105°C (1.5 hours), and analysing by 221
combustion (1050°C) using an ‘Elementar Vario Max’ C/N analyser. CEC was determined by 222
a compulsive displacement technique using a BaCl2/triethanolamine (pH 8.1) titration method 223
based on that proposed by Bascomb (1964). Surface-area determinations (SA) were carried out 224
molecules on the clay surface under vacuum (Heilman et al., 1965). Churchman et al. (1991) 226
discuss the assumptions necessary within the EGME method including the behaviour of clay 227
type, and time taken to establish end points. In this study samples were expected to have 228
similar mineralogical compositions and a standard method was used throughout. As only small 229
amounts of material were available, 0.2 g of <0.2 µm material was covered by ~1 ml of EGME 230
and left for 24 hours before reweighing. A conversion factor of 0.000286 g m2 was used to 231
calculate total surface area. 232
2.3.3 X-ray diffraction analysis
233
In order to produce high quality diffraction traces, oriented mounts for XRD analysis were 234
produced using ‘zero background’ silicon crystal substrates. About 15 mg of the dried <0.2 µm 235
material was re-suspended in a minimum of deionised water, Ca-saturated using a few drops of 236
0.1M CaCl2.6H2O solution, washed, pipetted onto a silicon crystal substrate and allowed to air-237
dry overnight. XRD analysis was carried out using a PANalytical X’Pert Pro series 238
diffractometer fitted with a cobalt-target tube, X’Celerator detector and operated at 45kV and 239
40mA. The <0.2 µm oriented clay mounts were scanned from 2-35°2 at 0.55°2/minute after 240
air-drying, ethylene glycol-solvation and heating to 550°C for 2 hours. Clay mineralogy was 241
determined by characteristic peak positions in relation to this diagnostic testing program. 242
243
In order to obtain further information about the nature of the clay minerals present in the 244
samples, modelling of the XRD profiles was carried out using Newmod-for-Windows™ 245
(Reynolds & Reynolds, 1996) software. The modelling process requires the input of 246
diffractometer, scan parameters and a quartz intensity factor (instrumental conditions), and the 247
selection of different phyllosilicate sheet compositions and chemistries. In addition, an estimate 248
of the crystallite size distribution of the clay species may be determined by comparing peak 249
clay mineralogy of the samples was deduced by decomposition of the XRD profiles into their 251
elementary component curves using the program DECOMPXR (Lanson, 1993; Lanson & 252
Besson, 1992). Best fits were obtained using Gaussian curves following background 253
subtraction and 7-point smoothing. 254
255
2.4 Theoretical considerations
256
Theoretically, the responses of the three analyses undertaken (EGME SA, CEC and XRD) 257
should be correlated. Previous work examining a wide range of soil types has demonstrated 258
that measurements of clay SA and CEC are positively correlated (Curtin and Smillie, 1976; 259
Peterson et al., 1996), particularly for the B and C horizons. Churchman et al., (1991) suggest 260
that this is because EGME is a polar molecule and its uptake is related to both the charge and 261
surface area of the clay. However, for soil A horizons the presence and interactions of organic 262
matter with the clay fraction is known to complicate these relationships. In terms of inorganic 263
components, the SA and CEC of the Rothamsted soils are likely to be determined by the type 264
and quantity of I/S minerals present because of the high surface area and CEC of smectite. 265
266
Recent advances in the power of desktop computers has provided the data processing power 267
necessary to extract further information from XRD profiles. Such processing power is 268
required by decomposition routines whereby peak profiles are split into partially overlapping 269
contributions due to phases with distinct but closely related crystallographic characteristics 270
(Lanson, 1997). Decomposition therefore offers the possibility to identify the presence of 271
different phases by monitoring parameters such as peak position, full width at half maximum 272
intensity (FWHM), relative intensity and profile shape. Decomposition routines, such as 273
DECOMPXR (Lanson, 1993), are iterative procedures, the quality of the fit being estimated 274
stopped when the quality of the fit is not improving and/or when adjusted parameters are 276
stable. Due to their small crystallite-size distributions, clay minerals are often characterised by 277
broad and overlapping XRD peaks. This is particularly so for soil clay minerals. 278
Decomposition of soil clay mineral XRD profiles therefore offers a relatively fast 279
identification and descriptive tool, especially suited to establishing trends when studying 280
sample series and variations affecting their components (Lanson, 1997). 281
282
Characterisation of the I/S species is facilitated by precise measurements of the position of 283
their d(00l) XRD peaks following decomposition (e.g. Lanson & Velde, 1992). In general 284
terms, a decrease in the d(00l) of I/S species indicates a reduction in the proportion of smectite 285
interlayers present and an increase in the number of layers that act in a manner more 286
analogous to illite. In this study on the Rothamsted, such decreases are likely to result from 287
either (i) replacement of hydrated Ca2+ ions in the smectite interlayer space by one or a 288
combination of K+ or NH4+ ions or (ii) soil acidification leading to the deposition of hydroxyl-289
Al in the smectite interlayers. Such decreases in I/S d(00l) would therefore be expected to 290
correlate with decreases in CEC and SA. 291
292
This ‘illitization-like process’ in the I/S is most likely driven by wetting and drying cycles and 293
the subsequent reduction of structural Fe(III) in clays, sometimes mediated primarily by the
294
enzymatically catalyzed activity of indigenous soil micro-organisms (Favre et al., 2002; Kim 295
et al., 2004; Huggett & Cuadros, 2005; Kostka et al., 1999; Stanjek & Marchel, 2008; Siyuan
296
and Stucki, 1994; Stucki, 1997). The major requirement to enable this collapse in the d(001) 297
spacing is a decrease in the positive charge of the octahedral sheet of the smectite. This occurs 298
as structural Fe3+ is reduced to Fe2+. This causes an increase in CEC and subsequently the 299
(Khaled & Stucki, 1991; Kim et al., 2004; Drits and Manceau, 2000; Huggett & Cuadros, 301
2005; Stanjek & Marchel, 2008; Stucki & Kostka, 2006), thus promoting a more illitic type of 302
structure. 303
304
The input of K+ into the soil in these experiments will either be through the weathering of 305
minerals such as mica or feldspar, identified in previous XRD analyses of Rothamsted soils 306
(Singh & Goulding, 1997; Blake et al., 1999), through nutrient uplift via roots or through the 307
application of inorganic fertilisers. The similar size of the dehydrated NH4+ cation (K+ = 1.33 308
Å; NH4+ = 1.43 Å), means that it is also capable of collapsing smectite interlayers in I/S (Chen 309
et al., 1989; Drits et al., 1997), thus fixing NH4+. Soil acidification, such as that created 310
through the application of (NH4)2SO4 fertilisers or atmospheric inputs (possibly exacerbated by 311
reforestation; Johnston et al., 1986), is counteracted within the soil by a series of buffering 312
mechanisms (Ulrich, 1992; Wilson et al., 1994; Blake et al., 1999). Ulrich (1992) describes 313
one of the by-products of acidity buffering between pH 5 and 4.2 as the deposition of non-314
exchangeable hydroxyl-Al into the interlayer space of clays that contribute to their collapse and 315
decreases in CEC. In addition, if H2SO4 is one of the acidifying agents the formation of 316
amorphous Al-hydroxy-sulphates is possible. However, as soil pH falls below 4.2 the solubility 317
of the hydroxyl-Al compounds increases, and the storage of Al-hydroxy-cations and sulphates 318
that have accumulated in the exchanger buffer range decreases. 319
320
3. Results and discussion
321
3.1 General characteristics of <0.2 µm clay in top and sub soils
322
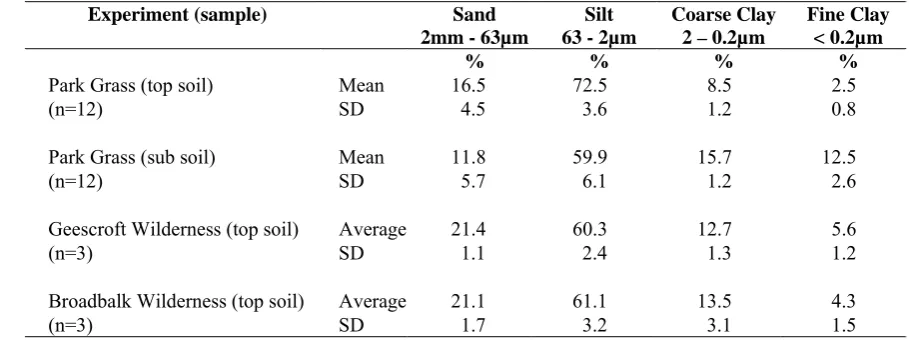
The general characteristics of soil texture and clay mineralogy in the top soils and sub soils 323
from the Classical Experiments are summarised in Tables 2 & 3. Particle-size analyses are 324
there was an increase in silt content (~12 %) in the top soil compared to the sub soil. This is 326
thought to be a result of the deposition of loess in the late Devensian about 14000-18000 years 327
B.P. (Avery & Catt, 1995). The top soil in the Geescroft and Broadbalk experiments had 328
similar particle size distributions. However, less silt was present than in the top soil of the Park 329
Grass Experiment and greater sand and clay contents were found, possibly because of the Hook 330
series, a variation of the Batcomb series, being present across some of the Park Grass 331
Experiment (Avery & Catt, 1995). Alternatively, the period of cultivation that the Broadbalk 332
and Geescroft sites underwent before being retuned to wilderness may have led to a slight 333
coarsening of the soil (Lobe et al. 2001; Jolivet et al. 2003). The proportion of fine clay present 334
is generally similar for all the top soils (2.5-5.6 %) but represents a significantly higher 335
proportion of the Park Grass sub soils (12.5%). 336
337
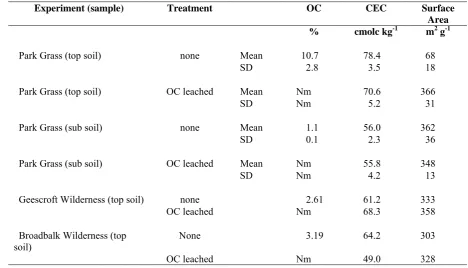
Table 3 reports organic carbon (OC) concentrations, CEC and surface area (SA) of the <0.2 µm 338
clay fraction at the earliest date examined from each experiment. It also demonstrates the effect 339
of OC removal on CEC and SA properties. As expected, the concentration of OC was higher in 340
top soils due to greater biological activity and particularly so for the Park Grass samples. 341
Whereas CEC decreased with OC removal from the top soil, SA increased markedly 342
suggesting its presence was helping form micro-aggregates and thus decreasing the measurable 343
SA of the clay (Mikutta et al., 2004). In the sub soil the removal of OC had a minimal effect on 344
CEC and SA. Therefore to remove the effects due to OC it was removed prior to SA and CEC 345
analyses. However, the potential for incomplete removal of OC, and more importantly the 346
different quantities of I/S present made the tracking of changes in SA and CEC for the different 347
treatments over time problematic. 348
349
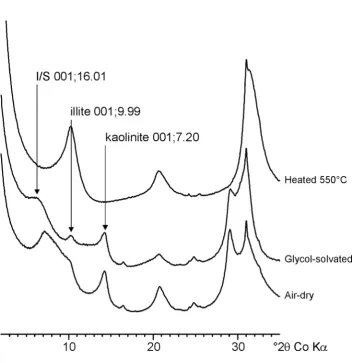
3.2 XRD analyses
350
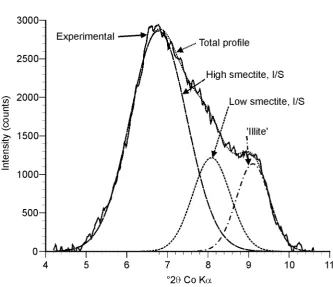
fractions are predominantly composed of I/S, illite and kaolinite clay minerals (Figure 1). 352
These results are similar to previous analyses of the <0.2 µm fraction of the Broadbalk 353
Experiment by Singh & Goulding (1997). However these authors identified the interstratified 354
phase as a smectite/vermiculite. Decomposition of the XRD traces using DECOMPXR 355
indicates that the 4 -11 °2 range is composed of three different sub-species (Figure 2). 356
NEWMOD-modelling suggests that the three peaks represent a high smectite I/S phase (~15 357
Å), a low smectite I/S phase (~12.5 Å), and an ‘illite’ phase (~11.2 Å). XRD analyses of 358
samples prior to and following OC-removal suggest a small (~0.2 Å) increase in the d(001) 359
spacing of each of the three sub-species. Velde et al. (2003) reported similar findings and 360
suggested that OC was responsible for closing some of the smectite interlayers. When 361
comparing management and land use effects on clay particles in the present study we report 362
those obtained prior to OC-removal to ensure minimal damage to the clay minerals susceptible 363
to decomposition from hypochlorite. 364
365
General properties of the decomposed XRD peaks for each experiment are shown in Table 4, 366
including the peak position (Å), the peak full width at half maximum (FWHM, °2 and the % 367
area of the total peak. The high smectite I/S presents a relatively broad XRD peak with a mean 368
FWHM of ~1.9 in all the samples, indicative of very small crystallite-size distributions. The 369
low smectite I/S mineral has mean FWHM values in the range 1.2 - 1.5, while smaller mean 370
FWHM values of ~1 were measured for the illitic phase suggesting larger crystallites than in 371
the I/S phases. The area beneath each of the decomposed peaks can be used to broadly indicate 372
the relative proportions of each phase present, particularly if the angular factor is taken into 373
account. As indicated in Table 4, the high smectite I/S (43-79 %) phase dominates both top soil 374
and sub-soil with lesser amounts of the low smectite I/S and ‘illite’ mineral phases. 375
changes in the I/S d(00l) spacing with time to be monitored (e.g. Bain & Griffen, 2002; Mathe 377
et al., 2007, Pernes-Debuyser et al. 2003; Velde & Peck, 2002). In these studies changes in 378
peak movements of less than ~0.4 Å have often been reported and discussed. However in the 379
present study, trends have only been identified where peak movements of >0.4 Å are evident. 380
381
3.3 Fertiliser effects on top and sub soils using Park Grass samples
382
Results from the Control treatment sampled in the early years of the experiment (1870/1876) 383
demonstrate differences in the measured CEC and SA properties of the top and sub soil (Table 384
3). After the removal of OC, the <0.2 µm clay particles of the top soil possessed a higher CEC 385
and SA than the sub soil. 386
387
3.3.1 Park Grass top soil
388
Analyses undertaken on the <2 mm soil fraction give an indication of changes in pH and 389
exchangeable cation status in the top soil relevant to this study (data from Rothamsted 390
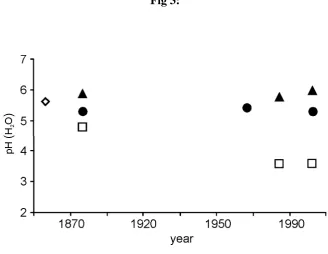
Research, Figures 3 and 4). The initial (1856) pH value of the Park Grass soil has been 391
estimated as ~5.5 (Johnston et al., 1986). Since the inception of the experiment, the soil pH of 392
the ‘control treatment’ has declined slightly to ~5.1. After NaNO3 treatment soil pH increased. 393
This may have been due to a combination of Na+ ions occupying cation exchange sites in place 394
of H+ ions and the increase in pH related to NO3- uptake by plants. Soil treated with (NH4)2SO4 395
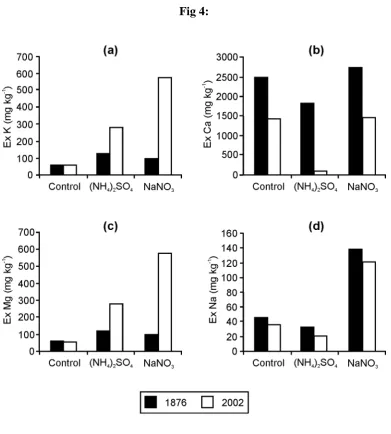
has undergone acidification to pH values of ~3.5. Values for extractable K, Ca, Mg, and Na 396
(Figure 4) reflect fertiliser inputs and off-takes in the herbage (section 2.2.1). 397
398
The first set of samples analysed in the present work were taken ~20 years after the initiation of 399
the Park Grass Experiment. There were no identifiable trends in <0.2 µm clay CEC and SA 400
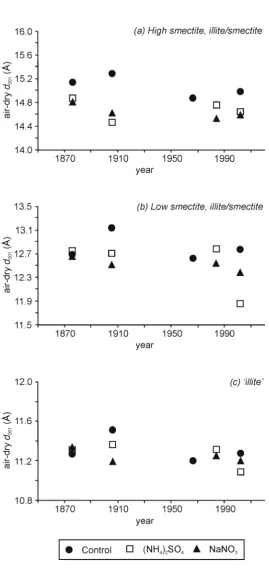
the (NH4)2SO4 plots (Figure 3, Table 2). Changes in the position of the d(001) spacing for the 402
three identified XRD phases for the Control, NaNO3 and (NH4)2SO4 treatments are summarised 403
in Figure 5. There was a great deal of variability in the high smectite I/S phase (Figure 5a), 404
presumably as it contains the highest proportion of smectite interlayers. This variability is 405
likely a result of the high smectite I/S phase being the main reservoir and source of K+ for plant 406
requirements (Barré et al. 2007a & b). The d(001) spacing found in the high smectite I/S 407
minerals from the (NH4)2SO4 or NaNO3 plots was consistently smaller than that found in the 408
control. This difference was present at the first sampling point (1870), taken after ~20 years of 409
repeated fertilisation and suggests that the presence of increased K+ from the fertilisers in the 410
first 20 years of the experiment may have already created a difference by the first analysis in 411
this study. The maximum difference (1906) was ~0.8 Å, but was ~0.4 Å in 2001. 412
413
Only one trend was apparent in the d(001) spacing of the low smectite I/S phase (Figure 5b) 414
and this was found in the (NH4)2SO4 treatment. Relatively little variation in d(001) spacing was 415
found between all treatments for much of the study period. However, in 2002, a sudden ~0.8 Å 416
collapse in the d(001) spacing of the (NH4)2SO4 sample was detected. A possible explanation 417
for this is that as the soil pH falls to ~3.5 (Figure 3), the increasing acidity is buffered by the 418
release of the hydroxy-Al and hydroxy-Al sulphates previously deposited in the interlayer 419
spaces (Ulrich et al., 1992). This could be considered a mild form of the acid-activation 420
process used on bentonites; a treatment used to increase the SA of smectite-group minerals for 421
industrial uses (e.g. Christidis et al., 1997). Further indications of this process were found in 422
the SA measurement which increased from around an average of 366 m2 g-1 to 591m2 g-1 for 423
this last measurement. As this process occurred interlayer space that was occupied by 424
hydroxyl-Al may have become unoccupied, allowing K+ or NH4+ to enter and to collapse it. 425
position of the peak at ~11.2 Å suggests that it contains a small number of smectite interlayers 427
and so may show a more limited response to increased K+ availability or acidification processes 428
already described. 429
430
It was interesting to note that greater differences were not found between such different 431
treatments in the Park Grass top soil, especially as soil conditions exist which have been shown 432
to cause changes in I/S minerals (e.g. increasing soil K+ and/or acidity). This may have been 433
due to (i) the continued recycling of nutrients and the addition of fertilisers producing 434
competition for interlayer spaces in the I/S layers, (ii) the differences in yearly plant 435
requirements of K+, balanced by the weathering of micas and uplift of K+ and (iii) the role of 436
organic carbon (10.7 % in the fine clay fraction; Table 3) in protecting the clay minerals by 437
preventing access to interlayer spaces or by aggregating clay particles. In particular the 438
protection, through restriction of access to I/S minerals by organic carbon and increased 439
competition by H+ ions for interlayer sites may be a reason why there was a time lag between 440
soil pH values decreasing and the later collapse of the interlayer space in the (NH4)2SO4 441
treatment. 442
443
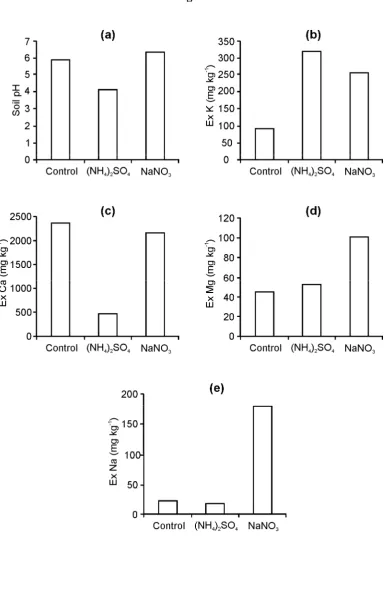
3.3.2 Park Grass Sub soil
444
Changes in the clay mineralogy of the sub soil under the Park Grass Experiment were 445
examined to determine how management practices of the top soil may have impacted on the 446
sub soil clay mineralogy. Figure 6 shows a range of sub soil (<2 mm) characteristics for the 447
2002 samples; earlier sampling dates were not re-analysed. The different fertiliser treatments 448
have caused changes in the characteristics of the <2 mm soil fraction. After the yearly 449
application of (NH4)2SO4 and other fertilisers, the pH has dropped to ~4.2, compared to pH ~6 450
probably to be replaced by exchangeable Al(OH)x species, Al3+ and H+. Following NaNO3 and 452
fertiliser application, pH has marginally increased to ~6.2 and both exchangeable K+ and Na+ 453
have increased in concentration. 454
455
No overall treatment trend was found for either CEC or SA in the <0.2 µm clay fraction from 456
the sub soil samples. Figure 7 shows the change in d(001) spacing for the three identified I/S 457
phases. For the high smectite I/S (Figure 7a), the initial spread of data points for the different 458
plots is greater than for the top soil, possibly reflecting a greater range and distribution of 459
variously hydrated cations present in the smectite interlayers. Only one identifiable trend was 460
found in the high smectite I/S; a consistent decrease in d(001) spacing in the control plot over 461
the study period. Values fell from 15.5 – 14.7 Å and may have been a result of the interaction 462
between naturally weathered K+ with the smectite interlayers. This response contrasts with 463
samples of the (NH4)2SO4 and NaNO3 treatments where no trends were observable despite 464
large increases in exchangeable K+ being found from the leaching of fertiliser (Figure 6b). In 465
the low smectite I/S minerals a decrease from ~12.9– 12.5 Å was found in the NaNO3 466
treatment. This is likely due to the presence of K+ ions and their substitution with Ca2+ ions. 467
No identifiable trends > 0.4 Å were found in the illite phase. 468
469
A possible explanation why greater decreases were found in the control plot than in the NaNO3 470
and (NH4)2SO4 treatments is competition from other ions. For example, the annual addition of 471
NaNO3 fertiliser would introduce Na+ ions, as well as those from the other mineral fertilisers 472
applied. Subsequently, as a result of this competition from other ions, the K+ ions may not have 473
been able to access sites in the smectite interlayers (Stucki & Huo, 1996) with such ease and 474
were thus retained on the more selective frayed edge sites of the smectite component (Goulding 475
soil acidified may have increased competition with both K+ & Al3+ ions in I/S interlayers. 477
478
3.4 Comparison between acidic (Geescroft Wilderness) and alkaline (Broadbalk
479
Wilderness) woodland top soils
480
In Broadbalk Wilderness, the soil still contains some free CaCO3 following large applications 481
of chalk in the 18th and early 19th centuries; soil pH is still >7 (Section 2.1.3). In contrast, in 482
Geescroft Wilderness which had little or no chalk applied, soil acidity has developed over time 483
(Figure 8). Again there are no detectable trends in the CEC and SA measurements (results not 484
shown). Figure 9 shows the changes in the d(001) spacing for each of the I/S phases in the 485
samples from the two woodland sites. The 1881-83 samples show differences in the d(001) 486
spacings between the two sites for each of the three phases, possibly as a result of slight 487
differences in the parent material or previous weathering processes or land-use. For the high 488
smectite I/S (Figure 9a), there is a large variation in the d(001) spacing but no overall trend 489
could be identified at either site. The only readily identifiable trend was found in the 490
progressively acidifying Geescroft Wilderness soil, where a decrease in the d(001) spacing of 491
~13.0 to 12.5 Å was found in the low smectite I/S phase through the period examined. 492
Although a steady decrease appeared in the illite phase in the Geescroft Wilderness, this is 493
considered too small to be definite trend. However, in the neutral Broadbalk Wilderness there 494
was minimal change in the d(001) spacing measurements for both the low smectite I/S or 495
‘illite’ phases. 496
497
In the Geescroft Wilderness, the soil pH had dropped to ~pH 4.5, a pH where the main reaction 498
products are non-exchangeable polymeric Al-hydroxy-cations (Ulrich, 1991) which can form 499
in the interlayer space of smectite clays, thus decreasing d001 spacings. Blake et al. (1999) 500
and reported decreases in soil effective cation exchange capacity (ECEC), although these 502
measurements would include the decrease in pH-dependent charge of soil organic matter found 503
with decreasing soil pH. They suggested that the decrease in ECEC was partially a result of 504
clay particles being covered with amphoteric Al hydroxyl cations which restricts isomorphous 505
substitution and changes permanent charge into pH-dependent charge. An initial examination 506
of clay mineralogy in the Geescroft experiment by Blake et al. (1999) was reported as a pers. 507
comm. and indicated that ‘with time, the interstratified swelling mineral expands less readily on 508
solvation with ethylene glycol’. This would confirm the results reported in the present study 509
regarding the decreasing d(001) spacing in the low smectite I/S phase in the Geescroft soil. 510
The comparison between the acidic and alkaline woodlands appears to suggest that where soil 511
pH is maintained by application of CaCO3, the potential for the collapse of smectite interlayers 512
decreases as a result of competition from weathered Ca2+ ions for interlayer spaces. 513
514
4. General Discussion
515
The results obtained, taken in conjunction with those of several other studies (Bain & Griffen, 516
2002; Barak et al. 1997; Velde & Peck, 2002; Velde et al., 2003; Righi et al., 1995; Mathé et 517
al., 2007), provide further evidence that subtle changes can occur with time in clay minerals 518
subjected to different land management practices. However, after analysing a diverse selection 519
of samples in terms of pH and nutrient status, it was surprising that greater differences were not 520
seen. This was in spite of conditions of acidity and K+ status that have been found to promote 521
the collapse of the d(001) interlayer in I/S clay minerals. Despite a small number of identifiable 522
changes being found, results generally suggest that within the context of the general use of 523
soils in agriculture and forestry, I/S minerals of the Batcombe series soil are fairly resilient to 524
substantial changes. This resilience appears to be derived from other soil factors. These include 525
ions to K+, thus decreasing access to interlayer sorption sites in the smectite (e.g. Ca2+and Na+), 527
(ii) in acidifying soils, the presence of H+ providing competition for K+ and NH4+ ions, (iii) the 528
weathering of mica and feldspar and the recycling of K+ and (iv) the presence of organic 529
carbon that can physically reduce the accessibility to clay minerals by creating aggregates as 530
well as potentially entering the interlayer space (Velde et al., 2003). 531
532
With respect to the functioning of soil I/S minerals in agricultural and natural systems, where 533
decreases in d(001) spacing were identified it would be expected that some of the smectite in 534
the I/S minerals will behave more like illite. Typically, this could involve a loss of CEC and 535
suppress the ability of clays to swell. The interaction of K+ with the interlayer spaces of 536
smectite is obviously important and much of the general variation in d001 spacing, in all three 537
I/S phases, will be caused by the interactions of K+ with the growth demands of the plants. 538
Barré et al. (2008) identified reversible changes in five different 2:1 minerals with either K+ 539
addition or by removal by plants. Decreases in d(001) spacing caused by K+ entering the 540
interlayer space of the I/S minerals is at least partially reversible. Barré et al. (2007a) 541
demonstrated that changes in I/S minerals as a result of K+ removal by plants could occur 542
within 14 days and that plants could extract more K+ than was found within the exchangeable 543
K+ fraction. XRD analyses demonstrated a decrease in both well crystallised and poorly 544
crystallised illite after plants had been grown for 31 days. Thus Barré et al. (2007b) suggest 545
that ‘illite like layers’ act as a dynamic reservoir of K+. The decrease in d(001) spacing would 546
also be reversible in the sub soil as long as it is within the rooting zone where possible uplift of 547
nutrients may occur (Jobbágy & Jackson, 2001 & 2004). Deist & Talibudeen (1967 a & b) 548
demonstrated that the exchange isotherm K+-Ca2+ in 2:1 clays is rarely completely reversible 549
and that K+ entering the interlayer space can lead to the (i) trapping of cations as it collapses 550
CEC. Whilst results from this study suggest that, under typical agricultural practices of 552
fertiliser use and liming, the effect of K+ causing collapse of the d(001) spacing was minimal, 553
small losses of CEC could result in a loss of nutrients through leaching or the trapping of NH4+ 554
ions in the interlayer space thus preventing nitrification (Chappell & Evangelou, 2000). The 555
loss of CEC and swelling capacity also has implications for reducing the soil’s ability to 556
attenuate contaminants. No previous studies have reported the long-term effects of 557
management practices or natural weathering processes in the sub soil where the filtering of 558
ground and surface is a major function. This study suggests that in natural or unmanaged soils, 559
where soil pH is around neutral, K+ released through weathering can decrease the d(001) 560
spacing in I/S minerals in the sub soil and over long periods, the ability of the sub soil to act as 561
a filtration system for ground and surface waters could therefore be reduced. 562
563
In terms of afforestation the use of chemical assays suggested that a permanent reduction in 564
CEC and SA of the clay could develop if soils were allowed to acidify and hydroxyl-Al 565
compounds precipitated in the interlayer space (Blake et al. 1999). The results presented for the 566
I/S minerals from the Geescroft Wilderness provide further evidence for such phenomena. 567
Once acidified, liming the soil to reduce acidity will not lead to the precipitated interlayer Al 568
becoming soluble. Therefore, when reforestation is undertaken, the results from this study and 569
that of Blake et al., (1999) clearly demonstrate the appropriateness of a long-term liming 570
strategy for woodland to preserve clay function. 571
572
5. Conclusions
573
Our results demonstrate the extent to which I/S mineral phases in the top and sub soil undergo 574
alteration in both natural and agricultural ecosystems under long term land management 575
change in the structure of I/S minerals. However, our results suggest that typical agronomic 577
practices such as liming, the presence of organic carbon, and plant K+ requirements may largely 578
counteract the ‘illitization-like process’ whereby I/S minerals take on more illite-like properties 579
in top soil and sub soil. The decrease in d(001) spacing observed in sub soil I/S minerals in 580
conditions close to those of natural ecosystems warrant further investigation. Evidence suggests 581
that K+ released through weathering of mica and K-feldspars may decrease d(001) spacing and 582
subsequently CEC therefore having potential effects on the filtration capacity of I/S minerals. 583
The results also demonstrate the necessity to consider liming programs when afforestation of 584
agricultural land is undertaken to avoid permanent loss of clay CEC function. 585
586
6. Acknowledgements
587
The authors would like to thank Doris Wagner and Barbara Vickers for the preparation and 588
the analyses they undertook. Rothamsted Research receives grant-aided support from the U.K. 589
Biotechnology and Biological Sciences Research Council. AMT & SJK publish with the 590
permission of the Director of the British Geological Survey. 591
592
7. References
593
Avery, B.W. 1980. Soil Classification for England and Wales (Higher Categories). Soil Survey 594
Technical Monograph No. 14. Harpenden. 595
596
Avery, B.W. & Catt, J.A. 1991. The soil at Rothamsted. Lawes Agricultural Trust, IACR-597
Rothamsted, Harpenden, UK, pp.44. 598
599
Bain, D.C. & Griffen, D.T. 2002. Possible effects of land use on the clay mineralogy of a 600
Barré P., Velde, B., Catel, N. & Abbadie, L. 2007a. Soil-plant potassium transfer: impact of 602
plant activity on clay minerals as seen from X-ray diffraction. Plant Soil, 292, 137-146. 603
604
Barré P., Velde, B. & Abbadie, L. 2007b. Dynamic role of ‘illite-like’ clay minerals in 605
temperate soils: facts and hypotheses. Biogeochemistry, 82, 77-88. 606
607
Barré P., Velde, B., Fontaine, C., Catel, N. & Abbadie, L. 2008. Which 2:1 clay minerals are 608
involved in the soil potassium reservoir? Insights from potassium addition or removal 609
experiments on three temperate grassland soil clay assemblages. 610
Doi:10.1016/j.geoderma.2008.05.022 611
612
Barak, P., Jobe, B.O., Krueger, A.R., Peterson, L.A. & Laird, D.A. 1997. Effects of long-term 613
soil acidification inputs in Wisconsin. Plant and Soil, 197(1), 61-69. 614
615
Bascomb, C.L. 1964. Rapid method for the determination of cation exchange capacity of 616
calcareous and non-calcareous soils. Journal of the Science of Food and Agriculture 15, 821-617
823. 618
619
Blake, L., Goulding, K.W.T., Mott, C.J.B., & Johnston, A.E. 1999. Changes in soil chemistry 620
accompanying acidification over more than 100 years under woodland and grass at Rothamsted 621
Experimental Station, UK. European Journal of Soil Science, 50(3), 401-412. 622
623
Blake, L., Goulding, K.W.T., Mott, C.J.B., & Poulton, P.R. 2000. Temporal changes in 624
chemical properties of air-dried stored soils and their interpretation for long-term experiments. 625
Catt, J.A. & Hodgson, J.M. 1976. Soils and geomorphology of the chalk in South-East 627
England. Earth Surface Processes, 1, 181-193. 628
629
Chappell, M.A. & Evangelou, V.P. 2000. Influence of added K+ on inducing ammonium 630
fixation and inhibiting nitrification. Soil Science, 165(5), 420-426. 631
632
Chen, X., Zhu, Y., Hong, M., Kappler, A. & Xu, Y. 2008. Effects of different forms of 633
Nitrogen fertilisers on arsenic uptake by rice plants. Environmental Toxicology and Chemistry, 634
4, 881-997. 635
636
Christidis, G.E., Scott, P.W. & Dunham, A.C. 1997. Acid activation and bleaching capacity of 637
bentonites from the islands of Milos and Chios, Aegean, Greece. Applied Clay Science, 12, 638
329-347. 639
640
Churchman, G.J., Burke, C.M. & Parfitt, R.L. 1991. Comparison of various methods for the 641
determination of specific surfaces of sub soils. Journal of Soil Science, 42, 449-461. 642
643
Curtin, D. & Smillie, G.W. 1976. Estimation of components of soil cation exchange capacity 644
from measurements of specific surface and organic matter. Soil Science Society America 645
Journal, 40, 461-462. 646
647
Deist, J. & Talibudeen, O. 1967a. Ion exchange in soils from the ion pairs Ca, Rb and K-648
Na. Journal of Soil Science, 18(1), 125-137. 649
650
Science, 18(1), 138-149. 652
653
Drits, V.A. & Manceau, A. 2000. A model for the mechanism of Fe3+ to Fe2+ reduction in 654
Dioctahedral smectites. Clays and Clay Mineralogy, 48(2), 185-195. 655
656
Egli, M., Mirabella, A., Sartori, G., Giaccai, D., Zanelli, R. & Plotze. M. 2007. Effect of slope 657
aspect on transformation of clay minerals in Alpine soils. Clay Minerals, 42, 373 - 398. 658
659
Favre, F., Tessier, D., Abdelmoula, M., Génin, J.M., Gates, W.P. & Boivin, P. Iron reduction 660
and changes in cation exchange capacity in intermittently waterlogged soil. European Journal 661
of Soil Science, 53, 175-183. 662
663
Goulding, K.W.T. & Talibudeen, O. 1979. Potassium reserves in a sandy clay soil from the 664
Saxmundham Experiment: Kinetics and equilibrium thermodynamics. Journal of Soil Science, 665
30, 291-302. 666
667
Heilman, M.D., Carter, D.L. & Gonzalez, C.L. 1965. The ethylene glycol monoethyl ether 668
(EGME) technique for determining soil-surface area. Soil Science, 100, 409-413. 669
670
Huggett, J.M. & Cuadros, J. 2005. Low-temperature illitization of smectite in the late Eocene 671
and early Oligocene of the Isle of Wight (Hampshire basin), U.K.. American Mineralogist, 90, 672
1192-1202. 673
674
Huggett, J.M. & Knox, R.W.O’B. 2006. Clay mineralogy of the Tertiary onshore and offshore 675
Jobbágy, E.G. & Jackson, R.B. 2001. The distribution of soil nutrients with depth: Global 677
patterns and imprint of plants. Biogeochemistry, 53, 51-77. 678
679
Jobbágy, E.G. & Jackson, R.B. 2004. The uplift of soil nutrients by plants: Biogeochemical 680
consequences across scales. Ecology, 85(9), 2380-2389. 681
682
Johnston, A.E. 1997. The value of long term field experiments in agricultural, ecological and 683
environmental research. Advances in Agronomy, 59, 291-333. 684
685
Johnston, A.E., Goulding, K.W.T. & Poulton, P.R. 1986. Soil acidification during more than 686
100 years under permanent grassland and woodland at Rothamsted. Soil Use and Management, 687
2, 3-10. 688
689
Jolivet, C., Arrouyas, D., Lévéque, J., Andreux, F. & Chenu, C. 2003. Organic carbon 690
dynamics in soil particle seperates of sandy Spodosols when forest is cleared for maize 691
cropping. European Journal of Soil Science, 54, 257-268. 692
693
Kaiser, K., Eusterhues, K., Rumpel, C., Guggenberger, G. & Kögel-Knabner, I. 2002. 694
Stabilization of organic matter by soil minerals – investigations of density and particle-size 695
fractions from two acid forest soils. Journal of Plant Nutrition and Soil Science 165, 451-459. 696
697
Khaled, E.M., & Stucki, J.W. 1991. Iron oxidation state effects on cation fixation in smectites. 698
Soil Science Society America Journal, 55, 550-554. 699
Kim, J., Dong, H., Seabaugh, J., Newell, S.W. & Eberl, D.D. 2004. Role of microbes in the 702
smectite-illite reaction. Science, 303, 830-832. 703
704
Kostka, J.E., Wu, J., Nealson, K.H. & Stucki, J.W. 1999. The impact of structural Fe(III) 705
reduction by bacteria on the surface chemistry of smectite clay minerals. Geochimica et 706
Cosmoschimica Acta, 63(22), 3705-3713. 707
708
Lanson, B. 1993. DECOMPXR, X-ray decomposition program. ERM (Sarl), Poitiers, France. 709
710
Lanson, B. 1997. Decomposition of experimental X-ray diffraction patterns (profile fitting): a 711
convenient way to study clay minerals. Clays and Clay Minerals, 45, 132 146. 712
713
Lanson, B. & Besson, G. 1992. Characterization of the end of smectite- to illite-714
transformation: Decomposition of X-ray patterns. Clays and Clay Minerals, 40, 40-52. 715
716
Lanson, B. & Velde, B. 1992. Decomposition of X-ray diffraction patterns, a convenient way 717
to describe complex I/S diagenetic evolution. Clays and Clay Minerals, 40, 629-643. 718
719
Lobe, I., Amelung, W. & Du Preez, C.C. 2001. Losses of carbon and nitrogen with prolonged 720
arable cropping from sandy soils of the South African Highveld. European Journal of Soil 721
Science, 52, 93-101. 722
723
Mathe, V., Meunier, A. & Leveque, F. 2007. Anthropic acceleration of a natural clay mineral 724
reaction in marshland soils (Atlantic Coast, France). Clay Minerals, 42, 1 - 12. 725
Matocha, C.J. & Coyne, M.S. 2007. Short term response of soil iron to nitrate addition. Soil 727
Science Society America Journal, 71(1), 108-117. 728
729
McGahan, D.G., Southard, R.J. & Zasoski, R.J. 2003. Mineralogical comparison of 730
agriculturally acidified and naturally acidic soils. Geoderma, 114, 355-368. 731
732
Mikutta, C., Lang, F. & Kaupenjohann, M. 2004. Soil organic matter clogs mineral pores: 733
Evidence from1H-NMR and N2 adsorption. Soil Science Society America Journal, 68, 1853-734
1862. 735
736
Moore, D M & Reynolds, R C. 1997. X-Ray Diffraction and the Identification and Analysis of 737
Clay Minerals, Second Edition. Oxford University Press, New York. 738
739
Pernes-Debuyser, a., Pernes, M., Velde, B. & Tessier, D. 2003. Soil mineralogy evolution in 740
the INRA 42 plots experiment (Versailles, France). Clays and Clay minerals, 5195, 577-584. 741
742
Petersen, L.W., Moldrup, P., Jacobsen, O.H. & Rolston, D.E. 1996. Relations between specific 743
surface area and soil physical and chemical properties. Soil Science, 161(1), 9-20. 744
745
Poulton, P.R., Pye, E., Hargreaves, P.R. & Jenkinson, D.S. 2003. Accumulation of carbon and 746
nitrogen by old arable land reverting to woodland. Global Change Biology, 9, 942-955. 747
748
Reynolds, R C & Reynolds, R C. 1996. Description of Newmod-for-Windows™. The 749
calculation of one-dimensional X-ray diffraction patterns of mixed layered clay minerals. R C 750
Righi, D., Velde, B. and Meunier, A. 1995. Clay stability in clay-dominated soil systems. 752
Clay Minerals, Vol. 30, 45-54. 753
754
Silvertown, J., Poulton, P., Johnston, E., Edwards, G., Heard, M. & Biss, P.M. 2006. The Park 755
Grass Experiment 1856-2006: Its contribution to ecology. Journal of Ecology, 94, 801-814. 756
757
Singh, B. & Goulding, K.W.T. 1997. Changes with time in the potassium content and 758
phyllosilicates in the soil of the Broadbalk continuous wheat experiment at Rothamsted. 759
European Journal of Soil Science, 48, 651-659. 760
761
Siregar, A., Kleber, M., Mikutta, R. & Jahn, R. 2005. Sodium hypochlorite oxidation reduces 762
soil organic matter concentrations without affecting inorganic constituents. European Journal 763
of Soil Science, 56(4), 481-490. 764
765
Siyuan, S. & Stucki, J. 1994. Effects of iron oxidation state on the fate and behaviour of
766
potassium in soils. In: Soil Testing: Prospects for Improving Nutrient Recommendations, p.
767
173−185. Soil Science Society of America Special Publication 40.
768 769
Stanjek, H. & Marchel, C. 2008. Linking the redox cycles of Fe oxides and Fe-rich clay 770
minerals: an example from a palaeosol of the Upper Freshwater Molasse. Clay Minerals, 43, 771
69-82. 772
773
Stucki, J. 1997. Redox processes in smectites: Soil environmental significance. Advances in
774
GeoEcology, 30, 395−406.
Stuki, J.W. & Huo, D. 1996. Effects of cation competition on Potassium fixation. Illinois 777
Fertiliser Conference Proceedings. 778
779
Stucki, J.W. & Kostka, J.E. 2006. Microbial reduction of iron in smectite. C.R. Geoscience, 780
338, 468-475. 781
782
Ulrich, B. 1991. An ecosystem approach to soil acidification. In Soil Acidity (eds B. Ulrich & 783
M.E. Sumner), pp.28-79. Springer-Verlag, Berlin. 784
785
U.S.D.A. 1992. Soil Survey Staff. Key to taxonomy, SMSS Technical Monograph No.19; 5th 786
Edition, Pocahontas Press Inc., Blacksburg, Virginia. 787
788
Velde, B. 2001. Clay minerals in the agricultural surface soils in the Central United States. 789
Clay Minerals 36, 277-294. 790
791
Velde, B. & Peck, T. 2002. Clay mineral changes in the Morrow Experimental Plots, 792
University of Illinois. Clays and Clay Minerals, 50(3), 364-370. 793
794
Velde, B., Goffé, B. & Hoellard, A. 2003. Evolution of clay minerals in a chronosequence of 795
poldered sediments under the influence of a natural pasture development. Clays and Clay 796
Minerals, 51(2), 205-217. 797
798
Wilson, M.J., Blake, L. & Goulding, K. 1994. Effects of acid precipitation upon soil clay 799
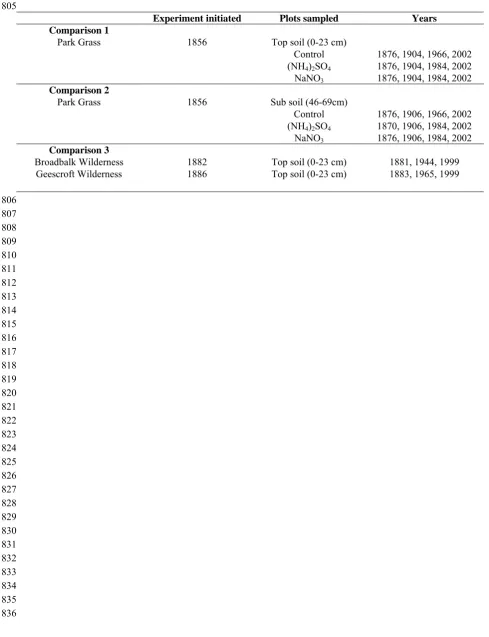
mineralogy as assessed by the Rothamsted Classical Field Experiments. 16th General meeting 800
Table 1: Resume of samples from the Rothamsted Classical Experiment archive used in the
802
current work.
803 804 805
Experiment initiated Plots sampled Years Comparison 1
Park Grass 1856 Top soil (0-23 cm)
Control 1876, 1904, 1966, 2002
(NH4)2SO4 1876, 1904, 1984, 2002
NaNO3 1876, 1904, 1984, 2002
Comparison 2
Park Grass 1856 Sub soil (46-69cm)
Control 1876, 1906, 1966, 2002
(NH4)2SO4 1870, 1906, 1984, 2002
NaNO3 1876, 1906, 1984, 2002
Comparison 3
Broadbalk Wilderness 1882 Top soil (0-23 cm) 1881, 1944, 1999 Geescroft Wilderness 1886 Top soil (0-23 cm) 1883, 1965, 1999
Table 2: Particle size distributions for samples taken from each experiment. Averages are
837
based on all samples analysed from each experiment. 838
839 840
Experiment (sample) Sand 2mm - 63µm
Silt 63 - 2µm
Coarse Clay 2 – 0.2µm
Fine Clay < 0.2µm
% % % %
Park Grass (top soil) Mean 16.5 72.5 8.5 2.5
(n=12) SD 4.5 3.6 1.2 0.8
Park Grass (sub soil) Mean 11.8 59.9 15.7 12.5
(n=12) SD 5.7 6.1 1.2 2.6
Geescroft Wilderness (top soil) Average 21.4 60.3 12.7 5.6
(n=3) SD 1.1 2.4 1.3 1.2
Broadbalk Wilderness (top soil) Average 21.1 61.1 13.5 4.3
(n=3) SD 1.7 3.2 3.1 1.5
Table 3: Measured properties of top (0-23 cm) and sub soil (46-69 cm) fine clay fractions.
871
CEC and surface area properties are shown before and after the removal of organic carbon. 872
Values from the Park Grass Experiment are the mean of the 3 treatment plots from the earliest 873
sampling point of the time series (1870/1876). Values from the Geescroft (1883) and 874
Broadbalk (1881) Wilderness are also the earliest point of their respective time series. 875
876 877
Experiment (sample) Treatment OC CEC Surface Area
% cmolc kg-1 m2 g-1
Park Grass (top soil) none Mean 10.7 78.4 68
SD 2.8 3.5 18
Park Grass (top soil) OC leached Mean Nm 70.6 366
SD Nm 5.2 31
Park Grass (sub soil) none Mean 1.1 56.0 362
SD 0.1 2.3 36
Park Grass (sub soil) OC leached Mean Nm 55.8 348
SD Nm 4.2 13
Geescroft Wilderness (top soil) none 2.61 61.2 333
OC leached Nm 68.3 358
Broadbalk Wilderness (top
soil) None 3.19 64.2 303
OC leached Nm 49.0 328
878
Nm = Not measured 879
Table 4: Properties of XRD traces obtained after peak decomposition for top and sub soil samples. The range and average values are taken from all
measurements for each experiment over the period 1870 – 2002 for the Park Grass Experiment, 1883 – 1996 for the Geescroft Wilderness and
1881- 1996 for the Broadbalk Wilderness.
Experiment (sample) High smectite I/S Low smectite I/S ‘Illite’
Å FWHM % Area Å FWHM % Area Å FWHM % Area
Park Grass (top soil) Range 14.5 -15.3 1.7 -2.0 46 - 69 11.9 -13.1 1.0 -1.73 11 - 37 11.1 -11.5 0.58 -1.5 7 -29
Mean 14.82 1.85 61 12.54 1.34 21.6 11.26 1.06 17.44 SD 0.27 0.12 7.14 0.38 0.2 8.20 0.13 0.28 7.57
Park Grass (sub soil) Range 14.7 – 15.4 1.5 – 2.05 50 -74 12.4 – 12.9 0.81 – 1.39 6 – 35 11.2 – 11.5 0.92 – 1.35 13 – 24
Mean 15.0 1.88 63.22 12.65 1.19 18.89 11.27 1.09 17.9 SD 0.25 0.16 7.85 0.17 0.2 9.27 0.1 0.13 3.7
Geescroft Wilderness (top soil) Range 14.7 – 15.3 1.86 – 2.25 64 - 79 12.4 – 13.0 1.08 – 1.6 9 - 29 11.2 – 11.5 0.82 – 1.16 7 – 15
Mean 14.9 2.0 71.3 12.6 1.3 17.3 11.3 1.0 11.8
SD 0.3 0.2 0.2 0.3 0.3 8.9 0.1 0.1 0.1
Broadbalk Wilderness (top
soil) Range 14.5 – 15.1 1.62 – 2.22 43 - 73 12.0 – 12.9 1.1 – 1.9 8 - 49 11.1 – 11.4 0.8 – 1.2 8 – 21
Mean 14.8 1.9 55.5 12.4 1.5 31.5 11.2 0.9 12.8
Figure Captions:
Figure 1: Typical air-dry, glycol-solvated and heated XRD traces for the <0.2 um clay fraction of a
sub soil taken from the Park Grass Experiment. Sample shown is from the Park Grass Experiment, 1906 Control Plot, 46-69cm.
Figure 2: Decomposition of an air-dry XRD trace for the <0.2 µm clay fraction from a Rothamsted
top soil sample. Sample shown is from the Park Grass Experiment, 1876, Plot 3, 0-23 cm.
Figure 3: Changes in top soil pH (0-23cm) with time in samples taken from the (i) control (●), (ii)
(NH4)2SO4 (□) and (iii) NaNO3 (▲) plots from the Park Grass Experiment. The point for 1856 (),
is an estimated value for the start of the experiment taken from Johnston et al. (1986).
Figure 4: Changes in (a) exchangeable K, (b) exchangeable Ca, (c) exchangeable Mg and (d)
exchangeable Na in top soil (< 2 mm) taken from the unlimed (i) control (ii) (NH4)2SO4 and (iii) NaNO3 plots of the Park Grass Experiment.
Figure 5: Changes in d(001) spacing with time in (a) high smectite I/S, (b) low smectite I/S and (c)
‘illite’ phases identified using peak decomposition for XRD traces from Park Grass (i) control (●), (ii) (NH4)2SO4 (□) and (iii) NaNO3 (▲) plots analysed from the Park Grass Experiment (0-23 cm).
Figure 6: Sub soil (a) pH, (b) exchangeable K, (c) exchangeable Ca, (d) exchangeable Mg and (e)
Figure 7: Changes in d(001) spacing with time in (a) high smectite I/S, (ii) low smectite I/S and
(iii) ‘illite’ phases identified using peak decomposition for XRD traces from Park Grass (i) control (●), (ii) (NH4)2SO4 (□) and (iii) NaNO3 (▲) plots analysed from the Park Grass Experiment (46-69 cm).
Figure 8: Changes in top soil pH with time in Broadbalk (□) and Geescroft Wildernesses (●).
Figure 9: Changes in d001 spacing with time in (i) high smectite I/S, (ii) low smectite I/S and (iii)