ISSN: 1992-8645 www.jatit.org E-ISSN: 1817-3195
42
NEW METHOD TO IMPROVING HYDROGEN PRODUCTION
BY AN ADAPTIVE PHOTOVOLTAIC SYSTEM AND
P&O ALGORITHM
1SANAE DAHBI , 1ABDELHAK AZIZ , 1NAIMA BENAZZI, 1MOHAMED ELHAFYANI
1
Laboratory of Electrical Engineering and Maintenance, Higher School of Technology Oujda, Morocco
E-mail: [email protected]
ABSTRACT
The idea of hydrogen production by water electrolysis from renewable sources is one of the most obvious methods. It could not only lead to a significant reduction in greenhouse gas emissions, but also to increase the security of energy supply due to the method of clean storage. In this paper, we have borrowed a new method for hydrogen production by adapting the electrolysis to a photovoltaic (PV) source, in order to produce the maximum of hydrogen. The electrolysis is considered as well as an electrical load connected to the photovoltaic system via a DC/DC buck converter, having a system control tracking of maximum power point MPPT P&O, which allows the maximization and control of the power transferred to the electrolysis. Furthermore, this study shows that the maximum hydrogen production is not related to the quantity of water to be electrolyzed, but the need to control the water flow which enters electrolysis according to variations of the power arising from weather changes. The overall results show that for constant power, water flows are simulated by injecting constant resistive loads.
Keywords: Hydrogen, Electrolysis Of Water, Photovoltaic Systems, MPPT Control, P&O, DC-DC Converter, Electric Charge, Water Flow.
1. INTRODUCTION
The relentless increase in oil prices due to dwindling reserves [1] and global warming blamed by the emission of carbon dioxide CO2 related to the use of fossil fuels [2], lead to the search for new production strategies and energy supply. Even so, these strategies must take into consideration respect of the environment. Hydrogen is positioned as the best candidate offering the possibility of cleaner production and also in the short term availability of abundant energy.
Several methods allow production of hydrogen with various levels of maturity. In 2010, 95% of the hydrogen produced in the world comes from methane (natural gas) through steam reforming. The remaining 5% are mainly produced by the electrolysis of water [3] [4]. This latter method seems to be the most ecological solution for producing hydrogen. It allows through the use of an electric current, to decompose the water molecule (H2O) in its basic molecular components, that is hydrogen (H2) and oxygen (O2). However, this dissociation reaction called
electrolysis requires a supply of energy which should come from clean source energy. This very promising electrolysis process can take place using one of the three main types of electrolytes: alkaline electrolyte, electrolyte of proton exchange membrane (PEM) and high temperature electrolyte [5] [6] [7].
Currently, this sector of hydrogen production is still hampered by a bad overall yield and a very expensive production. First, the cost of the electrolyte and the electro catalysts based on noble metals are very high (about 100 €/m² for the membrane), and on the other hand, the yield of an alkaline electrolysis is relatively low around 65-70% (system performance).
43 In this study, two improvement strategies have been raised and treated to improve the production of hydrogen:
• Optimization of the electrolytic process, by considering the electrolysis as a variable resistive load connected to a photovoltaic system adapted by a DC/DC converter buck, having itself a digital control system (MPPT). The assembly allows maximum extraction of the power delivered by a photovoltaic generator, and almost total transfer to the electrolysis.
• The control of water flow to be injected into the electrolysis taking account of the power transferred by the PV system for maximum hydrogen production .
In the next, we present and analyze the model of a photovoltaic panel and the proposed algorithm control MPPT based on the principle of variable step and acceleration mechanism. Finally, we present simulation results to evaluate this new method to improving hydrogen production control algorithm and some conclusions are drawn.
2. PHOTOVOLTAIC-ELECTROLYSIS SYSTEM
[image:2.612.319.528.51.206.2]In this paper we considered that the electrolysis is connected to the photovoltaic system according to the diagram in “Figure 1”.
Figure 1: Diagram Of A Photovoltaic System Supplies Electrolysis.
2.1 Photovoltaic System
A block of PV panel is implemented in Proteus Isis; it consists of 50 elementary photovoltaic cells “Figure 2” and can deliver in standard test conditions 174W of power, a current of 8.3A under optimum voltage of 24V.
The current–voltage and power-voltage characteristics of the PV array (for Np=30 the number of cells in parallel and Ns=1 the number of cells in series) are represented in “Figure 3” and “Figure 4”.
Figure 2: Equivalent Circuit Of A Solar Cell
2.2 Maximum Power Point Tracking Converter
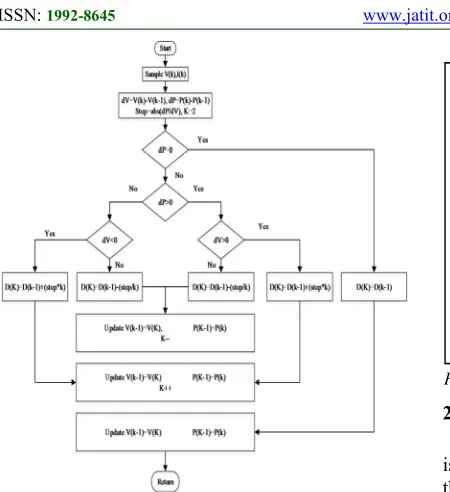
This section describes the Maximum Power Point Tracking Converter (MPPTC) that is located between the solar arrays and the electrolysis. The main purpose is to draw the maximum power from the solar array and deliver to the electrolysis. The Maximum Power Point Tracking (MPPT) using in the control is the algorithm Perturb & Observe (P&O) with variable step size and acceleration mechanism [12] as shown in “Figure 5”.
[image:2.612.317.525.414.699.2]This algorithm is dedicated to finding a simple and effective way to improving precision tracking and faster response time to quickly get the MPP, as well transfers the maximum obtainable power from the solar array to the output side of the converter.
Figure 3: Current-Voltage Curves Of The PV
[image:2.612.89.301.456.548.2]ISSN: 1992-8645 www.jatit.org E-ISSN: 1817-3195
[image:3.612.186.522.66.275.2]44
Figure 5: Perturb & Observe Algorithm
2.3 Principle of Electrolysis Water
The Fig. 6 illustrates the fundamental principle of water electrolysis. Thus the electrolysis consists of an anode, a cathode, an electrolyte, and a power supply. By the application of a continuous direct current (DC), the water molecule (H2O) is
dissociated into hydroxide ions (OH-) and hydrogen (H+). In the electrolyte, the hydrogen ions accept electrons and move toward the cathode, and the hydroxide ions lose electrons and move towards the anode.
The half reactions occurring at the cathode and respectively the anode can be written: Cathode: 2H++2e- H2 (g) (1)
Anode : H2O (l) O2 (g) +2H++2e- (2)
The overall reaction of this decomposition:
H2O(l) H2 (g) + O2 (g) (3)
[image:3.612.92.317.74.320.2]
Figure 6 : Fundamental Principle Of Water Electrolysis.
2.4 Relation water flow- power
The masse of hydrogen produced at the cathode is proportional to the amount of current passed through the electrolysis according to the second Faraday law:
n.F
M mH .IS.t
2 =
(4) With:
mH2= mass of hydrogen formed to the electrode (in kg)
M = molar mass of hydrogen (in kg.mole-1) IS = current through the electrolysis (in A) t = time of electrolysis (sec)
n = number of electrons per mole of product formed
F = Faraday's number (F = 96 485 C/mol)
In a PV system, the output power depends on the weather conditions (rapidly changing), then, it would not be wise to use directly the quantity of water to be electrolyzed. Our approach focuses on the flow of water introduced into the electrolysis taking into account the quickly changing conditions. Therefore the hydrogen flow product:
n.F
M t m
mH H S
.
.I
2
2 = =
•
(5)
According to “(3) “.The amount of hydrogen produced is given by the following relationship:
.
2 9
2
• •
= H O
H m m
45 We posing
.
. 9
.
M F n
C= .The amount of hydrogen
produced is given by the following relationship:
.
2 C I mH O= S
•
(7)
In addition, the electric power P available for
electrolyzing water according to the scheme of "Fig.1" is:
P=VS.IS (8) Using “(7)”, “(8)”.
.
2
. s O H
V C
P
m =
•
(9)
This relation shows that the water flow is proportional to the electrical power available. Hence the necessities to control the water flow to be introduced into the electrolysis.
3. RESULTS AND DISCUSSION
We simulated the production of hydrogen by a photovoltaic system via a buck converter energy controlled by the cited MPPT command and supplying a variable resistive load .This load simulates the amount of water to be electrolyzed “Figure 7”.
All simulations are performed in the Proteus Isis environment. That software integrates an analog simulator, logic or mixed, and equipped with a library of analog components, digital and micro-programmed.
To pursue the point of maximum power, we used as component micro-programmed 16F877 microcontroller. Thus, in this element, we implemented a MPPT control algorithm perturb and observe (P&O) aforementioned.
The result of this micro-programmation is to generate pulse width modulated signal (PWM) (square wave signal of variable duty cycle) of frequency 100 KHz and commanding MOSFET converter. The implemented algorithm allows the adjustment of the duty cycle in order to pursue the maximum power point of the PV panel.
[image:4.612.312.524.57.285.2]It is noted that the electrolysis is represented by a variable resistive load consume all the power produced by the PV system.
Figure 7: Photovoltaic/Electrolysis Schema In Isis Proteus
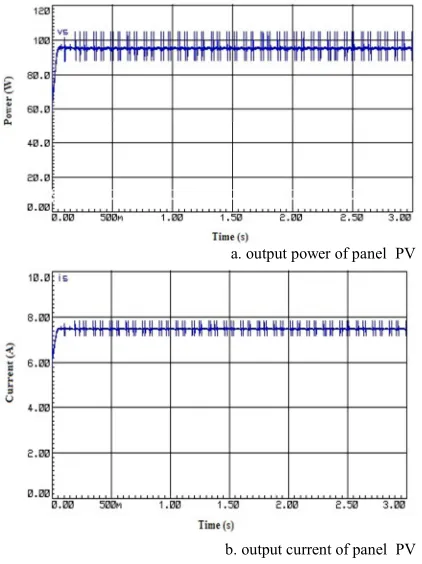
The “Figure 8” and “Figure 9” represent the results of simulations of different electrical quantities (current and power) for two irradiations of 1000 and 600 W/m² at a temperature of 25°C. The simulation analysis and theoretical results show that:
• For an irradiation of 1000W/m² the electrolyzer is represented by a resistive load of 1.5Ω consuming a power of 160W under a current of 10A. It follows that the water flow in the known electrolyzer according to “(9)” is 0.93mg/s. Therefore the hydrogen product flow is 0.103mg/s using “(5)”.
• For an irradiation of 600W/m², the electrolysis is represented by a resistive load of 1.7Ω consuming power 96W at a current of 7.5A. It follows that the water flow injected in the electrolysis according to “(9)” is 0 . 7 mg/s. Therefore the hydrogen product flow is 0.07mg/s using “(5)”.
Based on these analyzes, it seems that the water flow to be introduced into the electrolysis depends only on the power provided by the photovoltaic source PV (and hence of the irradiation).
During these simulations, it seems that the flow of water and hydrogen is constant. This because we have assumed that the power is constant.
ISSN: 1992-8645 www.jatit.org E-ISSN: 1817-3195
46
a. output power of panel PV
[image:5.612.90.331.69.387.2]b. output current of panel PV
Figure 8: Simulation of Electrical Quantities (Power and
Current) for Irradiation of 1000W/m2
a. output power of panel PV
b. output current of panel PV Figure 9: Simulation of Electrical Quantities (Power and
Current) for Irradiation of 600W/m2
4. CONCLUSION
In this work we investigated the optimization of hydrogen production by water electrolysis using a photovoltaic source.
Theoretically, this optimization is justified by two techniques that seem very promising:
• The addition of a controlled converter by an appropriate algorithm in the production process. This means already a full exploitation of solar energy instant available.
• A system that controls the flow of water to be electrolyzed. All our interest is focused on the fact to show that the photovoltaic energy available is proportional to the water flow that enters the electrolysis, not the amount of water present there. Is that we have considered a new technology.
In the simulation part, we modeled the electrolysis by an electrical charge that consumes the same energy as electrolysis placed in sunlight conditions and temperature dictated by the atmospheric conditions. We then determined by calculation the flow of water which should be entering the electrolysis.
Electrical realization of the electrolysis and flow control system with the recovery enclosure of hydrogen can tell us how our suggestions and simulations are good. This is the part that concerns us now and on which we are currently working. We hope that we present it in a future work.
REFRENCES:
[1] J.O.M.Bockris, B.E.Conway, E.Yeager, and R.E.White , “Comprehensive Treatise of Electrochemistry”, Book ,volume 4,1981. [2] F.Mueller-Langer, E.Tzimas, M.Kaltschmitt,
and S.Peteves, ”Techno- Economic Assessment of Hydrogen Production Processes for the Hydrogen Economy for the Short and Medium Term” ,Hydrogen Energy
,vol. 32, November 2007, pp.3779-3810. [3] M.A. Rosen, and DS Scott,” Comparative
Efficiency Assessments for a Range of Hydrogen Production Processes,” Hydrogen
Energy, vol. 23, August 1998 pp.653-659.
[image:5.612.91.302.429.711.2]47 Design, Testing, and Modeling”, Hydrogen
Energy, vol. 31, May 2006, pp.797-811,.
[5] M. Momirlan, and T.N.Veziroglu, “ Current status of hydrogen energy”, Renewable and
Sustainable Energy Reviews, vol.6, pp.141 179,
2002.
[6] S.Sato, SY.Lin, Y.Suzuki, and H. Hatano ,” Hydrogen production from heavy oil in the presence of calcium hydroxide”, Journal of Fuel, vol.82, March 2003, pp.561-567.
[7] S.Dunn,” Hydrogen Futures: Toward a Sustainable Energy System,” Hydrogen
Energy, vol.27, March 2002, pp.235–264,
[8] J.Padin, T.N Veziroglu, and A. Shahin, “Hybrid Solar High Temperature Hydrogen Production System”, Hydrogen Energy ,vol.25,April 2000, pp.295-317.
[9] B. Soldi1, I. Gökalp, A. Zeroual, and A. Aymard, ” Modelling a Water Electrolysis Polymer Membrane for Hydrogen Production”,
Review of Renewable Energy ,Vol. 12 , June
2009, pp.201-214.
[10] H. Derbal-Mokrane, A. Benzaoui, A. M’Raoui, and M. Belhamel, ”Feasibility study for hydrogen production using hybrid solar power in algeria”, Hydrogen Energy, vol.36, August 2010, pp.4198-4207.
[11]T.L. Gibson, and N.A. Kelly, ”optimization of solar powered hydrogen production using photovoltaic electrolysis devices” , Hydrogen
Energy, vol.33, September 2008,
pp.5931-5940,.
[12] S. Dahbi, A. Aziz, N.Benazzi, M.Elhafyani, N. Benahmed,” Advanced MPPT controller based on P&O algorithm with variable step size and acceleration mechanism for solar photovoltaic system” Proceedings of Mediterranean Conference on Information &
Communication Technologies
(MedICT2015)”,paper.491.