ISSN: 1992-8645 www.jatit.org E-ISSN: 1817-3195
FEATURE ANALYSIS ON QUEUE LENGTH OF
ASYMMETRIC TWO-QUEUE POLLING SYSTEM WITH
GATED SERVICES
*1WANG XINCHUN, 1LIU YUMING, 1CHENG MAN , AND 1YE QING
1Department of Physical and Electronics, Chuxiong Normal University, Chuxiong, China.
Email: [email protected] , [email protected], [email protected], [email protected]
ABSTRACT
On the basis of establishing mathematical model and defining the parameters and treating embedded Markov chains and probability generating function as math tools, the paper analyzed discrete-time, non-symmetric dual-threshold service queue system precisely, and it derived first order and second order characteristics of the system. The paper calculates the average queue length and average waiting delay of information group. Simulation experiment based on system running mechanism and theoretical calculations have good consistency. The analysis laid the solid foundation for research of gated polling system based on asymmetric multi queue; it further deepens the perception of asymmetric gated polling system; it is meaningful to dominate polling system flexibly.
Keywords: Asymmetric; Two-Queue; Gated Polling System; Feature Of Average Queue Length;
Simulation And Theoretical Calculation
1. INTRODUCTION
As for research difficulty on asymmetric polling system is too great, it is generally that people usually treat analysis and discussion of performance of the asymmetric two polling system as the starting-point so as to laid solid foundation for the research of asymmetric multi queues gated polling system. It is generally believed that queue service system based on periodic inquiry has many applications in communication system and computer network. As for queue service system based on periodic inquiry, the number of information group, service time for information group and shifting time at any time are variable. So, it is quite difficult to analyze related performance. In the study of asymmetric polling system Ref 1-6 give some precise resolution; however, as there are some problems in analysis method the obtained results are partial under certain qualifying conditions.On the basis of Ref 7-9 the paper adopts the method of embedded Markov chains and probability generating function to resolve discrete-time and polling asymmetric double gated service system, deduce one-order and two-order characteristics of the system, calculates the average waiting delay of the system. The paper draws some
useful conclusions by comparing simulation results on the basis of the running mechanism and theoretical calculations.
2. MATHEMATICAL MODEL OF THE
SYSTEM
[image:1.612.316.522.438.620.2]
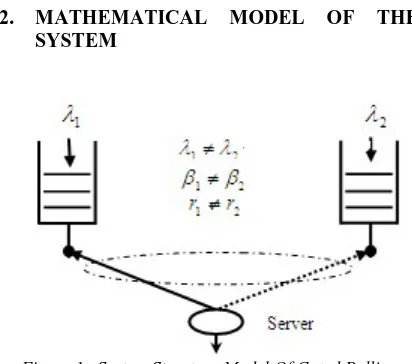
Figure 1. System Structure Model Of Gated Polling System Of Asymmetric Two Queues
2.1Structure model of the system
Figure 1. System structure model of gated polling system of asymmetric two queues
ISSN: 1992-8645 www.jatit.org E-ISSN: 1817-3195
service system accepts services according the way of FIFO for information groups belonging to the same queue. Both Terminal 1 and Terminal 2 work in the means of gated service. In Queue 1, when the service for the former gated information group is expired and new-coming information during the course of the service will be serviced at the next period and switch to the Queue 2 after one conversion period. Queue 2 finishes the service of current gated information group, then, the system switches to Queue 1 and performs the next round service after a shifting time. The system structure model is illustrated in Figure 1
2.2 System Parameters and Working Condition
For any queue, information groups arrived at any unit time is independent identically distributed. Distribution probability general function, mean and variance of information group in the queue are
)
(
i iz
A
、λ
i=
A
i'(
1
)
、 2A
i''(
1
)
i 2ii
λ
λ
σ
λ=
+
−
respectively. In the same way, the probability function of the shifting time, mean and variance
are
B
k(
z
k)
,β
k=
B
k'(
1
)
, 2B
k''(
1
)
k k2k
β
β
σ
β=
+
−
respectively, where i, j k=1, 2. As long as the buffer storage capacity is large enough for each queue, there will not exists the loss of group information. Each customer in the queue is served by the rule of First-come, First-serve.
For the convenience of analysis, the paper defines
stochastic variable
u
i(
n
)
as the shifting time thatwaiter shifts from Queue
i
to Queuei
+
1
at thetime
t
n.v
i(
n
)
is the service time for Queuei
at thetime
t
n by the waiter.µ
j(
u
i)
is the number ofinformation groups when the waiter goes into Queue
j
at the timeu
i.η
j(
v
i)
is the number ofinformation groups when the waiter goes into
Queue
j
at the timev
i .ξ
i(
n
)
is the number ofinformation groups of Queue
i
at the time ofn
t
.i
=
1
,
2
;
j
=
1
,
2
as for non-symmetrical two queues.2.3 Status equation of the system
For the system of asymmetric two-queue gated service there should be
)
(
)
(
0
)
1
(
1 1 1 11
n
η
v
µ
u
ξ
+
=
+
+
(1)
ξ
2(
n
+
1
)
=
ξ
2(
n
)
+
η
2(
v
2)
+
µ
2(
u
2)
(2)At the time
t
n+1 when querying gated servicequeue.
2.4 Probability generating function of the system
Probability generating function of the system of asymmetric two-queue gated service is
=
∏
= ∞ → + + 2 1 2 1 1 ) 1 (lim
)
,
(
j j n i n jz
E
z
z
G
ξ
(3)Combined (1), (2) and (3) the paper obtains probability generating function of the system of asymmetric two-queue gated service is
(
) (
)
1 1 2
2 1 1 2 2 2 1 2 1 1 2 2
( , )
( ) ( ) , ( ( ) ( ))
G z z
R A z A z G z B A z A z
= (4)
(
) (
)
2 1 2
1 1 1 2 2 1 1 1 1 2 2 2
( , )
( ) ( ) ( ( ) ( )),
G z z
R A z A z G B A z A z z
= (5)
The
G
1(
z
1,
z
2)
in (4) is the probability generating function of the status distribution of theQueue 1. The
G
2(
z
1,
z
2)
in (5) is the probabilitygenerating function of the status distribution of the Queue 2.
3. ANALYSIS OF THE SYSTEM
PERFORMANCE
3.1 Resolve one-order characteristics
Define j i z z i
z
z
z
G
j
g
∂
∂
=
→)
,
(
lim
)
(
1 21 ,2 1
2
,
1
;
2
,
1
=
=
j
i
(6)Solve one-order partial derivative of (4) and (5) by (6), and obtain the following by reduction
1 2 2 2 1 2
1
(
1
)
r
λ
g
(
1
)
g
(
2
)
β
λ
g
=
+
+
(7)2 2 2 2 2
1
(
2
)
r
λ
g
(
2
)
β
λ
g
=
+
(8)1 1 1 1 1
2
(
1
)
r
λ
g
(
1
)
β
λ
g
=
+
(9)2 1 1 1 2 1
2
(
2
)
r
λ
g
(
2
)
g
(
1
)
β
λ
g
=
+
+
(10)ISSN: 1992-8645 www.jatit.org E-ISSN: 1817-3195 2 1 2 1 2 2 1 2 1
1
)
(
)
2
(
ρ
ρ
λ
ρ
ρ
−
−
+
−
=
r
r
r
g
(11)2 1 1 2 1 1 2 1 2
1
)
(
)
1
(
ρ
ρ
λ
ρ
ρ
−
−
+
−
=
r
r
r
g
(12)Average length of queue
2 1 1 2 1 1
1
)
(
)
1
(
ρ
ρ
λ
−
−
+
=
r
r
g
(13)2 1 2 2 1 2
1
)
(
)
2
(
ρ
ρ
λ
−
−
+
=
r
r
g
(14)Average cycle time
2 1 2 1 2 1 2 1 1 1 2
1
ρ
ρ
ρ
θ
θ − −
+ = − = =
∑
∑
== r r
r T T i i i i (15)
4. COMPARISON BETWEEN SIMULATION
AND THEORETICAL CALCULATION RESULTS
According to the mechanism of the system the paper compares computer simulation with theoretical calculation results. Assume arrival of each queue at any time slot obeys Poisson distribution and simulation and theoretical calculation adopt the same parameters.
Set polling number
M
=
10
6 . When1
2 1=
r
=
r
,λ
1=
0
.
01
,λ
2=
0
.
04
simulation andtheoretical calculation results of average length of Queue 1 and 2 varying with service rate is illustrated in Figure 2. Set polling number
6
10
3
×
=
M
. Whenr
1=
r
2=
1
,β
1=
1
,β
2=
3
simulation and theoretical calculation results of average length of Queue 1 and 2 varying with arrival rate is illustrated in Figure 3. Set polling
number
M
=
5
×
10
7 . When10
2 1=
β
=
β
,λ
1=
0
.
01
,λ
2=
0
.
04
simulationand theoretical calculation results of average length of Queue 1 and 2 varying with shifting time is illustrated in Figure 4. Assume 2 queues are
symmetrical, set polling number
M
=
5
×
10
7simulation and theoretical calculation results of average length of Queue 1 and 2 varying with the variation of load are illustrated in Figure 5.
5. ANALYSIS AND DISCUSSION
We can obtain it from Figure 2 that the average waiting delay increases with the increase of
i
β
whenλ
i andγ
i are fixed. Compare two sets of curves in Figure 2 and you will find that he averagewaiting delay increases remarkably if
λ
iis larger.Average waiting delay is larger if
λ
iis larger andwhen
β
i is fixed. Simulation and theoreticalresolutions (13) and (14) have good consistency. Although simulation and theoretical resolutions approximately equal, there is a deviation between them. This is mainly due to fewer statistics polling,
[image:3.612.95.533.65.697.2]only
M
=
10
6 . If increasing polling number, proving data quality and decreasing deviation.Figure 2. Comparison Between Simulation And Theoretical Calculation Results Of Average Length Of
[image:3.612.322.523.512.681.2]Queue 1 And 2 Varying With Service Rate
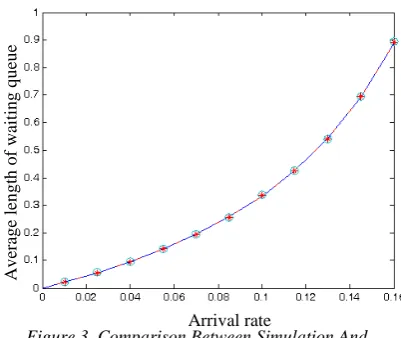
Figure 3. Comparison Between Simulation And Theoretical Calculation Results Of Average Length Of
Queue 1 And 2 Varying With Arrival Rate
ISSN: 1992-8645 www.jatit.org E-ISSN: 1817-3195
We can also obtain it from Figure 3 that the average waiting delay increases with the increase of
i
λ
whenβ
i andγ
i are fixed. Compare two sets of curves in Figure 3 and you will find that the averagewaiting delay increases remarkably if
β
iis larger.Average waiting delay is larger if
β
iis larger andwhen
λ
i is fixed. Simulation and theoreticalresolutions (13) and (14) have good consistency. Simulation and theoretical resolutions approximately equal and there is only little deviation between them. This is mainly due that
[image:4.612.95.307.293.455.2]statistical polling number has reached
M
=
3
×
10
6. If increasing polling numberM
we can improve the quality of data, and further reduce the error.Figure 4. Comparison Between Simulation And Theoretical Calculation Results Of Average Length Of
Queue 1 And 2 Varying With Shifting Time
Figure 5. Comparison Between Simulation And Theoretical Calculation Results Of Average Length Of
Queue 1 And 2 Varying With The Variation Of Load
We can obtain it from Figure 4 that the average
γ
i
λ
andβ
i are fixed. Compare two sets of curves in Figure 4 and you will find that the average waiting delay increases remarkably ifρ
iis larger. Averagewaiting delay of the ones with heavier load is larger when shifting time is fixed. Experimental results and theoretical expressions (13) and (14) have good consistency. Simulation and theoretical resolutions approximately equal and there is only little deviation between them. This is mainly due that
statistical polling number has reached
M
=
3
×
10
6. If increasing polling numberM
we can improve the quality of data, and further reduce the error.We can also obtain it from Figure 5 that the average waiting delay increases with the increase of
i
ρ
whenγ
i is fixed. Simulation and theoretical resolutions (13) and (14) have good consistency. The deviation is least. This is mainly due thatstatistical polling number has reached
M
=
5
×
10
7. If increasing polling numberM
we can improve the quality of data, and further reduce the error.Compare Figure 2, 3, 4, 5 we can figure out that bias between simulation results and theoretical value further reduce with the increase of polling number
M
.The experiments show the error can be manipulated within 1% if the load of asymmetrictwo-queue satisfies 2 0.95
1
≤
∑
=
i i
ρ and polling number
reaches 8
10
≥
M .
Expression (13) and (14) transform to the Expression (6) in Reference [7] when the network is running under the circumstance of symmetry parameters and
N
=
2
.REFERENCE
[1] Ferguson M J, Aminetzah Y J. Exact results for nonsymmetric token ring systems. IEEE Trans Commun, 1985, 33 (3): 223-231.
[2] Everitt D. Simple approximations for token rings. IEEE Trans Commun, 1986, 34: 719-721.
[3] Takinc T, Takahashi Y. Exact analysis of asymmetric polling systems with single buffers. IEEE Trans Commun, 1988, 36 (10): 1119-1127.
[4] Ibe O C, Cheng X. Performance analysis of asymmetric single-buffer polling systems. Shifting time
load
A
ve
ra
ge
l
engt
h o
f w
ai
ti
n
g
que
ue
A
ve
ra
ge
l
engt
h o
f w
ai
ti
n
g
que
ue
ISSN: 1992-8645 www.jatit.org E-ISSN: 1817-3195
[5] Ibe O C, Cheng X. Approximate analysis of asymmetric single-server token-passing systems. IEEE Trans Commun, 1989, 37 (6): 572-577.
[6] Mukherjee B, Kwok C K, Lantz A C, Moh W L M. Comments on exact analysis of asymmetric polling systems with single buffers. IEEE Trans Commun, 1990, 38 (7) : 944-946.
[7] Zhao Dongfeng, Zhen Sumin. Message Waiting Time Analysis for a Polling System with Gated Service. Journal of China of communication, 1994, 15(2): 18-23.