MODELING AND SIMULATION OF QUALITY ANALYSIS
AND QUALITY PREDICTION OF INTERNAL CRACKS IN
CONTINUOUS CASTING BILLET
WENHONG LIUA,*, ZHI XIEA,B
aState Key Laboratory of Synthetical Automation for Process Industries, Northeastern University,
Shenyang 110819, China
b
College of Information Science & Engineering, Northeastern University, Shenyang 110819, China
ABSTRACT
In continuous casting, it is very important to predict and detect the internal cracks of billet in time for ensuring continuous production, improving product quality and reducing production costs. Clustering analysis (CA) method is adopted to do feature extraction and classification for on-site data, by which ladder parameter tables of processing parameters and defect grades of internal cracks are got. Fault tree analysis (FTA) method is adopted to analyze the effects of processing parameters on internal cracks. The solidification speed of billet is calculated by solidification heat-transfer model. Quality prediction model of internal cracks in continuous casting billet is established by quality prediction function, based on clustering analysis model of on-site data, FTA model and solidification heat-transfer model. Some samples of Steel Grade 1008 are selected for testing the quality prediction model. The percentage of accuracy for the quality prediction is 80 percent, which provides the foundation for industry application.
Keywords: Fault Tree Analysis (FTA), Minimum Cut Set, C-Means Clustering Method, System Clustering
Method
1. INTRODUCTION
Internal cracks defect is one of main quality defects of continuous casting billet. They directly affect product quality, especially for the next process. So it is one of main problems to detect or get rid of the internal cracks for high-performance continuous casting procedure. The analysis and grading for quality defects is carried out according to defect grading map and grading standard in metallurgy industry. The defect grading maps of macrostructure of continuous casting billet are offered by actual pictures. However, this grading is done under cold conditions and the delay is unfavorable for production. So it is necessary that some other method is presented to replace the conventional one.
In this paper, quality analysis and quality prediction system of internal cracks in continuous casting billet is specially presented to settle this problem. In the production process of continuous casting billet, grading quality defect is necessary for the next production technology. The qualified billets are directly delivered to rolling mill for effective save energy. The billets with some defects
are treated off line for the next production technology. And the billets with severe defects are abandoned to reduce the cost of the next rolling [5]. In the quality analysis model, the mechanisms of crack formation and the influencing factors are systemically studied [7], [11], the FTA-based model of quality analysis of internal cracks is set up and the model is verified by on-site data in some plant. In the quality prediction model, there are process monitoring, data acquisition and quality defect prediction. During quality prediction, the on-line reheat of the surface of the strand and solidification speed rate are calculated by solidification heat-transfer model and on-line processing parameters. Combined with the prediction parameter tables from the quality analysis model, the defect grade of internal crack is calculated by the quality prediction function.
2. QUALITY ANALYSIS MODEL
columnar-crystals notch effect theory, sulfide embrittlement theory, particle deposit theory and solidification shrinkage theory are from metallurgy standpoint. And liquid film theory and intensity theory are from solidification standpoint. These theories disclose the causes of internal cracks formation from different points of view. However, internal cracks essentially appear when stress and strain of solidification front edge exceed critical stress and critical strain [10], [12], [6], [13], [1].
Critical stress theory is that internal cracks appear when stress of solidification shell exceeds critical stress of solidification area. The equations are showed as the following:
c
σ
σ
> (1)T
E
ε
σ
=
(2)MPa c=1~3
σ
(3)Where
σ
,σ
c, E andε
T represent actual stress,critical stress, Young’s modulus and total strain.
Critical strain theory is that internal cracks appear when total strain of solidification shell exceeds critical strain of solidification area. The equations are showed as the following:
c T
ε
ε
>
(4)t m S B
T
ε
ε
ε
ε
ε
=
+
+
+
(5)%
%~
=
0
.
2
0
.
5
c
ε
(6)2 1600 l S B B
δ
ε
= (7)t ES Pl B 3 4 32 =
δ (8)
) 1 1 )( 2 ( 100 1 + − − × = i i S R R S d
ε (9)
2 300 l S m m δ
ε = (10)
% %~0.2 1 . 0 =
t
ε (11)
Where
ε
T,ε
B,ε
S,ε
m,ε
t, S, l, t, d, R,δ
mand Prepresent total strain, bulging strain, straightening strain, non-alignment strain, thermal stress strain, shell thickness, distance between rolls, time of passing rolls, billet thickness, radius of curvature, non-alignment amount and static pressure of liquid steel.
From the mechanisms of internal cracks formation, there are many causes affecting internal cracks formation, and it is difficult to analyze their internal relations and affect degree only from the given equations. Therefore, it is necessary to seek one type of effective analysis method [2], [3].
Fault tree analysis (FTA) is one important method to evaluate reliability and security of complex system. This method acts the event not hoping to happen as the top event of fault tree, looks for the direct factors and causes as middle events enabling the top event to happen, and then lucubrates till finds all basic causes, i.e. base events. The data of base events are known, counted or gained by test. That is, fault tree is one inverse logic tree including top event as root and middle events and base events as branches.
For the complex of FTA and actual application, Visual C++6.0 is adopted to develop the visual analysis system and analysis calculation is automatically carried out by computer [8].
Fig.1. Block Diagram Of Modules Used In FTA Software
FTA software can automatically establish fault tree and do qualitative analysis and quantitative analysis in graph interface. It mainly includes FT drawing module, FT editing module with moving, order number modification and deletion, data input module of base events, predigestion module, analysis module by moving events to simplify the complex fault tree, qualitative analysis module by solving the minimum cut set, quantitative analysis module and file memory module. Fig.1 shows the block diagram of modules.
3. QUALITY PREDICTION MODEL
The processing parameter data and the on-site defect data are different and it is the basis for data analysis to find out one suitable data analysis method. Clustering analysis method is adopted for feature extraction and classification.
Clustering analysis method is one of multivariate statistical analysis methods, and it is also one important branch of non-supervision recognition. Clustering analysis method has been applied in pattern recognition, data mining, computer vision and fuzzy control [9], [4].
According to the features of system clustering method, c-means clustering method and on-site data, the analysis program of feature extraction is established. When the sample data amount is less than 100, the system clustering method is adopted for data analysis and skeleton map of c-means clustering method is adopted for certificating the classification rationality. When the sample data amount is equal to or more than 100, the c-means clustering method is adopted for data analysis and skeleton map of c-means clustering method is adopted for certificating the classification rationality. Figure 2 shows the corresponding flowchart.
The data sorts include sampling time, batch number, strand number, main steel composition (C content, Si content, Mn content, P content and S content), Mn/S, superheat, casting speed, water flowrate of segment 0, water flowrate of segment 1, water flowrate of segment 2, total water flowrate and water flowrate ratio.
The treated data amount of steel grade 1008 is 27163, and the data sorts include superheat, casting speed, water flowrate ratio, total water flowrate, water flowrate of segment 0, water flowrate of segment 1, water flowrate of segment 2, C content, P content, S content and Mn/S. The c-means clustering method is adopted for data analysis and skeleton map of c-means clustering method is adopted for certificating the classification rationality because the sample data amount is more than 100.
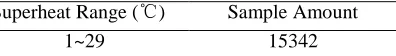
The superheat range of steel grade 1008 is from
1 ℃ to 83℃. The superheat data are classified to five clusters according to the five defect grades (0, 1, 2,
[image:3.612.315.523.75.151.2]3, 4). Table.1 shows the clustering results of superheat.
Table.1. Clustering Results Of Superheat
Superheat Range (℃) Sample Amount
1~29 15342
30~34 5451
35~39 3342
40~49 1940
50~83 1088
The distributions of actual processing parameters
[image:3.612.314.520.317.415.2]are different for different steel grades. High superheat is favorable for columnar crystals growing and intergranular inclusion gathering, which supplies the condition of internal cracks formation and expansion. That is, the exponential of defect grade of internal cracks is increasing. The clustering analysis divides the superheat data into five clusters, and according to metallurgy experts and on-site technical staffs, the ladder parameter table of superheat is established and showed as table.2.
Table.2. Ladder Parameter Table Of Superheat
Defect Grade
Superheat Range of Steel Grade
1008 (℃)
0 △T<30
1 30≤△T<35
2 35≤△T<40
3 40≤△T<50
4 50≤△T
According to the above analysis process, the other ladder parameter tables of processing parameters of steel grade 1008 are established by c-means clustering method, including casting speed, water flowrate ratio, total water flowrate, water flowrate of segment 0, water flowrate of segment 1, water flowrate of segment 2, C content, P content, S content and Mn/S.
There are several causes that result in internal cracks formation, and the effect degrees of the causes are different. According to the different effect degrees, the weighting coefficients are individually given. The quality prediction function of internal cracks of continuous casting billet is given as formula 12 and formula 13.
r r T T CA
CA W D W D W
D
D= × + ∆ × ∆ + × (12)
i i
CA d w d w d w
D = 1× 1+ 2× 2++ × (13)
Where DCA, D∆T, Dr, WCA, W∆T,
W
r, di and wi [image:3.612.100.298.699.727.2]solidification speed, quality prediction grade of some single cause in clustering analysis and weighting coefficient of some single cause in clustering analysis.
The quality prediction function divides the internal cracks into 5 grades (0, 1, 2, 3, 4), and 0 grade is the lowest one and 5 grade is the highest and severest one.
The quality prediction model is established based on quality prediction function and analysis results of quality analysis model. According to processing parameters of production process, the defect grade of internal cracks is predicted in quality prediction model.
Fig.2. Flowchart Of Quality Prediction Model
The quality analysis model supplies quality prediction parameters for the quality prediction model, including prediction parameters of FTA analysis, prediction parameters of surface reheat and prediction parameters of solidification speed. The on-line surface reheat and on-line solidification speed are calculated according to solidification heat-transfer model and on-line processing parameters. And the quality prediction grade of internal cracks is calculated by quality prediction function. Fig.2 shows the flowchart of quality prediction model.
4. SIMULATION AND ANALYSIS
Based on FTA theory and the mechanisms of internal cracks formation, the internal cracks is acted as the top event of fault tree, which is decomposed into external strain causes and internal strain causes. Then the middle events and base events are found and the whole fault tree of the internal cracks is finally established. The events are numbered, automatically calculated and analyzed.
After the fault tree is automatically established, the on-site data of Steel Grade Q235 in some plant are leaded into the FTA software by data base. And then the minimum cut set, the probability and importance of the base events and the probability of top event are calculated. The results are showed as the following:
(1) Minimum cut set is B1, B2, B3, B4, B5, B6, B7, B8, B9, B10 and B11·B12.
(2) Range, probability and importance of base events are showed as table.3.
(3) Probability of top event is 23.41 percent.
(4) Statistic probability of internal cracks from on-site data is 20.83 percent.
Table.3. Range, Probability And Importance Of Base Events
No. Meaning and Range Probability Importance
B1 Superheat>42℃ 0.1032 0.844676
B2 Casting
Speed>1.90m/min 0.1062 0.856962
B3 Water Ratio
<1.50L/kg 0.0067 0.771119
B4 Total Water Flowrate>35.0L/min 0.0005 0.766336
B5
Total Water Flowrate <25.0L/min
0.0074 0.771663
B6 Q0<13.0L/min 0.0183 0.780231
B7 Q1<10.0L/min 0.0082 0.772285
B8 Q2<2.00L/min 0.0900 0.769106
B9 W(P)>0.03% 0.0030 0.768257
B10 W(C): 0.10%~
0.16% 0.0080 0.772130
B11 W(S)>0.03% 0.0060 0.004596
B12 W(Mn)/w(S)<15 0.0050 0.003830
To sum up, probability of top event is 23.41 percent and statistic probability of internal cracks from on-site data is 20.83 percent. Then the error is 2.58 percent and the error rate is 12.39 percent, which indicates that the error between calculated amount and statistic amount is small and the results can be adaptive for production. Based on the calculated results, some optimizing control strategies are presented to improve billet quality as the following:
(2) Water flowrates of secondary cooling are strictly controlled with variable casting speed.
(3) From importance of base events, superheat is important for billet quality, so it is also controlled in the normal range.
Ten samples of steel grade 1008 are selected for testing the quality prediction model of the internal cracks of continuous casting billet. The relative parameters of every sample include superheat, casting speed, water flowrate ratio, water flowrate of segment 0, water flowrate of segment 1, water flowrate of segment 2, C content, P content, S content, Mn/S and actual internal cracks grade.
Table.4. Quality Prediction Results Of Steel Grade 1008
Actu al Grad
e
Predicti on Grade
Deviati on
Percenta ge of Accuracy
No.1 0 0.20 0.21
80%
No.2 0 0.78 0.78
No.3 0.5 0.62 0.12
No.4 0.5 0.73 0.23
No.5 1.5 1.46 0.04
No.6 1.0 1.49 0.49
No.7 2.0 2.19 0.19
No.8 2.5 2.42 0.08
No.9 1.0 0.91 0.09
No.1
0 1.5 1.35 0.15
Firstly, the prediction parameter table of surface reheat and the prediction parameter table of solidification speed are obtained by quality analysis model. Secondly, the on-line surface reheat table and the on-line solidification speed table are calculated by solidification heat-transfer model and on-line processing parameters. Lastly, the quality prediction grades are calculated by weighting coefficient table and quality prediction function. Table.4 shows the quality prediction results of steel grade 1008.
The prediction is accurate when the deviation between the actual grade and the prediction grade is less than 0.25. The percentage of accuracy for the quality prediction is 80 percent, which shows that the model is relatively accurate and provides the foundation for industry application.
By studying on the mechanisms of internal cracks formation, the critical stress and strain theory is determined as the base of establishing fault tree of internal cracks. For the first time, FTA method is applied to analyze internal cracks of billet. The
method can visually display all events and calculated results. Quality prediction model of internal cracks in continuous casting billet has been established, based on clustering analysis model of on-site data, FTA model and solidification heat-transfer model. The model is applied by inputting on-site data in some plant. The error of statistic probability and calculated probability of internal cracks quality analysis is 2.58 percent, and the percentage of accuracy for the quality prediction is 80 percent, which shows that the model is relatively accurate.
ACKNOWLEDGEMENT
This work was supported in part by NSFC under Grant Nos. 51004032 and 61273178.
REFERENCES
[1] Bernardin J.D. and I. Mudawar, 2002. The
Leidenfrost Point: experimental study and assessment of existing models. J. ASME, 12(1): 894-903.
[2] Geymayr J.A.B. and N.F.F. Ebecken, 1995.
Fault-tree analysis: a knowledge-engineering approach. IEEE TR, 44(1): 37-45.
[3] Jenab K. and B.S. Dhillon, 2005. Stochastic
fault tree analysis with self-loop basic events.
IEEE TR, 54(1): 173-180.
[4] Jiang D. X., C. Tang and A. D. Zhang, 2004.
Cluster analysis for gene expression data: a survey. IEEE TKDE, 16(11): 1370-1386.
[5] Lanschutzer, J., H. Resch and M. Thalhammer,
2001. Development tools for the caster
engineer. I. S., 28(11): 17-21.
[6] Mok W.Y., Y.T. Jung and S.D. Jin, 2000. New
criterion for internal crack formation in continuously cast steels. MMTB, 31(8): 779-794.
[7] Shi C. X., 1998. Practical Casting Metallurgy
Technology. Metallurgical Industry Press,
Beijing.
[8] Sullivan K.J. and D. Coppit, 2000. Developing
a low-cost high-quality software tool for dynamic fault-tree analysis. IEEE TR, 49(1): 49-59.
[9] Sutanto E. L. and K. Warwick, 1995.
Multivariable cluster analysis for high-speed industrial machinery. IEE P.A, 42(5): 417-123.
[10] Van D. G., J.K. Brimacombe and F. Weinberg,
1975. Internal cracks in strand-cast billets. I.
[11] Wu R. Y., G. H. Wu and Z. Xie, 2005. PSO-based water consumption determination for secondary cooling zone during continuous casting. J. Neu. Ns, 26(12): 1142-1146.
[12] Yamanaka A., K. Nakajima and K. Okamura,
1995. Critical strain for internal crack
formation in continuous casting. I. S., 22(6): 508-512.
[13] Young M.W., N.H. Heung and T.J. Yeo, 2000.