Evaluating the effect of hotel size for utilization of social
media in Sri Lankan hotel industry
S.W.G.K. Bulankulama
1, Ali Khatibi
2, T.S.D.M.Shokri
3 1Doctoral Student, School of Graduate Studies, Management and Science University, Malaysia, Senior Lecturer, Dept. of Social Sciences, Rajarata University of Sri Lanka.
2
Professor, Faculty of business and professional studies, Management and Science University, Malaysia; e-mail: alik@msu.edu.my.
3
Professor, Faculty of business and professional studies, Management and Science University, Malaysia.
Abstract- Most of hotels in Sri Lanka have utilized the social media with the aim of gaining competitive advantage. This study investigates how hoteliers views on utilization of social media as a marketing tool in Sri Lankan hotel industry. It was based on a survey of 331 executive offices in 98 star graded hotels in Sri Lanka that ranged from one-star to five-star. In conclusion the survey has shown that one star hotel is under utilizing the potential of the social media despite the fact that many of them have websites engaging with below 50 rooms. A major finding of this is that large size hotels (more than 50 rooms) have a higher probability of utilization of social media.
Index Terms- utilization of social media, marketing tool, hotel industry in Sri Lanka
I. INTRODUCTION
he Dramatic increase in the use of the internet and its widespread applications has created online media, social media (Jones, 2009; Ghali, 2011). Businesses create the advantage of introducing social media into their marketing programs (Falkow, 2009). Although, the internet is not offers great opportunities for marketers, it brings a new way of conducting and approaching consumer markets (Sterne, 1996; Hoffman & Novak, 1997; Walsh & Godfrey, 2000; Rahman, 2003). Accordingly, many hotels are utilizing social media as essential for their future plans and they have already started designing strategies on how to implement it (Noone et al., 2011). Murphy et., 2001 studies sates that the several hotels have made attempts to capture some of good potential of the internet mostly using as a marketing tool, by creating their websites and are using the internet for various purposes. According to Laudon & Traver, (2002) as a result of internet marketing its develop a positive, long-term relationship with customers in which create a competitive advantage for the hotel by allowing it to charge a higher price for products and services than its competitors can charge.
Social media is the fastest and most accurate way to find customers’ feedback about the hotel (Hamby, 2012). It can also help to understand customers’ view of the hotel and its services, what services they are satisfied with and what problems they have in which need the resource base view (RBV) of the hotel.
Sri Lankan hotel industry
The Sri Lankan hotel industry primarily consists of tourist hotels and other establishments such as guest houses, inns
(SLTDA). The tourism is the one of leading sector in Sri Lanka in which hotel industry contributed around two per cent to the gross domestic product (GDP) in 2014 (Central Bank of Sri Lanka, 2014). 55 percent of hotel industry is unclassified in terms of grading, as they do not meet the specific grading criteria set out by the SLTDA in fact; their ranks include some luxury establishments. Meanwhile, most of the hotels are relatively with one or two star grading, mid-range establishments accounted for less than 18 percent of the capacity of hotel industry while supplementary establishments contributed another 29 percent (http://archives.dailynews.lk/2011/05/05/bus25.asp).
Objectives of the study
The purpose of the study is to find out; utilization of social media in Sri Lankan hotel industry and differentiate it from the size of the hotel. In order to provide a basis of the relationship between competitive advantages and utilization of social media of Sri Lankan hotel industry.
II. RESEARCH METHODOLOGY
This study used analytical methods to investigate hoteliers’ view of social media as a marketing tool. The sampling frame included Sri Lanka Tourism Development Authority, 2014 registered all star graded hotels (98) in Sri Lanka which ranged from one-star to five-star. The selected these hotels were all have covered important tourism destinations and adoption of social media is easy in large scal rather than the small and medium scal (Rogers, 1995).
media utilization and competitive advantage. Data analysis was performed using SPSS 16 statistical software. The current study was conducted to determine whether hotel size and grade influence the utilization of social media.
Problem statement
All the positive signs in the tourism sector of the Sri Lankan economy have a direct positive impact on the hotel sub-sector. Hoteliers need to market their facilities improving their advantage through the online marketing. The internet is a major platform for enhancing business processes especially marketing activities in which social media can employ as a marketing tool. In Egypt, Syria and Lebanon, which are major tourism destinations in the Arab region, the internet is used mainly as a marketing tool in hotel industry (El Said & Hone, 2005). Further, social media successfully utilize by the Gana (Ogbeh and koku, 2009) USA and UK (Nassar, 2012) is also as a marketing strategy.
As competition becomes vicious in the hotel industry in Sri Lanka are taking the social media to facilitate their businesses. Currently, there is escalating demand for hotels that meet
international standards especially in the emerging markets. In view of the above, the main problem of this study is, Sri Lankan hotels can improve competitive advantage of the opportunities the social media offers to market their facilities and services? For the above problem, the main purpose of the study is to find out what way social media marketing strategies are being pursued by hotels in Sri Lanka.
III. RESULT AND DISCUSSION
Characteristics of Sri Lankan hotel industry
The first part of the questionnaire includes the hotel category, hotel size and educational level of hotel management. Absorbing these characteristics of hotel industry, which was utilized the social media for creating the competitive advantages improving their customer satisfaction and organizational performance. In order to that examine, the association between utilization of social media and competitive advantages in hotel industry because social media can be used to enhance the resources and capabilities of the firm (Perveje, 2011).
Table1: Correlations
MeanUSM MeanCA
MeanUSM Pearson Correlation 1 .752**
Sig. (2-tailed) .000
N 331 331
MeanCA Pearson Correlation .752** 1 Sig. (2-tailed) .000
N 331 331
**. Correlation is significant at the 0.01 level (2-tailed).
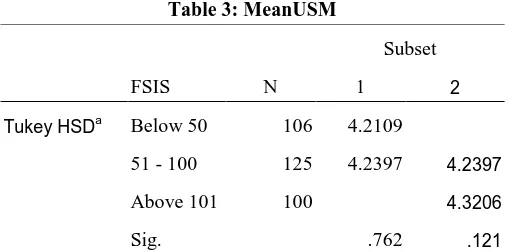
Vale of Pearson correlation is 0.752 between utilization of social media and competitive advantages as a result which reflect the strong positive association between the variables (Chinna, Karuthan and Yuen, 2012). According to the test for Homogeneous in table 2 and 3, there is no difference in
[image:2.612.247.502.528.654.2]utilization of social media in star graded all the means USM are in one subset. But, there is a difference in utilization of social media in hotel size in which mean USM is in the two subset (Table 3).
Table 2: MeanUSM
Star grade N
Subset
1
Tukey HSDa 1 Star 66 4.2081 2 Star 90 4.2431
3 Star 46 4.2451
4 Star 77 4.2562
5 Star 52 4.3415
Sig. .107
Level of Education in hotel industry
The level of education was categories as Degree, Diploma, O/L, A/L and Other. The levels of education provided in this study are in accordance to tertiary education provisions in Sri Lanka.
Table 3: MeanUSM
FSIS N
Subset
1 2
Tukey HSDa Below 50 106 4.2109
51 - 100 125 4.2397 4.2397
Above 101 100 4.3206
Sig. .762 .121
Means for groups in homogeneous subsets are displayed.
Based on observed means.
The error term is Mean Square(Error) = .092.
Table 4: Respondents Educational Level
N Percent
MeanUSM Degree 141 42.59 %
Diploma 34 10.3 %
O/L,A/L 100 30.2 %
Other Total
56 331
16.9 % 100 % Source: field data, 2014
The educational level of hotel management indicates that most of the executive officers had degree representing 42.5 %, 10.0 % had diploma while 30 % with qualification of secondary education (O/L, A/L) and 16.9 % of the hotel managers had qualified with hotel school training. In order to that most of the managers of hotel industry who, are qualified with a degree which evidence from the study of Ogbeh and Koku, 2011.
Hotel grades
[image:3.612.142.455.302.439.2]Hotels were categories base on their star ratings which are depending on the guidelines of Sri Lanka Tourist Development Authority (SLTDA).
Table 5: Hotel Category
Star grade
Responses SLTDA register
MeanUSM Total
N Percent N Percent
1 Star 66 19.9 % 21 21.4 %
2 Star 90 27.2 % 27 27.5 %
3 Star 46 13.9 % 14 14.2 %
4 Star 77 23.3 % 22 22.4 %
5 Star 52 15.7 % 14 14.2 %
Total 331 98
Source: field data 2011
Most of the execurtive grade officers (27.2 % and 23.3 %) were from 2 star and 4 star hotels respectively. 19.9 % of the officers were from 1 star hotel and 15.7% of the respondents were from 5 star hotels. Contribution from the 2 star hotels in the star category is high in Sri Lankan hotel industry which is same in Ganian hotel industry (N = 30) to which proved the evidence from Ogbeh and Koku, 2011.
Hotel Size
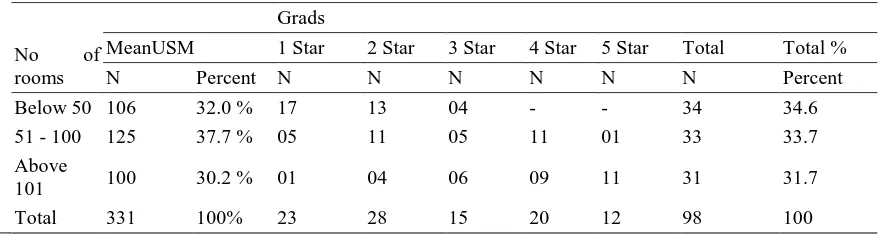
Hotels size was classified as; below 50 rooms, 51 to 100 rooms and above 101 rooms based on the previous literature (Ogbeh and Koku, 2011; Nassar, 2012). It presents the representing number of the utilization of social media with the grade and size of hotels. The distributions of the size of hotels are shown in table 7.
Table 6: Hotel grads and Hotel Size
No of rooms
Grads
MeanUSM 1 Star 2 Star 3 Star 4 Star 5 Star Total Total %
N Percent N N N N N N Percent
Below 50 106 32.0 % 17 13 04 - - 34 34.6
51 - 100 125 37.7 % 05 11 05 11 01 33 33.7
Above
101 100 30.2 % 01 04 06 09 11 31 31.7
Total 331 100% 23 28 15 20 12 98 100
[image:3.612.88.528.574.691.2]Of the three broad categories described within the study there seems to be an equal representation. 37.7 % of the executive officers were from hotels with rooms from 51 -100,
[image:4.612.272.499.140.241.2]hotel rooms from below 50 and above 101 were both 32.18% result as it is from the studies Ogbeh and Koku, 2011; Nassar, 2012.
Table 7: Descriptive Statistics
Dependent Variable:MeanUSM
Star
grade Mean Std. Deviation N
1 Star 4.2081 .25414 66
2 Star 4.2431 .28034 90 3 Star 4.2451 .30607 46
4 Star 4.2562 .33079 77
5 Star 4.3415 .35808 52
Total 4.2549 .30558 331 Source: field data, 2014
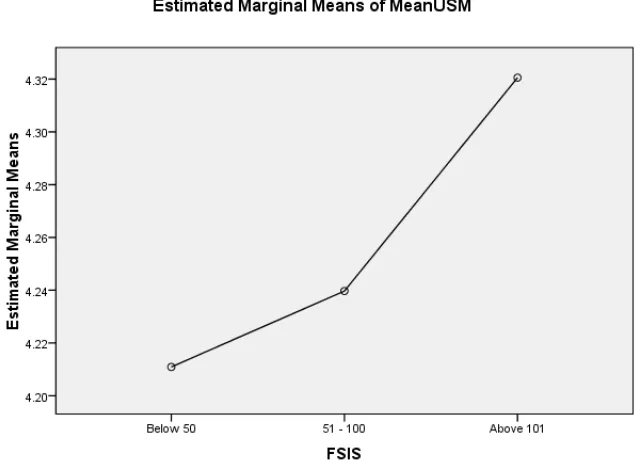
Comparatively, social media usage in one star hotel is low which is engaging with below 50 rooms, while the usage of social media was common for three-star, two- star and four-star hotels. The highest utilization of social media was recorded from
five-star hotels, irrespective of hotel size which is proved evidence by the study Nassar, 2012. In order to that there is a difference on utilization of social media by the firm size.
Source: Elaboration of author
Most of one and two star hotels in Sri Lanka with below 50 rooms while 24 % of 2 star hotels are below in 100 rooms. Three, four and five star hotels engaged with more than 50 rooms in which all the five star hotels’ size is above 101 rooms.
Therefore, social media usage is familiar for the large hotel in Sri Lanka. This is state from the study of hotel industry in UK, USA and Egypt (Nassar, 2010 ).
[image:4.612.150.470.344.579.2]Graph 1:
Table 8: Descriptive Statistics
Dependent Variable:MeanUSM
FSIS Mean Std. Deviation N
Below 50 4.2109 .24758 106
51 - 100 4.2397 .30984 125
Above 101 4.3206 .34538 100
Total 4.2549 .30558 331
Table 9: Tests of Between-Subjects Effects
Dependent Variable:MeanUSM
Source
Type III Sum of
Squares df Mean Square F Sig.
Corrected Model .665a 2 .333 3.619 .028
Intercept 5945.255 1 5945.255 6.468E4 .000
FSIS .665 2 .333 3.619 .028
Error 30.149 328 .092
Total 6023.289 331
Corrected Total 30.815 330
a. R Squared = .022 (Adjusted R Squared = .016)
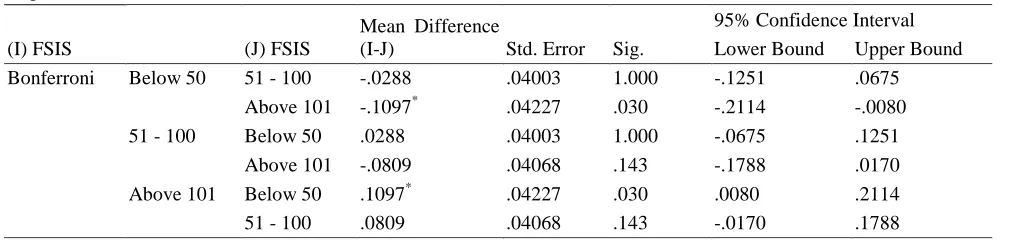
Based on the Bonferroni pair wise comparisons and the plot, the mean utilization of social media among the firm size; above room 101 high compared the mean utilization of social media among the below 50 rooms. In order to that p- value of the Levenes’ test for equality of variance is 0.0.01 which is less than
[image:5.612.57.565.335.457.2]the 0.05 in which equality of variance cannot be assumed (Chinna, Karuthan and Yuen, 2012). Then there is a difference in mean utilization of social media between number of rooms in below 50 and above 101.
Table 10: Multiple Comparisons
Dependent Variable:MeanUSM
(J) FSIS
Mean Difference
(I-J) Std. Error Sig.
95% Confidence Interval
(I) FSIS Lower Bound Upper Bound
Bonferroni Below 50 51 - 100 -.0288 .04003 1.000 -.1251 .0675
Above 101 -.1097* .04227 .030 -.2114 -.0080
51 - 100 Below 50 .0288 .04003 1.000 -.0675 .1251
Above 101 -.0809 .04068 .143 -.1788 .0170
Above 101 Below 50 .1097* .04227 .030 .0080 .2114
51 - 100 .0809 .04068 .143 -.0170 .1788
Based on observed means.
The error term is Mean Square(Error) = .092.
*. The mean difference is significant at the .05 level.
IV. CONCLUSION
Social media is a good way to establish a relationship between hotels and their customers, it allows for one-to-one communication between them. Hotels can also receive regular feedback from their customers on their customer service, marketing campaigns. Therefore, hotels have a better chance of attracting customers by using social media. Social media is greatly utilized as a marketing strategy in all star graded hotels in Sri Lanka as a result, there is no difference in usage of social media. Although one-star hotels below with 50 rooms use social media for the marketing intelligence is limited. This may suggest the existence of a number of obstacles that make utilization of social media in their businesses, including, limited understanding of the potential of technology, costs of technology adoption, such as training, external expertise and upgrading software, or a lack of clear business strategies. Such conclusions match up with a number of studies such as: Buhalis (1996, 2003, 2005), Hull and Milne (2001) and AL- Allak, (2010). However, the pattern of
Exposure to the IT knowledge, access to the internet for social media marketing, top management commitment and the Internet and IT usage infrastructure with adoption cost of capital could be the main reasons for the disparity in social media usage. From the this study is evident that hotels with star grades in which two- star, three-star, four-star, and five-star with larger room capacities (more than 50 rooms) have a higher probability of using social media.
REFERENCES
[1] AL-allak B. 2010, “Evaluating the Adoption and Use of Internet-based Marketing Information Systems to Improve Marketing Intelligence (The Case of Tourism SMEs in Jordan)”, International Journal of Marketing Studies, Vol.2, No.2; November 2010, Canadian Center of Science and Education, www.ccsenet.org/ijms
[2] Annual report, (2014), Central Bank of Sri Lanka, Colombo, Sri Lanka [3] Arlt, W. (2005), A virtual Huanying, Selamat Datang and Herzlich
[4] Buhalis, D. (1996). Enhancing the Competitiveness of Small and Medium Sized Tourism Enterprises at the Destination Level by Using Information Technology. Electronic Markets, Vol., No 1.
[5] Buhalis, D. (2003). E-Tourism: Information Technology for Strategic Tourism Management. London: Financial Times / Prentice-Hall.
[6] Buhalis, D and O'Conner, P. (2005), Information Communication Technology Revolutionizing Tourism. Tourism Recreation Research, Vol. 30, No 3.
[7] Baloglu, S., and Peckan, Y. (2006), The Web Design and Internet Site Marketing Practices of Upscale and Luxury Hotels in Turkey, Journal of Tourism Management, Vol.27, No 1
[8] Chinna, K., Karuthan, K. and Yuen, C.W.(2012), Statistical analysis using SPSS, Pearson Asia Pacific Office, Malaysia.
[9] Costas, et al. (2005), An Evaluation of the Performance of Hotel Websites Using the Managers’ Views About Online Information Services. Working
Paper [Online] Available:
http://csrc.lse.ac.uk/asp/aspecis/20050010.pdf.retrieved23/10/07
[10] El Said, G, and Hone, K. (2005). Culture and E-commerce: An exploration of the Perceptions and Attitudes of Egyptian Internet Users. Journal of Computing and Information Technology, Vol 13, No 2.
[11] Falkow, S. (2009), Social media strategy, E+ White paper, September 2009. [12] Ghali, P. (2011), Calculating your social media marketing return on investment – A how to guide for new social media marketers. Retrieved from
http://www.icontact.com/static/pdf/Calculating_Social_Media_ROI.pdf [13] Hamby, S. 2012. Five Reasons to Use Social Media Analysis.
http://www.huffingtonpost.com/steve-hamby/social-media-analysis_b_1344666.html Accessed on 10 December 2012
[14] Hoffman, D. L., & Novak, T. P., (1997), “A new marketing paradigm for electronic Commerce”, The Information Society, special issue on electronic commerce, 13 (Jan.-Mar.), 43-54
[15] Hull, J and Milne, S. (2001). From Nets to the "Net": Marketing Tourism on Quebec's Lower North Shore. In: Baerenholdt. N.E. an Aarsaether J.O (Eds.) Coping Strategies in the North (pp 89-93). Copenhagen: Nordic Council of Ministers, 89-93.
[16] Jones, R. (2009), Social media marketing 101, Part 1. Retrieved from http://searchenginewatch.com/3632809, (July 23, 2013).
[17] Laudon, K. C., & Traver, C. G., (2002), “E-commerce: business, technology”, society. Addison Wesley: Boston.
[18] Murphy, J., Hofacker, C., & Bennett, M. (2001), “Website-generated market research data. Tracing the tracks left behind by visitors”, Cornell Hotel & Restaurant Administration Quarterly, 42(1), pp. 82-91.
[19] Nassar M. A. (2012), “An Investigation of Hoteliers' Attitudes toward the Use of Social Media as a Branding Tool”, International Journal of Marketing Studies; Vol. 4, No. 4; 2012, ISSN 719X E-ISSN 1918-7203, Canadian Center of Science and Education
[20] Noone, B. M., McGuireb, K. A., & Rohlfs, K. V. (2011), Social media meets hotel revenue management: Opportunities, issues and unanswered questions, Journal of Revenue and Pricing Management, 10, 293–305.
[21] Ogbeh, C.K. and Koku, P.D.(2011), Investigating marketing strategies among hotels, International Masters Programme, Lulea University of Technology - Sweden and University College of Education, Kumasi Campus.
[22] Peveje, A. (2011), Resource based view of social media as a source of sustain competitive advantage, Thesis of Master of science in engineering and management , Massachusetts institute of technology, Karnatak University.
[23] Rahman, Z., (2003), Internet-based supply chain management: using the Internet to revolutionize your business, International Journal of Information Management, 23,493-505
[24] Rogers, E. M. (1995), Diffusion of innovations, New York: The Free Press. [25] Rohm, A., Kashyap, V., Brashear, T., Milne, G. (2004), “The Use of Online
Marketplaces for
[26] Competitive Advantage: A Latin American Perspective”, Journal of Business and Industrial Management, 19(6), pp. 372-385.
[27] Sterne, Jim, (1996), “Customer Service on the Internet: Building Relationships, Increasing Loyalty, and Staying Competitive”, 2nd Ed., New York: John Wiley and Sons
[28] Thomas, R., Chrch, I., Eaglen, A., Jameson, S., Lincoln, G., & Parsons, D., (1997), The National Survey of Small Tourism and Hospitality Firms. Annual Report 1996-97, Center for the Study of Small Tourism and Hospitality Firms, Metropolitan University. The UK.
[29] Walsh, J. & Godfrey, S. (2000), “The Internet: a new era in customer service”, European Management Journal, 18 (1), pp. 85-92.
[30] Wood, E. (2001). Marketing Information Systems in Tourism and Hospitality Small-and medium-sized enterprises. International Journal of Tourism Research, 4(3), 283-299.
[31] http://archives.dailynews.lk/2011/05/05/bus25.asp
AUTHORS
First Author – S.W.G.K. Bulankulama, Doctoral Student,
School of Graduate Studies, Management and Science
University, Malaysia, Senior Lecturer, Dept. of Social Sciences, Rajarata University of Sri Lanka.
e-mail: swgkbulankulama@yahoo.com
Second Author – Ali Khatibi, Professor, Faculty of business and
professional studies, Management and Science University, Malaysia; e-mail: alik@msu.edu.my.
Third Author – T.S.D.M.Shokri, Professor, Faculty of business