Copyright © 2017, Scholarly Research Journal for Interdisciplinary Studies
CONSTRUCTION AND DEVELOPMENT OF COMPUTER ATTITUDE SCALE
(CAS)
Jasmeet Bedi
Asstt. Prof., BCM College of Education, e-mail: [email protected]
As we know Computers have been used in education for more than four decades, and they have now been accepted unconditionally as an integral part of our entire educational system. The increase in computer use is rapid and has also generated new challenges. Teacher attitude towards computers is an important factor related to the teacher’s role towards the effective use of computers in education. Indeed, previous correlation studies have long forecasted that the use of computers in education would very much depend on how well teachers integrate them in everyday activities. And therefore, the question of teacher attitude toward computers is central to any successful use of computers in education. The present paper deals with the construction and development of computer attitude scale for teachers. The sample has been drawn from secondary school teachers of public schools of Ludhiana district of Punjab.
Keywords: attitude, computer attitude, secondary school teachers
Introduction
The present scale (CAS) has been developed with an objective of assessing teacher‟s attitude towards the use of computer in teaching. The investigator had gone through different scales before constructing and developing the scale. Computer Attitude Scale by B. Yushau(2006) for assessing teachers' attitudes toward computers, Computer Attitude Scaleby R.C. Kluever (1992)and (1994) for students, Computer Attitude Scalefor language teachersby N.M. Daud(1995 ), Computer Attitude Scale (CAS) by Loyd and Gressard (1984), Computer Attitude Scale for Teachers (CAST) by Yuen and Ma (2001); observed that majority of scales were developed for students and in foreign conditions. So there is a need for developing a scale which is applicable in Indian conditions. The tool would help to assess the attitude of teachers towards the use of computer. Moreover with the changing times, the situations also change. The tool in use needs to be revised or developed accordingly.
Attitude: attitude is the way you think and feel about someone or something, a feeling or way of thinking that affects a person's behavior, a way of thinking and behaving that people regard as unfriendly, rude, etc. It is the degree of positive or negative affect associated with some psychological objects. By a psychological object, he means any institution, ideal,
Copyright © 2017, Scholarly Research Journal for Interdisciplinary Studies
symbol, phrase, slogan, job or idea towards which people can differ with respect to positive or negative affect.
Computer attitude:
Computer attitude is the predisposition of a person to respond positively or negatively towards computers. It affects everything the person does with the computer and in fact reflects what experience the user has and hence determining factor of the user‟s behavior towards computers. It refers to individual‟s level of ICT use preference and their perceptions about using ICT.
According to Business Dictionary:A predisposition or a tendency to respond positively or negatively towards a certain idea, object, person, or situation. Attitude influences an individual‟s choice of action, and responses to challenges, incentives, and rewards (together called stimuli).
Purpose of the scale
This scale was developed to assess the attitude of teacher towards use of computers in teaching.
Target population
This scale is for senior secondary school teachers of public schools (females).The statements are also relevant for secondary, primary and middle school teachers as well as male teachers.
Steps of development of tool
The present tool has been constructed and developed by keeping in mind “Likert Attitude Scale”.
The following steps were involved in the construction and development of present scale.
1. Selection of content and items for preliminary draft: on the basis of review of previous tools, 50 statements were framed by investigator. These statements express an
opinion or a feeling towards the use of computer. The numbers of favourable and unfavourable items were approximately equal. After the statements have been gathered, these were discussed with experts in that field. The experts were told that they can freely add or delete any item from the scale which they consider relevant or irrelevant respectively. The judges gave their valuable opinion. On the basis of expert opinion some statements were edited. Following points were kept in mind while framing the items for the scale:
Copyright © 2017, Scholarly Research Journal for Interdisciplinary Studies
The language was kept simple so that it is easily understood and interpreted by the respondent.
Contradictory statements were avoided.
Number of items prepared was much more than to be retained in the final scale. 2. Type of items: present scale is a five point Likert scale. Every item, in thescaleis
followed by five alternatives, one of which is checked by the subject. The responses
indicating, degree of strength of attitude are:
Strongly Agree (SA)
Agree (A)
Undecided (UD)
Disagree nd(DA)
Strongly Disagree (SD)
3. The try out: the preliminary draft of the scale consists of 50 statements and is administered to a sample of 63 senior secondary school female teachers of public schools of urban area of Ludhiana district of Punjab.
Table 1 List of schools and number of teachers selected for tryout of the tool
S. No. Name of the school No. of teachers
1 Children Valley Senior Secondary School,G.T.B. Nagar Chandigarh Road,Ludhiana.
28
2 New S.D. Model Senior Secondary School,Bahadur K. Road, Ludhiana.
22
3 S.D. Model Senior Secondary School,Ludhiana. 13
Total 63
Copyright © 2017, Scholarly Research Journal for Interdisciplinary Studies
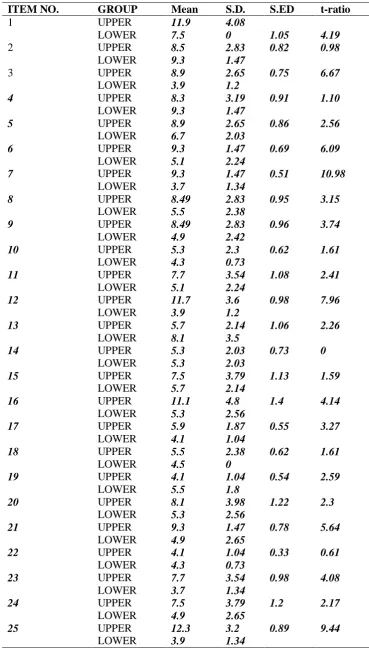
Table 2 Showing item wise analysis of the scale (N=15)
ITEM NO. GROUP Mean S.D. S.ED t-ratio
1 UPPER 11.9 4.08
1.05 4.19
LOWER 7.5 0
2 UPPER 8.5 2.83 0.82 0.98
LOWER 9.3 1.47
3 UPPER 8.9 2.65 0.75 6.67
LOWER 3.9 1.2
4 UPPER 8.3 3.19 0.91 1.10
LOWER 9.3 1.47
5 UPPER 8.9 2.65 0.86 2.56
LOWER 6.7 2.03
6 UPPER 9.3 1.47 0.69 6.09
LOWER 5.1 2.24
7 UPPER 9.3 1.47 0.51 10.98
LOWER 3.7 1.34
8 UPPER 8.49 2.83 0.95 3.15
LOWER 5.5 2.38
9 UPPER 8.49 2.83 0.96 3.74
LOWER 4.9 2.42
10 UPPER 5.3 2.3 0.62 1.61
LOWER 4.3 0.73
11 UPPER 7.7 3.54 1.08 2.41
LOWER 5.1 2.24
12 UPPER 11.7 3.6 0.98 7.96
LOWER 3.9 1.2
13 UPPER 5.7 2.14 1.06 2.26
LOWER 8.1 3.5
14 UPPER 5.3 2.03 0.73 0
LOWER 5.3 2.03
15 UPPER 7.5 3.79 1.13 1.59
LOWER 5.7 2.14
16 UPPER 11.1 4.8 1.4 4.14
LOWER 5.3 2.56
17 UPPER 5.9 1.87 0.55 3.27
LOWER 4.1 1.04
18 UPPER 5.5 2.38 0.62 1.61
LOWER 4.5 0
19 UPPER 4.1 1.04 0.54 2.59
LOWER 5.5 1.8
20 UPPER 8.1 3.98 1.22 2.3
LOWER 5.3 2.56
21 UPPER 9.3 1.47 0.78 5.64
LOWER 4.9 2.65
22 UPPER 4.1 1.04 0.33 0.61
LOWER 4.3 0.73
23 UPPER 7.7 3.54 0.98 4.08
LOWER 3.7 1.34
24 UPPER 7.5 3.79 1.2 2.17
LOWER 4.9 2.65
25 UPPER 12.3 3.2 0.89 9.44
Copyright © 2017, Scholarly Research Journal for Interdisciplinary Studies
26 UPPER 12.7 3.0 0.82 10.49
LOWER 4.1 1.04
27 UPPER 5.3 2.03 0.84 0
LOWER 5.3 2.56
28 UPPER 3.9 1.34 0.62 2.26
LOWER 5.3 2.03
29 UPPER 6.7 2.32 0.86 1.4
LOWER 5.5 2.38
30 UPPER 11.1 4.8 1.38 3.19
LOWER 6.7 2.32
31 UPPER 5.5 1.8 0.58 2.76
LOWER 3.9 1.34
32 UPPER 3.7 1.34 1.04 3.65
LOWER 7.5 3.79
33 UPPER 5.3 2.3 0.89 0.67
LOWER 4.7 2.56
34 UPPER 8.1 3.5 0.96 4.38
LOWER 3.9 1.2
35 UPPER 8.5 2.83 1.35 1.19
LOWER 6.9 4.41
36 UPPER 5.9 1.5 0.77 0.78
LOWER 5.3 2.56
37 UPPER 8.1 3.5 0.96 4.38
LOWER 3.9 1.2
38 UPPER 8.5 2.83 0.96 2.29
LOWER 6.3 2.4
39 UPPER 9.3 2.94 0.84 6.67
LOWER 3.7 1.34
40 UPPER 7.5 0 0.54 3.7
LOWER 5.5 2.1
41 UPPER 5.3 2.3 0.79 0
LOWER 5.3 2.03
42 UPPER 8..1 3.5 1.1 2.91
LOWER 4.9 2.42
43 UPPER 4.1 1.04 0.62 2.58
LOWER 5.7 2.14
44 UPPER 4.1 1.04 0.53 2.64
LOWER 5.5 1.8
45 UPPER 4.1 1.04 0.38 0
LOWER 4.1 1.04
46 UPPER 6.7 2.04 0.71 1.41
LOWER 5.7 1.82
47 UPPER 5.3 2.03 0.63 2.54
LOWER 3.7 1.34
48 UPPER 5.7 2.14 0.77 0.52
LOWER 5.3 2.03
49 UPPER 7.5 0 0.56 3.21
LOWER 5.7 2.14
50 UPPER 8.5 2.83 0.91 3.3
Copyright © 2017, Scholarly Research Journal for Interdisciplinary Studies
After statistical treatment and computing difficulty value of items, they are arranged according to their‟-values. Items having„t‟-values ≥1.75 is selected and rest has been discarded. Hence 34 items have been selected and 16were deleted from the scale.
Selected items:
1,3,5,6,7,8,9,11,12,13,16,17,19,20,21,23,24,25,26,28,30,31,32,34,37,38,39,40,42,43,44,47,49 ,50.
Reliability: reliability refers to the degree to which a measuring tool gives consistent results. It is the consistency with which a test score measures what it tends to measure. For determining the reliability of a tool the investigator used “split-half method”. Whole test is
split into two equal halves or in even and odd items by keeping in view of above said method so that two test be equal in respect of difficulty value. After that co-efficient of correlation between two tests is calculated by “Product Moment method of correlation”. This comes out
to be 0.76. The reliability of a test is calculated by Spearman Brown prophecy formula (2r/1+r) which come out to be 0.86
Validity: validitymeans truthfulness of the tool. It refers to the degree to which a test is prepared for. Content validity involves the adequacy of items. The scale furnished by researcher represents well defined content. The content of the scale was developed keeping in view various standardized tests and scales. The tool was given to the two experts for content validity. The face validity was established by modifying the items of the scale according to the suggestions of the experts. The validity of a present scale have also been determined from
reliability coefficient, by taking the under root of reliability coefficient that comes out to be 0.93.
Administration of the scale
Present scale is a five point scale. Before administering the scale rapport was established with
the subjects and told them about the purpose of the scale and then instructions were given which are also mentioned on the cover page of the scale. The scale can be administered to an individual as well as on group. The respondent is required to tick only one response which is most truthful and spontaneous. There is no right or wrong response. It is only respondents‟
actual behavior. There is no time limit yet it takes about 15-20 minutes to complete the scale. Scoring
Copyright © 2017, Scholarly Research Journal for Interdisciplinary Studies
“Strongly Disagree” for positive items and 1 to 5 for negative items. The range of scores is 34
to170. Scores more than 90 indicates favorable attitude, 71-89 neutral and scores less than 70 indicates unfavourable attitude towards computer.
Positive items: 1,2,4.6,7,8,9,10,15,18,20,21,22,23,24,26,28,29,30,31,36,37,38,39,40,41 and 49.
Negative items: 3,5,11,12,13,14,19,25,27,32,33,34,35,42,43,44,45,46,47,48 and 50. References
B. Yushau (2006).Computer Attitude Scale,EurasiaJournal of Mathematics, Science ejmste.com/032006/d1.pdf,
Daud,N.M. (1995 ). Computer Attitude Scalefor Language
Teachers.jec.sagepub.com/content/7/2/165.short.
Koul,Lokesh(2009).Methodology of educational research.4th edition, Vikas Publishing House
Pvt. Ltd.,256-257.
Kluever,R.C.(1994).Computer Attitude Scale.jec.sagepub.com/content/7/2/165.short.
Loyd&Gressard (1984).Computer Attitude Scale for
Teachers.eric.ed.gov/?id=ED348963,
Yuen&Ma(2001).ComputerAttitudeScaleforTeachershttp://www.igiglobal.com/dictionary/
Computer-attitude/5025