International Journal of Emerging Technology and Advanced Engineering
Website: www.ijetae.com (ISSN 2250-2459, ISO 9001:2008 Certified Journal, Volume 6, Issue 2, February 2016)
236
Alternative Refrigerant for Freon 22 in Vapour Compression
Refrigeration System
A. Manoj
1, Prof. D.Veerappan
21
B.E Mechanical Engineering, Salem, Tamilnadu, India
2Research Scholar, Department of Mechanical Engineering, Karpagam University, Coimbatore, Tamilnadu, India Abstract-This paper describes the alternative refrigerant
for freon 22 in vapour compression refrigeration system. The main aim is to find an alternative blended refrigerant to replace freon 22 for ozone friendly and elimination of global
warming components such as HFC’s, Halocarbons, N2O and
temperature rise due to F-gases which are the major defect of freon 22. Mixture of ammonia and hydrocarbons are taken as a blended refrigerant to replace Freon 22 due to the excellent properties. This blended refrigerant is chlorine free to reduce the global warming potential and ozone depletion potential. In this analysis Freon 22 properties are completely studied and different mixtures of blended refrigerants are analyzed and the suitable refrigerant is selected as an alternative for freon 22. Then the various properties of the selected refrigerant are calculated using REFPROP 9.0 and compared with Freon 22 and the results are tabulated. The selected refrigerant have good performance characteristics compared to R22 based on the results obtained and can be used to replace the R 22 in vapour compression refrigeration system in future.
Keywords-- Azeotropic blend, refrigerant, REFPROP,
global warming potential, ozone depletion potential.
I. INTRODUCTION
The problem could not be simpler cooling is the largest single demand on electrical consumption in the world and the synthetic refrigerants that are utilized by most cooling appliances add significantly to climatic change and ozone depletion. Global energy demand is projected to increase by more than 25% in the period to 2015. Building services will account for around 45% of this figure. This scenario is wholly unsustainable even without any increase in HFC use. HFC control matters because of the very limited margin left before global warming becomes unstoppable due to positive feedback from the Earth‟s control mechanisms. Human induced climate change above 2°C would take us into this danger zone, but historic emissions already commit us to about 1.3°C. Up to 0.25°C temperature rise could be due to F-gases by the second half 21st Century, i.e. 36% of the remaining available global warming could be used up by HFC most HCFCs can be replaced by natural refrigerants, with the possible exception of the higher pressure HCFC, R22.
There is commercial potential for a natural R22 substitute but there is no single component direct natural substitute for R22. R170- ethane and R717- ammonia, R290- propane and R1234yf 2, 3, 3, 3-Tetrafluoropropene, both have potential, but their higher pressure and lower critical temperature limit their suitability as R22 substitutes, particularly in refrigeration application. In this long term strategy, the above mentioned refrigerants are considered. But all have advantage and disadvantages that should be considered by governments, equipment potentials, and equipment manufactures and equipment users. For instance, ammonia is more toxic than the other refrigerants and HFCs like propane and ethane are flammable to a certain extent. Energy efficiency remains an important issue for all refrigeration technologies, and should be considered along with the factors, since its directly related to global warming. Next to ozone depletion, global warming is the main issue governing the selection of refrigerant chemicals. Although this issue is not covered by the Montreal Protocol, it nevertheless forms important criteria in the ongoing “environmental acceptability” discussion. We must take into account life cycle costs and related investment aspects.
1.1. Montreal Protocol:
In 1987 Montreal protocol established the requirements that began the world – wide phase out of CFCs.
Production of CFCs was phased out by the Montreal Protocol in developed countries in 1st of January, 1996. Production in developing countries was phased out in 2010. In 1992 Montreal protocol established the requirements that began the world – wide phase out of HCFCs. Complete production of HCFCs will be phased out by Montreal protocol in 2030.
1.2. Refrigeration System:
Refrigeration cycle consists of four major components:
International Journal of Emerging Technology and Advanced Engineering
Website: www.ijetae.com (ISSN 2250-2459, ISO 9001:2008 Certified Journal, Volume 6, Issue 2, February 2016)
237
[image:2.612.324.566.157.612.2]Each of these four components comes in numerous shapes and sizes dependent on their application, but again, however big, small or complex, they essentially do the same thing. The COMPRESSOR is the heart of the refrigeration cycle. It compresses refrigerant vapour and creates high pressure within the system which drives the refrigerant around the cycle. The CONDENSER removes heat from the refrigerant vapour, condensing it into a liquid. If you can picture an air conditioner, the condenser is the part of the system that you would usually find outside – a square box with a fan inside. The METERING DEVICE is also commonly known as an expansion valve. It is basically a „restriction‟ in the system that controls the flow of high pressure condensed liquid refrigerant into the evaporator where it vapourises into a low pressure vapour. If you picture an aerosol can, let‟s say an air freshener. Inside the can is high pressure liquid. When you press the nozzle down the high pressure liquid flows through the pin hole in the nozzle into the low pressure atmosphere where it vapourises and makes you room smell fresh.
Fig 1. Refrigeration cycle
The nozzle in this case is the metering device. The EVAPORATOR is the opposite of the condenser. It absorbs heat from the atmosphere, changing the state of the refrigerant from a liquid to a vapour. It is the part of the system that you would usually find inside. In the case of an air conditioner, the evaporator is the unit in the ceiling or on the wall that blows cold air on you.
Working of the refrigeration cycle in a clockwise direction starting at the Compressor, we can see:
1. The refrigerant leaves the compressor as a high pressure vapour.
2. This high pressure vapour then enters the condenser where a fan blows ambient air (which could be quite hot on a hot day but is still cooler than the refrigerant) over the coils of the condenser, cooling the refrigerant inside and condensing it in to a high pressure liquid. 3. The high pressure liquid then flows through the
metering device (expansion valve) where it expands in the low pressure environment and enters the evaporator.
4. Inside the evaporator a fan blows ambient air (which could be very cold but is still hotter than the refrigerant) over the coils of the evaporator, where this ambient air is cooled as its heat is absorbed by the low pressure refrigerant changing state from a liquid to a vapour (boiling off).
5. As the low pressure refrigerant vapour emerges from the evaporator it then enters the compressor and the cycle begins again.
Fig 2. P-V diagram
1.3. Refrigerant:
[image:2.612.53.283.367.573.2]International Journal of Emerging Technology and Advanced Engineering
Website: www.ijetae.com (ISSN 2250-2459, ISO 9001:2008 Certified Journal, Volume 6, Issue 2, February 2016)
238
A more complete definition of a refrigerant could be given as follows: “Refrigerant is the fluid used for heat transfer in a refrigerating system that absorbs heat during evaporation from the region of low temperature and pressure, and releases heat during condensation at a region of higher temperature and pressure.”
II. OBJECTIVES
The main objective of this project are mentioned below
Refrigerant selection criteria based on thermodynamic, thermo physical, environmental and economic properties.
Distillation of refrigerants to form azeotrope blends.
Performances analysis of the blends.
Compare different refrigerant blends and suggest replacements for R22.
III. REFRIGERANT SELECTION
A. Refrigerant Selection Criteria Based On Thermodynamic, Thermo Physical, Environmental and Economic Properties
FREON 22 is the most common refrigerant used in all commercial refrigeration system but as it has high global warming potential and ozone depletion potential it‟s very hazardous to the environment. Hence to avoid this blend that satisfies the property of R22 is formed to serve the basic needs of refrigeration system. Thus the following refrigerants are selected.
3.1. Ammonia (R717):
Ammonia is the most important of the natural refrigerants because of its longstanding and widespread use in food and beverage processing and preservation, and because of its growing adoption in HVAC chillers, thermal storage systems, process cooling and air conditioning, district cooling systems, supermarkets, and convenience stores. Since the middle of the nineteenth century can cause unwelcome effects on the environment. Hydrocarbon refrigerants provide a range of boiling points with applicability from cryogenics to air conditioning. In the past hydrocarbon refrigerants have had limited applications primarily within the petrochemical industry to provide industrial chilling and process refrigeration. With the phase out of the CFCs, hydrocarbon refrigerants are entering into new arenas. The hydrocarbons most commonly used as refrigerants are there have been many changes in types of refrigerants, but ammonia is unique because it has seen continued use over this 150 year period.
Ammonia has Ozone Depletion Potential (ODP) and GWP equal to zero. It has inherently high refrigeration system energy performance, excellent thermodynamic properties, and high heat transfer coefficients. In a vapor state it is lighter than air. It is easily detected by smell, or by a variety of electrochemical and electronic sensors, and is readily available at a relatively low price. Less than 2 % of all ammonia commercially produced in the world is used as a refrigerant; however, ammonia enjoys low cost due to the large volume of production for use as a fertilizer. The primary disadvantage of ammonia is its toxic effect at higher concentrations (i.e. = above 300 ppm); however, this risk is somewhat mitigated by its pungent smell alerting humans of its presence since even at lower concentrations (5 ppm) it is self-alarming in the event of a leak. Ammonia is 21 classified in ASHRAE Standard 34 as having “lower flammability ” in air when its concentration ranges between 16 % and 28 % (by weight); and it is not compatible with copper and copper alloys.
3.2. Ammonia Mixtures as Replacement for R 22:
There are a number of good reasons for considering a switch to ammonia as the refrigerant if the equipment is to be replaced due to poor efficiency or excessive leakage.
It should be possible to achieve significantly higher efficiency than can be reached with R-404A or other industrial HFC blends. The leakage of ammonia from industrial systems can be reduced to zero in normal operation due to the more rugged industrial construction required due to material compatibility.
The future availability of “high global warming potential” HFCs is currently under discussion. Proposals have been tabled by the United States of America and “the Island States” (Micronesia) to introduce a “phase-down” of HFCs.
If the current range of HFCs are to be replaced with other fluorocarbons in the “low global warming potential” group then these will probably be unsaturated HFCs (“uHFCs”), also known as hydrofluoroolefins (HFOs).
3.3. Hydrocarbons:
International Journal of Emerging Technology and Advanced Engineering
Website: www.ijetae.com (ISSN 2250-2459, ISO 9001:2008 Certified Journal, Volume 6, Issue 2, February 2016)
239
Hydrocarbon refrigerants provide a range of boiling points with applicability from cryogenics to air conditioning. In the past hydrocarbon refrigerants have had limited applications primarily within the petrochemical industry to provide industrial chilling and process refrigeration. With the phase out of the CFCs, hydrocarbon refrigerants are entering into new arenas.
The hydrocarbons most commonly used as refrigerants are:
Methane 50, Ethane 170, Propane 290, Butane 600, Isobutane 600a, Ethylene 1150, Propylene R-1270, HFO-1234yf
3.4. Propane (R 290):
Zero GWP
Compatible with mineral oil.
Positive pressure in evaporator.
Low discharge and winding temperature
Low power consumption with appropriate size motor.
Low starting torque motor required.
Small refrigerant charge required.
3.5. Isobutane (R600a):
Zero GWP
Compatible with mineral oil.
Lowest system pressures.
Very low discharge/winding temperatures
Lower energy consumption if appropriate rate motor used.
Lower starting torque motor required in comparison to R 134a and R 152a.
Quantity of charge is very low.
Easily available.
IV. REFRIGERANTS TO BE REPLACED FOR FREON 22
With reference to the above properties of refrigerant following two binary mixtures and one ternary mixture were selected.
1. Ammonia / Propane (R717/R290) 2. Ammonia / Isobutane (R717/R600a)
[image:4.612.321.566.135.632.2]3. Ammonia / Propane / Isobutane (R717/R290/R600a)
Table I.
Properties of Various Refrigerants
Chemical
formula CHClF2 NH3 C3H8 C4H10 Composition
100 100 100 100
(%) Molar mass
86.468 17.03 44.096 58.122 (kg/kmole)
Critical temperature
(k)
369.3 405.4 369.89 407.81
Critical pressure
(MPa)
4.99 11.333 4.2512 3.629
Critical
523.84 225 220.48 225.5 Density
(kg/m3)
ODP 0.055 0 0 0
GWP 1500 0 0 0
Table II.
Properties of Various Blended Refrigerants
Chemical formula
NH3/ C3H8
NH3/ C4H10
NH3/ C3H8/ C4H10
Composition
70/30 70/30 40/30/30 (%)
Molar mass
20.874 21.615 28.207 (kg/kmole)
Critical temperature
(k)
382.81 387.75 -
Critical pressure
(MPa)
9.809 9.068 -
Critical
269.45 253.54 -
Density(kg/m3)
ODP 0 0 0
International Journal of Emerging Technology and Advanced Engineering
Website: www.ijetae.com (ISSN 2250-2459, ISO 9001:2008 Certified Journal, Volume 6, Issue 2, February 2016)
240
V. SELECTION OF COMPOSITION
Based on the calculation did for the various composition of the refrigerant mixture we choose the best composition based on the best results in the COP, Refrigeration effect, Specific work, Mass flow rate, Horse power per ton of refrigeration, ODP, GWP.
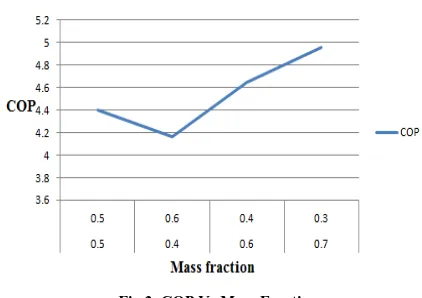
[image:5.612.47.530.104.757.2]EVAPORATOR TEMPERATURE: 0°C CONDENSOR TEMPERATURE: 40°C
Fig 3. COP Vs Mass Fraction
5.1. Calculation of Various Performance Parameters:
The ideal refrigeration cycle is considered with the following conditions.
System cooling capacity (kW) = 1.00 Compressor isentropic efficiency = 1.00 Compressor volumetric efficiency = 1.00 Electric motor efficiency = 1.00 Pressure drop in suction line = 0.00 Pressure drop in the discharge line = 0.00 Evaporator: average sat.Temp.(˚C) = -20 to +20 Condensor: average sat.Temp (˚C) = 35
Super heat (˚C) = 10
Sub cooling (˚C) = 5
5.2. R 22:
Condensor temperature: 35°C Evaporator temperature: -20°C
From saturation table of freon
At t0= -20°C
1
h =397.06 KJ/Kg S1=1.7826 K
J/Kg K
At tK=35°C
h3 =243.07 KJ/Kg
hg =415.34 KJ/Kg
Sg= 1.7048 KJ/Kg K
CP=0.94854 KJ/Kg K
Isentropic process: S1=S2
S2= Sg + CP ln(T2/T1)
1.7826=1.7048+0.94854 ln(T2/308)
Discharge temperature T2= 334.32 K
h2= hg+ CP (T2- T1)
= 415.34+0.94854(334.32- 308)
= 440.34 KJ/Kg
Refrigeration effect
q = h1-h3
=397.06-243.07
=154.09KJ/Kg
Specific work
w = h2-h1
= 440.31-397.06
= 43.25 KJ/Kg
Co.efficient of performance
COP = q/w
= 154.09/43.25
=3.56
Mass flow rate
m= 211/q
= 211/154.09
= 1.37 kg/min(TR)
Horse power per ton of refrigeration
HP/TR = 4.761/COP
= 4.761/3.56
= 1.337
VI. RESULT
6.1. Coefficient of Performance:
[image:5.612.59.270.240.389.2]International Journal of Emerging Technology and Advanced Engineering
Website: www.ijetae.com (ISSN 2250-2459, ISO 9001:2008 Certified Journal, Volume 6, Issue 2, February 2016)
241
[image:6.612.328.564.133.290.2]The figure shows that the COP increases with increase in evaporator temperature.
Fig 4. COP Vs Evaporator temperature
6.2 Discharge Temperature:
The figure 5 shows the variation of discharge temperature with varying evaporator temperature at 35°C condenser temperature for R22, R717/R 290, R717/R600a, R717/R 290/R600a.The figures show that discharge temperature decreases with increase in evaporator temperature.
Fig 5. Discharge temperature Vs Evaporator temperature
6.3 Refrigeration Effect:
[image:6.612.53.284.155.329.2]The figure 6 shows the variation of refrigeration effect with varying evaporator temperature at 35°C condenser temperature for R22, R717/R 290, R717/R600a, R717/R 290/R600a.The figures show that refrigeration effect increases with increase in evaporator temperature.
Fig 6. Refrigeration effect Vs Evaporator temperature
6.4 Refrigerant Mass Flow:
The figure 7 shows the variation of refrigerant mass flow with varying evaporator temperature at 35°C condenser temperature for R22, R717/R 290, R717/R600a, R717/R 290/R600a.The figures show that refrigerant mass flow decreases with increase in evaporator temperature.
Fig 7. Mass flow rate Vs Evaporator temperature
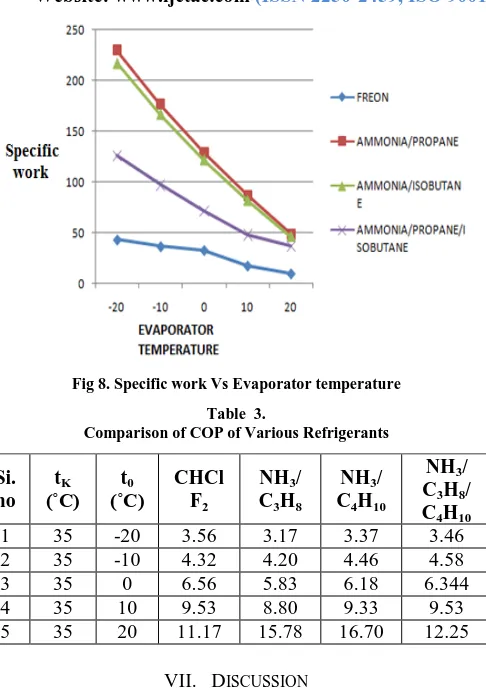
6.5 Specific Work:
[image:6.612.325.563.407.572.2] [image:6.612.48.286.440.597.2]International Journal of Emerging Technology and Advanced Engineering
Website: www.ijetae.com (ISSN 2250-2459, ISO 9001:2008 Certified Journal, Volume 6, Issue 2, February 2016)
[image:7.612.50.293.127.475.2]242
Fig 8. Specific work Vs Evaporator temperature Table 3.
Comparison of COP of Various Refrigerants
Si. no
tK (˚C)
t0 (˚C)
CHCl F2
NH3/ C3H8
NH3/ C4H10
NH3/ C3H8/ C4H10
1 35 -20 3.56 3.17 3.37 3.46
2 35 -10 4.32 4.20 4.46 4.58
3 35 0 6.56 5.83 6.18 6.344
4 35 10 9.53 8.80 9.33 9.53
5 35 20 11.17 15.78 16.70 12.25
VII. DISCUSSION
In present work the comparative performance analysis R22, R717/R 290, R717/R600a, R717/R290/R600a have been discussed. The results obtained permit the following remarks:
Coefficient of Performance of R717/R600a is higher than R22, R717/R 290, R717/R290/R600a.
Dischare temperature R717/R600a higher than R 22, R717/R290/R600a and lower than R717/R 290. But it is equal to R717/R 290 at evaporator temperature 20°C .
Refrigerant effect of R717/R600a is higher than R 22, R717/R 290, R717/R290/R600a.
Refrigeration mass flow rate of R717/R 600a is lower than R 22, R717/R290/R600a and it is equal to R717/R 290. At evaporator temperature 20°C it is higher than R717/R 290.
Specific work of R717/R 600a is higher than R 22, R717/R290/R600a but lower than R717/R 290. At evaporator temperature 20°C it is equal to R717/R 290.
ODP and GWP of R717/R 600a is zero but it is higher for R 22.
7.1 Selected Refrigerant:
According to the above results the blended refrigerant R717/R 600a is selected as the best alternative for R 22.
VIII. LIST OF SYMBOLS,ABBREVIATIONS AND
NOMENCLATURE
HFC Hydro-fluorocarbon
HFO Hydro fluoro-olefins
HC Hydro carbons
HCFC Hydro Chloro fluoro carbon
CFC Chlorofluorocarbon
ANSI American National Standard Institute
ASHARE American Society of Heating Air-Conditioning and Refrigeration Engineers
ODP Ozone Depletion Potential
GWP Global Warming Potential
COP Coefficient of performance
ppm parts per minute
ASTM American Society for Testing and Materials
R 22 Chlorodifluoromethane
R 717 Ammonia
R 290 Propane
R 600a Isobutane
Psat Saturated Pressure
hg Enthalpy of saturated vapour
Cp Specific heat of vapour
Sg Specific entropy of saturated vapour
h1 Enthalpy of vapour
h2 Discharge Enthalpy
h3 Enthalpy of vapour
HR/TR Horse power per ton of refrigeration
REFERENCES
[1] NIST Reference Fluid Thermodynamic and Transport Properties-REFPROP
[2] Chemistry web book- NIST Standard Refrigeration Database [3] ISO 817: 2007, Refrigerants - Designation and Safety Classification.
BSI, London.
International Journal of Emerging Technology and Advanced Engineering
Website: www.ijetae.com (ISSN 2250-2459, ISO 9001:2008 Certified Journal, Volume 6, Issue 2, February 2016)
243
[5] Pearson, Andy , " Ammonia as a Replacement for Medium Sized Modular R-22 Systems" (2010). International Refrigeration and Air Conditioning Conference.
[6] Kothandaraman C.P (1999), „Refrigeration tables and charts‟ New age international publishers.
[7] Baskaran A, Koshy Mathews (2012), „Thermal analysis of vapour compression refrigeration system with R152a and its blends R429A, R430A, R431A and R435A‟ International Journal of Scientific & Engineering Research Publications.
[8] Baskaran A, Koshy Mathews (2012), „A Performance Comparison of Vapour Compression Refrigeration System Using Eco Friendly Refrigerants of Low Global Warming Potential‟ International Journal of Scientific & Engineering Research Publications. [9] Sandip P.Chavhan, Mahajan S D (2013), „A Review of an