A n o v el m e t h o d of u si n g
a c c el e r o m e t r y fo r u p p e r li m b
F E S c o n t r ol
S u n , M , Ke n n ey, L a u r e n c e , S m i t h , CL, Wa ri n g , K, L u c ki e, H M , Li u,
A a n d H o w a r d , D
h t t p :// dx. d oi.o r g / 1 0 . 1 0 1 6 /j. m e d e n g p hy. 2 0 1 6 . 0 6 . 0 0 5
T i t l e
A n o v el m e t h o d of u si n g a c c el e r o m e t r y fo r u p p e r li m b F E S
c o n t r ol
A u t h o r s
S u n , M , Ke n n ey, L a u r e n c e , S m i t h , CL, Wa ri n g , K, L u c ki e,
H M , Li u, A a n d H o w a r d , D
Typ e
Ar ticl e
U RL
T hi s v e r si o n is a v ail a bl e a t :
h t t p :// u sir. s alfo r d . a c . u k /i d/ e p ri n t/ 3 9 1 8 6 /
P u b l i s h e d D a t e
2 0 1 6
U S IR is a d i gi t al c oll e c ti o n of t h e r e s e a r c h o u t p u t of t h e U n iv e r si ty of S alfo r d .
W h e r e c o p y ri g h t p e r m i t s , f ull t e x t m a t e r i al h el d i n t h e r e p o si t o r y is m a d e
f r e ely a v ail a bl e o nli n e a n d c a n b e r e a d , d o w nl o a d e d a n d c o pi e d fo r n o
n-c o m m e r n-ci al p r iv a t e s t u d y o r r e s e a r n-c h p u r p o s e s . Pl e a s e n-c h e n-c k t h e m a n u s n-c ri p t
fo r a n y f u r t h e r c o p y ri g h t r e s t r i c ti o n s .
1
Novel methods of using accelerometry for upper limb FES control
Mingxu Sun1, Laurence Kenney1*, Christine Smith2, Karen Waring1, Helen Luckie1, Anmin Liu1, David Howard1,3
¹ Centre for Health Sciences Research, University of Salford, UK
2Department of Allied Health Professions, Sheffield Hallam University, UK 3School of Computing, Science and Engineering, University of Salford, UK * Corresponding author.
Tel.: +44 161 295 2289
Email: [email protected]
Abstract
This paper reports on a novel approach to using a 3-axis accelerometer to capture body segment angle for upper limb functional electrical stimulation (FES) control. The approach calculates the angle between the accelerometer x-axis and the gravity vector, while avoiding poor sensitivity at certain angles and minimising errors when true acceleration is relatively large in comparison to gravity. This approach was incorporated into a state-machine controller which is used for the real-time control of FES during upper limb functional task performance. An experimental approach was used to validate the new method. Two participants with different upper limb impairments resulting from a stroke carried out four different FES-assisted tasks. Comparisons were made between angle calculated from arm-mounted accelerometer data using our algorithm and angle calculated from limb-mounted reflective marker data. After removal of coordinate misalignment error, mean error across tasks and subjects ranged between 1.4 and 2.9 degrees. The approach shows promise for use in the control of upper limb FES and other human movement applications where true acceleration is relatively small in comparison with gravity.
Keywords: Accelerometer, Body segment angle, Functional electrical stimulation control, Upper limb rehabilitation, Functional tasks
Introduction
2 programmes for motor re-learning [6, 7], suggesting limitations with the technologies used in these studies.
In recognition of this, researchers have developed a number of systems which provide the patient with FES support for a range of tasks and encourage voluntary engagement of the user. These include devices based on iterative learning control [8], proportionally controlled systems using EMG as an input signal [9] and, of most relevance to this paper, user-defined state machine controlled systems [10, 11]. User-defined state machine control offers a potentially simple approach to implementing task- and patient-specific FES support. However, in order to provide the user with the opportunity to directly engage with the task by actively initiating or controlling stimulation, a method is required to detect user intent. A range of sensors for this purpose have been investigated, including EEG [12] and EMG[13]. Each of these sensing approaches has its limitations and for all bar the most severely impaired, limb-mounted movement sensors offer an attractive alternative. Although 6 degree of freedom inertial measurement units (IMUs), which typically include accelerometers, rate gyroscopes and magnetometers, are available, they remain relatively bulky. This precludes their use on, for example, individual fingers. Further, although the price of IMUs has reduced over the past few years, compared with these devices, accelerometers remain cheaper, simpler to use in terms of data processing, and lower power. A small number of researchers have therefore investigated their application to upper limb FES [14-17]. However, as will be discussed below the methods used to derive estimations of orientation from accelerometer data are limited in these and many other papers.
Current methods for processing accelerometer signals to estimate orientation can be categorised according to the number of independent measures (accelerometer axes) used. The first group of methods are based on using just one accelerometer signal, either a single axis device or one axis of a multi-axis device. In the first embodiment of these, a series of calibration measurements over a range of angles is required and an interpolation algorithm can then be used to derive the angle of the sensitive axis from the vertical [18-20]. As the calibration curve is significantly non-linear, the accuracy is highly dependent on a thorough calibration. More commonly, a trigonometric approach is used, based on arccos or arcsin functions (e.g. [21-24]). Both of these approaches require calibration to accurately identify the value of the denominator. Regardless of which of these three techniques is adopted for processing the accelerometer signal, they all suffer from the same drawbacks. When the magnitude of acceleration on the sensitive axis approaches either 9.81 or -9.81, the sensitivity approaches zero because sin 𝛽 or cos 𝛽 approach 1, which means the signal to noise ratio is very poor [21, 23, 25, 26]. A small number of papers ignore the issue of poor sensitivity at zero or 90 degrees by suggesting a workable range for measurements [21, 23, 24]. For example, Miroslav Husak [23] refers to the measurement range with zero sensitivity as being a “Dead zone” and reports that, using the arcsin function, error increases from less than 2° over 4° when the sensitive axis nears ±90°.
3 reports that, using the arctan function, error increases from 1.37° to over 4.5° when the sensitive axis nears 0°.
When applying either approach to the analysis of accelerometers signals there remains the problem that orientation can only be accurately estimated if the true acceleration is small compared with gravity (as accelerometers measure the sum of true acceleration and gravity). While the use of distributed multiple accelerometers provide a solution to this problem [30, 31], this is less than ideal for application to upper limb FES because of the difficulty of donning the additional, rigidly connected, accelerometers.
In upper limb FES applications, the way the accelerometer signals are used for control purposes can be categorised as either direct use of the raw accelerometer signals [14, 16, 17] or using an angle-based approach [15], both of which suffer from one or more of the problems listed above.
In this paper we report on a novel approach to using accelerometry for upper limb FES control which addresses the issues discussed above. The paper begins by introducing a new approach to estimating angle relative to gravity from a 3D accelerometer, based on vector mechanics, which includes methods for avoiding poor sensitivity at certain angles and minimising errors when true acceleration is relatively large in comparison to gravity. The paper then reports on its application in our finite-state-machine (FSM) controlled FES system and evaluates its performance.
Methods
Angle estimation algorithm
4
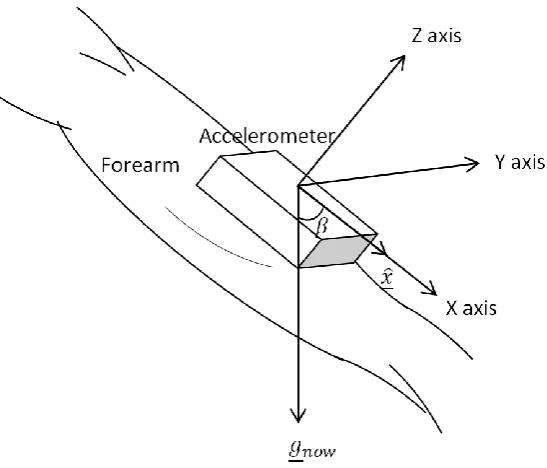
Figure 1: Angle between unit vector along x-axis and gravity vector
We use the definitions of the dot product and cross product between the gravity vector and unit vector along the x-axis to derive the following equations:
𝑐𝑜𝑠(𝛽) = 𝑔𝑛𝑜𝑤∙ 𝑥̂ |𝑔𝑛𝑜𝑤| |𝑥̂|=
𝑔𝑥
√|𝑔𝑥2+ 𝑔𝑦2+ 𝑔𝑧2|
(1)
sin(𝛽) =|𝑔𝑛𝑜𝑤× 𝑥̂| |𝑔𝑛𝑜𝑤| |𝑥̂|
= √(𝑔𝑧 )
2+ ( 𝑔 𝑦)2
√|𝑔𝑥2+ 𝑔𝑦2+ 𝑔𝑧2|
(2)
5
If 𝑐𝑜𝑠(𝛽) ≥ 0.707107 𝜃 = 𝑎𝑟𝑐𝑠𝑖𝑛(𝑠𝑖𝑛𝛽)
Else if 𝑐𝑜𝑠(𝛽) ≤ −0.707107 𝛽 = 𝜋 − 𝑎𝑟𝑐𝑠𝑖𝑛(𝑠𝑖𝑛𝛽) Else
𝛽 = 𝑎𝑟𝑐𝑐𝑜𝑠(𝑐𝑜𝑠𝛽) End
(3)
The proposed approach overcomes the problem of poor sensitivity to changes in angle when sin(𝛽) or cos(𝛽) approach 1 and does not suffer from the singularities seen in approaches which use 2-axis accelerometer signals and arctan.
In addition to the approach outlined above we have included an algorithm to reduce the likelihood of misinterpreting the accelerometer data when the true acceleration becomes significant compared with g (9.81 m/s2). In cases where the magnitude of the measured accelerometer vector significantly exceeds g (i.e. true acceleration is significant compared to g) the data point is ignored. This is achieved by applying a g-tolerance band (9.81 ± g-tolerance) and only using good data points that lie within that band. The FSM controller triggers a state transition when n good data points (i.e. within the g-tolerance band) have exceeded the specified body-segment angle threshold (using n good points acts as a noise filter). As the g-tolerance band narrows, it would be expected that a larger number of bad data points would be ignored by the controller and hence this may lead to a delay in moving between states. Conversely, if the g-tolerance band is too wide, errors in angle estimation would be expected to increase. In this study, we explore the effects of different values for the g-tolerance band on angle estimation and the trade-off between accuracy and number of bad data points ignored.
Experimental protocol
[image:6.595.74.526.696.762.2]Following ethical approval (REC ref: 10/H1005/26) two quite different participants, both with upper limb impairments following stroke, were invited to the lab to participate in the study. The participants are described in table 1.
Table 1: Participants
No Gender Age Hemiplegic
side
Dominant side
Years since onset
Fugl-Meyer Upper Extremity score
6
1 M 81 Left Right 3 years 29
[image:7.595.71.525.72.202.2]2 F 42 Right Right 13 years 37
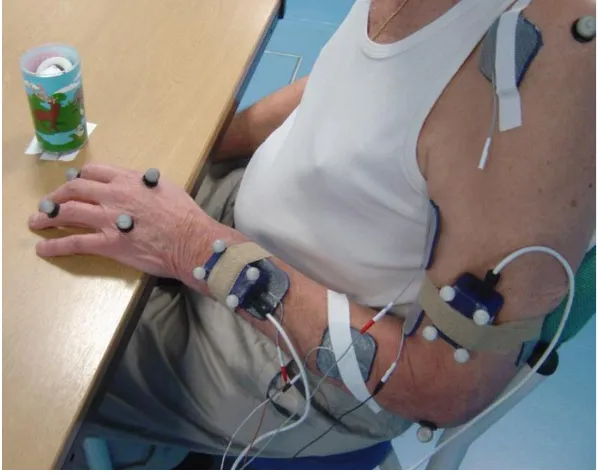
Figure 2 shows the experimental setup for the “Drink from a cup” task. Two inertial sensing units or IMUs (MT9 Xsens bv, NL), each with a cluster of four reflective markers on their upper corners, were attached to the upper arm and forearm of the subject’s affected limb using self-adherent bandage. The IMUs’ x-axes were approximately aligned with the long axes of the body segments. A Vicon motion analysis system (Vicon Motion Systems Ltd, Los Angeles, USA) employing ten cameras was used to capture the positions of the reflective markers on each IMU at a sampling frequency of 100 Hz. Only acceleration data was captured from the IMUs, at a sampling frequency of 20 Hz, using a separate laptop. This laptop also ran the Finite State Machine controller that produced the necessary stimulation profiles via a RehaStim 8-channel stimulator (Hasomed GmbH, Magdeburg, Germany), and also ran the graphical user interface (GUI) used to set up the FSM controller. A pulse signal from one of the Xsens system’s analog output channels was fed to an analogue input channel in the Vicon system to provide synchronization between the Xsens and Vicon systems. This experimental setup was also used to study another three tasks (see below for details of each task).
Figure 2: Experimental setup
[image:7.595.71.370.438.675.2]7 therapist at the start of each session as being very difficult or impossible for the user to perform unaided. The four tasks were “Brush coins into the other hand”, “Drink from a cup”, “Place an object onto a shelf” and “Pour water from a bottle to a cup”. For all tasks, the subject sat at a table with their affected hand comfortably placed on the table or on the thigh (for “Place an object into a shelf”) at the starting position. For each repeat of a task, the object(s) to be manipulated was/were placed in a pre-defined starting location.
The therapist used the GUI mentioned earlier to define each task as a sequence of FSM states (corresponding to movement phases), each of which was associated with a stimulation profile1 for each of the muscles to be stimulated (see figure 3). Threshold values for each muscle were established earlier in the setup process, leaving the therapist to define pulse width target and ramp time for each stimulated muscle in each phase. Pressing a button on the keyboard to leave the neutral phase, the therapist then used the GUI to manually adjust the pulse width target and ramp time for each of the stimulated muscles in phase 1, until the relevant limb motion was achieved. This process was repeated for each movement phase (FSM state). During each attempt, data were recorded from both the Vicon and Xsens systems. Once the therapist was satisfied with the resultant movement, he/she invited the participant to repeat the task until data on between 7 and 10 satisfactory repeats had been captured.
[image:8.595.83.513.382.646.2]Descriptions of the finite state machines for each of the four functional tasks are as follows:
Figure 3: Finite state diagrams for the following tasks (a) “Brush coins into the other hand”; (b) “Drink from a cup”; (c) Place an object onto a shelf; (d) Pour water from a bottle to a cup. The controller moves between states when the transition condition Btn is met (Btn = Button press). In each state (represented by a box), the specified muscles are stimulated where: AD&Tr = Anterior deltoid and Triceps; Bi = Biceps; Pr = Pronator; WE = Wrist extensors.
8 “Brush coins into the other hand” (figure 3a)
The subject was required to reach for coins positioned on the table and brush them back into his/her other hand. The position of the coins was such that (s)he could only achieve the task with FES assistance.
“Drink from a cup” (figure 3b)
The subject was required to reach for a cup, grasp it, lift the cup to the mouth, replace the cup and release it. The cup was positioned such that the subject could only achieve the task with FES assistance.
“Place an object onto a shelf” (figure 3c)
The subject was required to lift his/her forearm towards an object, grasp it, reach forward to put it on to a shelf and release it. The shelf was located such that (s)he could only achieve the task with FES assistance.
“Pour water from a bottle to a cup” (figure 3d)
The subject was required to reach for a bottle, grasp it and pour the water into a cup, replace the bottle and release it. The position of the cup was such that the subject could only achieve the task with FES assistance.
Data processing
The absolute angles from vertical of the two IMU x-axes, based on the accelerometer signals and the new algorithm described earlier, were recorded directly by the real-time FSM controller. The coordinates of the reflective markers attached to the IMUs were exported using Visual 3D software (C-Motion, Inc., Rockville, MD, USA). The Vicon marker data were down-sampled to provide data at 20Hz (frequency of the FSM controller) and synchronized with the IMU data. The calculation of the angles from vertical of the x-axes of the two IMUs, based on the Vicon data, is described in [32] and was implemented using Matlab (Mathworks inc. Natick, USA).
Data were checked post-collection and task repeats were discarded in cases where the marker visibility was incomplete, or synchronisation between the Xsens and Vicon systems failed.
To account for small misalignment errors between the marker-derived sensor coordinate frame and the accelerometer coordinate frame, the first 10 frames of static data were used to artificially remove the offset. Comparisons between accelerometer and marker-derived angles were drawn using RMS error and Peason Correlation coefficients, before and after removing the offset.
Finally, to investigate the effect of different g-tolerance bands on the angle estimation, we applied three different tolerance bands to the data (9.81 ± 0.5 𝑚/𝑠2, 9.81 ± 0.3 𝑚/𝑠2 and 9.81 ± 0.2 𝑚/𝑠2 ). Comparisons are presented between maximum error and number of data points lying outside of the tolerance band.
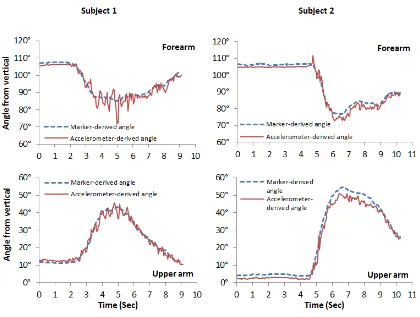
9 Figure 4 shows example data for forearm and upper arm angles from the vertical, obtained from both reflective marker and accelerometer approaches, for the task “Brushing coins into the other hand” (Left: subject 1; Right: subject 2)
Figure 4: Example data from task “Brush coins into the other hand”
[image:10.595.81.501.141.458.2]Table 2 compares the angles derived from marker data with accelerometer-derived angles for each subject and each task.
Table 2: Comparison between marker and accelerometer-derived angles (7-10 trials per subject). Pearson’s correlation (r) and RMS error (ɛ) are shown before and after removal of alignment error. (UA = upper arm; FA = forearm)
Subject 1:
Task 1 Task 2 Task 3 Task 4
FA UA FA UA FA UA FA UA
r 0.947 0.986 0.992 0.993 0.943 0.988 0.985 0.994
ɛ (deg.) 3.12 2.27 2.48 1.62 1.61 1.67 1.63 2.06
ɛ after removal
of alignment error (deg.)
2.91 2.46 1.73 1.60 1.56 1.50 1.72 2.75
[image:10.595.68.532.617.719.2]10
Task 1 Task 2 Task 3 Task 4
FA UA FA UA FA UA FA UA
r 0.986 0.995 0.995 0.996 0.985 0.998 0.982 0.990
ɛ (deg.) 2.82 3.47 1.94 3.24 2.12 3.18 1.91 1.93
ɛ after removal
of alignment error (deg.)
[image:11.595.69.530.73.173.2]2.33 2.04 2.02 1.42 1.95 2.25 1.66 2.03
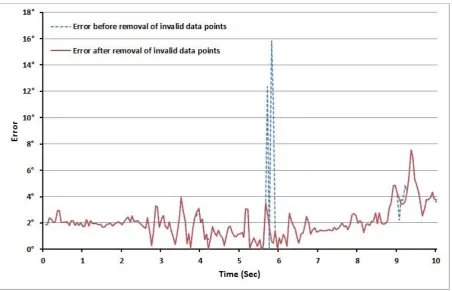
Figure 5 shows how maximum errors are reduced, but not eliminated by removing data points which lie outside of the g-tolerance band.
Figure 5: Errors in forearm “absolute angle from vertical” calculated from an example trial of the “Drink from a cup” task (subject 1) before and after removal of data points using a g-tolerance ±0.5 m/s2.
[image:11.595.73.526.235.526.2]Table 3 illustrates the effect of different g-tolerance bands on the accuracy of angle estimation and number of data points lying outside of the tolerance band.
Table 3: Effect of g-tolerance (on maximum error (δ) (.deg) and percentage of invalid data (p) (%)
Subject 1:
Tolerance band
Task 1 Task 2 Task 3 Task 4
FA UA FA UA FA UA FA UA
δ
[image:11.595.71.525.691.771.2]11 ± 0.2 m/s2 10.6±2.6 6.5±1.4 8.1±2.3 6.8±1.2 6.1±2.4 7.3±4.1 6.6±3.8 4.9±0.9
p
Infinite 0 0 0 0 0 0 0 0
± 0.5 m/s2 6.5±2.9 7.1±3.6 7.5±2.2 1.1±0.9 12.7±3.5 2.1±1.4 8.0±3.3 5.1±2.3 ± 0.3 m/s2 17.4±4.5 22.1±8.7 16.0±3.6 6.5±2.1 33.1±6.8 8.6±2.6 18.1±3.7 17.6±4.2 ± 0.2 m/s2 28.1±6.2 34.7±12.6 30.1±5.4 15.9±3.1 51.6±9.7 19.8±3.8 32.3±4.6 30.1±5.4
Subject 2:
Tolerance band
Task 1 Task 2 Task 3 Task 4
FA UA FA UA FA UA FA UA
δ
Infinite 11.3±3.2 9.5±1.4 6.5±2.6 7.2±0.9 10.27±4.4 9.43±2.3 8.16±1.3 5.5±0.6 ± 0.5 m/s2 8.9±3.7 8.9±1.8 6.1±2.8 7.0±0.8 6.83±1.1 8.29±3.1 7.39±1.8 5.5±0.6 ± 0.3 m/s2 8.1±2.4 8.1±1.8 4.9±1.0 6.3±0.8 6.20±1.0 7.34±2.7 7.39±1.8 5.1±0.7 ± 0.2 m/s2 8.1±2.4 7.3±1.3 4.6±0.6 6.1±1 5.50±1.0 6.53±2.0 6.86±1.7 4.8±0.8
p
Infinite 0 0 0 0 0 0 0 0
± 0.5 m/s2 9.5±3.0 15.2±2.8 3.8±1.3 2.2±1.2 8.6±1.5 15.9±2.9 7.9±2.4 3.9±3.1 ± 0.3 m/s2 14.8±4.3 35.4±5.4 12.9±2.2 30.2±5.4 20.1±3.6 33.3±3.7 19.3±4.1 27.6±5.8 ± 0.2 m/s2 20.3±4.8 50.8±7.1 23.6±2.6 61.0±4.8 30.7±5.1 44.7±5.0 31.9±6.0 49.4±6.1
Discussion and conclusions
This paper has introduced a new method of calculating angle from vertical from a 3-axis accelerometer. The approach avoids the key limitation of methods based on single or dual axis accelerometer signals, namely when the magnitude of the accelerometer signal on the sensitive axis approaches either 9.81 or -9.81, the sensitivity approaches zero and hence the signal to noise ratio becomes very poor. Figure 4 and table 2 illustrate the performance of the method using upper limb mounted IMUs during the performance of a range of typical FES assisted upper limb tasks.
Ignoring readings where the true acceleration is significant in comparison to gravity can remove some unwanted spikes and thereby improve the robustness of angle triggering (Table 3). However, referring to Figures 5, it is clear that not all peaks in error value are removed. This is because only those peaks that alter the magnitude of the measured vector are interpreted as bad readings. Clearly, depending on the direction of the true acceleration (or the equivalent noise from some other source) the magnitude of the measured accelerometer vector may not fall outside the g-tolerance band. As can be seen in table 3, the tighter the g-g-tolerance band the greater the number of bad data points which fall outside and hence the higher the potential delays in transitioning between FSM states using angle triggering. In the worst case, when the g-tolerance is set at ± 0.2 m/s2, 61% of data points fall outside the tolerance band. Based on our findings a g-tolerance of ± 0.5 m/s2 appears to be an acceptable value and this was used in subsequent usability trials [33].
12 [1] Howlett O, Lannin NA, Ada L, McKinstry C. Functional electrical stimulation improves activity after stroke: A systematic review with meta-analysis. Arch Phys Med Rehabil. 2015.
[2] Daly JJ, Hogan N, Perepezko EM, Krebs HI, Rogers JM, Goyal KS, et al. Response to upper-limb robotics and functional neuromuscular stimulation following stroke. J Rehabil Res Dev. 2005;42:723-36.
[3] Mann GE, Burridge JH, Malone LJ, Strike PW. A pilot study to investigate the effects of electrical stimulation on recovery of hand function and sensation in subacute stroke patients. Neuromodul. 2005;8:193-202.
[4] Page SJ, Levin L, Hermann V, Dunning K, Levine P. Longer versus shorter daily durations of electrical stimulation during task-specific practice in moderately impaired stroke. Arch Phys Med Rehabil. 2012;93:200-6.
[5] Tarkka IM, Pitkanen K, Popovic DB, Vanninen R, Kononen M. Functional electrical therapy for hemiparesis alleviates disability and enhances neuroplasticity. . Tohoku J Exp Med 2011;225:71-6. [6] Kahn LE, Zygman ML, Rymer WZ, Reinkensmeyer DJ. Robot-assisted reaching exercise promotes arm movement recovery in chronic hemiparetic stroke: a randomized controlled pilot study. J Neuroeng Rehabil. 2006;3:12.
[7] Timmermans AA, Seelen HA, Willmann RD, Kingma H. Technology-assisted training of arm-hand skills in stroke: concepts on reacquisition of motor control and therapist guidelines for rehabilitation technology design. J Neuroeng Rehabil. 2009;6:1.
[8] Meadmore KL, Hughes AM, Freeman CT, Cai Z, Tong D, Burridge JH, et al. Functional electrical stimulation mediated by iterative learning control and 3D robotics reduces motor impairment in chronic stroke. J Neuroeng Rehabil. 2012;9:32.
[9] Thorsen RA, Occhi E, Boccardi S, Ferrarin M. Functional electrical stimulation reinforced tenodesis effect controlled by myoelectric activity from wrist extensors. J Rehabil Res Dev. 2006;43:247-56. [10] Thrasher TA, Zivanovic V, McIlroy W, Popovic MR. Rehabilitation of reaching and grasping function in severe hemiplegic patients using functional electrical stimulation therapy. Neurorehabil Neural Repair. 2008;22:706-14.
[11] Popovic DB, Sinkjaer T, Popovic MB. Electrical stimulation as a means for achieving recovery of function in stroke patients. Neurorehabil. 2009;25:45-58.
[12] Kim T, Kim S, Lee B. Effects of Action Observational Training Plus Brain-Computer Interface-Based Functional Electrical Stimulation on Paretic Arm Motor Recovery in Patient with Stroke: A Randomized Controlled Trial. Occup Ther Int. 2015.
[13] Hara Y, Obayashi S, Tsujiuchi K, Muraoka Y. The effects of electromyography-controlled functional electrical stimulation on upper extremity function and cortical perfusion in stroke patients. Clin Neurophysiol. 2013;124:2008-15.
[14] Tresadern P, Thies S, Kenney L, Howard D, Goulermas JY. Artificial Neural Network Prediction Using Accelerometers to Control Upper Limb FES During Reaching and Grasping Following Stroke. IEEE Engineering in Medicine and Biology Society Annual Conference. 2006;1:2916-9.
[15] Mann G, Taylor P, Lane R. Accelerometer-triggered electrical stimulation for reach and grasp in chronic stroke patients: a pilot study. Neurorehabil Neural Repair. 2011;25:774-80.
[16] Tresadern P, Thies S, Kenney LPJ, Howard D, Goulermas JY. Rapid prototyping for functional electrical stimulation control. Pervasive Comput. 2008;7:62-9.
[17] Tong KY, Mak AF, Ip WY. Command control for functional electrical stimulation hand grasp systems using miniature accelerometers and gyroscopes. Med Biol Eng Comput. 2003;41:710-7. [18] Crago PE, Memberg WD, Usey MK, Keith MK, Kirsch RF, Chapman GJ, et al. An elbow extension neuroprosthesis for individuals with tetraplegia. Rehabil Eng. 1998;6:1-6.
13 [20] Graham RB, Agnew MJ, Stevenson JM. Effectiveness of an on-body lifting aid at reducing low back physical demands during an automotive assembly task: Assessment of EMG response and user acceptability. Appl Ergon. 2009;40:936-42.
[21] Ohnishi K, Kajitani I, Morio T, Takagi T. Multimodal sensor controlled three Degree of Freedom transradial prosthesis. IEEE International Conference on Rehabilitation Robotics, 2013. Seattle, Washington: IEEE; 2013. p. 1-6.
[22] Lugade V, Fortune E, Morrow M, Kaufman K. Validity of Using Tri-Axial Accelerometers to Measure Human Movement - Part I: Posture and Movement Detection. Med Eng Phys. 2014;36:169-76.
[23] Husak M. Model of tilt sensor system. 9th International Conference Electronics, Circuits and Systems: IEEE; 2002. p. 227-30.
[24] Bazzarelli M, Durdle NG, Lou E, Raso VJ. A wearable computer for physiotherapeutic scoliosis treatment. Instrum Measurement. 2003;52:126-9.
[25] Baek J, Yun BJ. Posture monitoring system for context awareness in mobile computing. Instrum Measurement. 2010;56:1589 - 99.
[26] Williams AJ. A solid state tilt meter for current meter attitude determination. Oceans '04 MTTS/IEEE Techno-Ocean '04. Kobe2004. p. 1395 - 8.
[27] Rodriguez-Donate C, Morales-Velazquez L, Osornio-Rios RA, Herrera-Ruiz G, Romero-Troncoso RDJ. FPGA-based fused smart sensor for dynamic and vibration parameter extraction in industrial robot links. Sens. 2010;10:4114-29.
[28] Pallejà T, Tresanchez M, Teixidó M, Palacin J. Bioinspired Electronic White Cane Implementation Based on a LIDAR, a Tri-Axial Accelerometer and a Tactile Belt. Sens. 2010;10.
[29] Šipoš M, Pačes P, Roháč J, Nováček P. Analyses of Triaxial Accelerometer Calibration Algorithms. Sens J. 2012;12:1157-65.
[30] Giansanti D, Macellari V, Maccioni G, Cappozzo A. Is it feasible to reconstruct body segment 3-D position and orientation using accelerometric data? IEEE Trans Biomed Eng. 2003;50:476-83.
[31] Madgwick SOH, Harrison AJL, Sharkey PM, Vaidyanathan R, Harwin WS. Measuring motion with kinematically redundant accelerometer arrays: Theory, simulation and implementation. Mechatron. 2013;23:518-29.
[32] Sun M. A functional electrical stimulation (fes) control system for upper limb rehabilitation [Doctoral Thesis]: University of Salford; 2014.
[33] Smith CL. Usability engineering in the design and evaluation of a functional electrical stimulation system for upper limb rehabilitation [Doctoral Thesis]: University of Salford; 2015.
Acknowledgements.