http://dx.doi.org/10.4236/ijcns.2015.810037
Performance Evaluation of Enterprise-Wide
Network that Its Backbone Is Based on
Leased Trunk
Ajibo Augustine, Igboeli Chukwudi, Ani Cosmas
Department of Electronic Engineering, University of Nigeria Nsukka, Enugu, Nigeria Email: [email protected], [email protected], [email protected]
Received 17 August 2015; accepted 23 October 2015; published 29 October 2015
Copyright © 2015 by authors and Scientific Research Publishing Inc.
This work is licensed under the Creative Commons Attribution International License (CC BY).
http://creativecommons.org/licenses/by/4.0/
Abstract
Asynchronous Transfer Mode (ATM) has been recommended and has been accepted by industry as the transfer mode for Broadband network. Currently, large scale effort has been undertaken both in the industry and academic environment to design and build high speed ATM networks for cor-porate bodies. These networks are meant to support both real-time and non-real time tions with different quality of service (QoS) requirements. The resources to support the applica-tions QoS requirements are typically limited and therefore the need to dynamically allocate re-source in a fair manner becomes inevitable. In this work, an evaluation is carried out on the per-formance of enterprise-wide network that its backbone is based on leased trunk. The perper-formance of the leased trunk is evaluated when loaded with homogeneous and heterogeneous traffic. The evaluation is carried out in order to determine the exact effect of traffic overload on resources- trunk transmission capacity and buffer. The aim is to define the optimum loading level and the associated QoS parameter values. A typical network was adopted, modeled and simulated in MATLAB environment by using Simulink tool and the results obtained were analyzed by using Mi-crosoft Excel.
Keywords
B-ISDN, ATM, QoS1. Introduction
of services delivered and technology. The difference in the nature of the services supported by telecommunica-tion network has actually been the brain behind rapid changes in technological environment [1] [2].
Networks that have evolved over time have always had a compromise in meeting the varying QoS requiment of the services they support. The need to have networks that can offer a wide spectrum of services has re-sulted in considerable interest in research, development and standardization of broadband integrated networks (B-ISDN). The asynchronous transfer mode (ATM) has been chosen as the transfer mode for broadband net-works primarily because of its flexibility and efficiency. ATM can support bursty, circuit oriented and conti-nuous bit-rate traffic and can provide flexibility in user interface [3].
Although broadband communication network (B-ISDN) provides flexibility in catering for traffic mix, to be efficient, proper bandwidth and buffer allocation procedures are needed for call admission, flow, and congestion control, as well as routing of traffic at the access and transit nodes [3] [4].
ATM is a packet-switching technique for the transport of user information where the packet, called a cell, has a fixed size. An ATM cell includes a payload field carrying the user data, whose length is 48 bytes, and a header composed of 5 bytes [4]-[6].
ATM based enterprise networks are cooperated network whose access nodes are ATM switches. These nodes provide highly effective congestion control and high flexibility in allocating bandwidth [3]. This basically stems are from the use of statistical multiplexing at the access and transport nodes. Many large national and multina-tional enterprises choose to install and run their own private integrated voice and data networks for all enter-prise-wide communications [7]. Typically, such networks comprise an intelligent switching node at each site and these are then interconnected by high bit rate digital leased circuits to form an enterprise-wide network. The switching nodes are based on intelligent multiplexers with the bandwidth of the leased circuits assigned in a fixed way—N x 64 kbps—to meet the particular inter-site voice (PABX), and data (terminal and LAN) traffic. With the introduction of services such as videoconferencing and video-telephony, more sophisticated inter-site LAN traffic comprising real time multimedia information is now being considered. The demands on the inter- site leased circuits are thus increasing rapidly. The cost of high-bandwidth leased circuits is high and hence any improvement in utilization of transmission capacity over fixed-bandwidth assignment can result in significant cost savings to the operators of such networks [8]-[10].
In this work, an evaluation is carried out on the performance of enterprise network that its backbone is based on leased trunk. The performance of the leased trunk is evaluated when loaded with homogeneous and hetero-geneous traffic of varying QoS requirements. The evaluation is carried out in order to determine the exact effect of traffic overload on resource-trunk transmission capacity and buffer.
2. Network Architecture
[image:2.595.126.503.571.704.2]The adopted architecture for this research is that of a typical corporate network connected to another corporate network geographically separated linked via leases trunk line from public network which serves as its backbone network as shown in Figure 1. At the interface of each gateway enterprise site, the leased trunk is employed in carrying traffic from one site to the other. The gateway used for this research is an ATM multiplexer. The choice of ATM sprouts from the fact that the traffic that would be generated at any of the corporate sites is broadband services (i.e. a combination of voice, data and video) and would be required to be delivered at a desired QoS.
ATM which is an outgrowth of effort to develop broadband integrated service digital network (ISDN) capability provides a transport mechanism that allows digital data to be effectively transmitted over high speed links. At each corporate site, we have a network interconnection of fixed LAN, WLAN and PABX. This network inter-connection generates the heterogeneous and homogeneous traffic that will be carried though the leased trunk.
3. Simulation Model
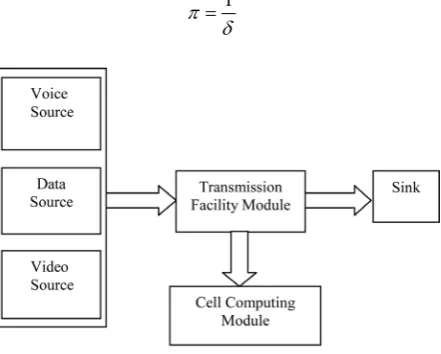
In high speed packet-switched network architectures such as ATM, several classes of traffic streams with widely varying traffic characteristics are statistically multiplexed and share common switching and transmission re-sources. The proposed model for this paper is shown in Figure 2. The model is divided into three modules: the traffic source module, the transmission facility module and the cell loss computing module.
3.1. Traffic Source Module
This module is comprised of voice, data and video traffic sub-modules. They were all modeled based on Markov modulated Poisson process (MMPP). MMPP traffic source was adopted as it account for the bursty nature of the various traffic type under consideration. Alternative to MMPP source is Bernoulli model. However, it cannot be used to characterize the bursty phenomenon of the services supported by enterprise-wide network.
3.2. Transmission Facility Module
This module comprise of a first-in-first-out (FIFO) transmission buffer queue with fixed capacity (ATM FIFO), an associated transmission link single server(ATM SERVER) as shown. The single server was used because ATM multiplexer was used for providing statistical multiplexing service for the BISDN service supported by the network and carried via a leased trunk.
3.3. Cell Computing Module
The cell loss rate predicting module carries out computation based on fluid-flow approximation approach. It as-sumes a uniform arrival and service process—continuous information flow instead of the discrete flow of cells. Fluid flow approximation compares favorably with other existing and popularly accepted methods [6]. This module performs the computation of cell loss rate for the different traffic (services) supported by the network. The module reads out minimum, mean and maximum cell arrival rate during the course of simulation every one second and reads in these values into the cell computing module where the cell loss is computed every second during the course of running the simulation. The average of the cell loss is at the end of the simulation obtained from this module.
The traffic source model generates cells at the rate of π cells per unit time during each burst period. The pa-rameter π is expressed as:
1 π
δ
[image:3.595.205.426.531.708.2]= (1) [5]
where δ is the cell generation-period
For the period (Ts + τ) unit time, the mean rate of cell generation, λ, is expressed as:
average number of cells in a burst
Ts
λ
τ =
+ (2) [5]
Hence a source model that generates cells at peak rate π and mean rate λ can be represented by the expression:
(
1 1)
Ts= ×
τ
ρ
− (3) [5]where ρ is the ratio of mean to peak rate and is known as the burstiness. This can also be expressed as a fraction of the on time by the expression:
Ts
τ ρ
τ =
+ (4) [5]
Cell loss rate is calculated for buffer capacities from zero to the maximum buffer occupancy, κ, using the ex-pression below:
Number of cells rejected Cell loss rate
Number of cells through queue Number of cells rejected
=
+ (5) [5]
In the case of a single source (N = 1) the cell loss probability, Pr, is given by:
( )
Pr= ×
ψ
exp⋅ −ϕ
(6) [5]Normally, the factor ψ is approximated to unity and
(
)
(
)(
)
π µ λ κ ϕ
τ π λ π µ − =
− − (7) [5]
For multiple sources, N, each independently emitting information, Pr(N) is evaluated using equation (8)
( )
(
0)
Pr N = Φ × Θ×exp⋅ Z ×
ε
(8) [5]where,
N
Nλ µ
Φ =
,
[ ]1
1 0 N i i i Z Z Z µ π − − = Θ = −
∏
,and ε k τπ = .
0
Z and Zi are eigenvalues; Z0 is the largest and can be expressed explicitly as:
(
)
(
)(
)
2 0 N N Z Nµ λ π
µ π λ π µ
− = −
− − (9) [5]
(
0)
i
Z i≠ can be numerically determined by solving the set of roots of a quadratic expression with constant values A(i), B(i) and C(i):
( )
2 2 22 2
N N
A i i
π
µ
π
−
≅ − −
(10) [5]
( )
2 2 2 22
2 2
N N
B i
π
λ
i Nπ
π
µ
π λ
π λ
π
− −
≅ − −
− −
(11) [5]
( )
2 2 22 2
N N
C i π i
π λ ≅ − − − −
(12) [5]
( )
2( )
( )
0, 1, 2, ,
A i z +B i z+C i = i= N (13) [5]
Expressions for ( )
( )
1,2Z i are then obtained and the stable set used as negative eigenvalues.
4. Simulation Results and Analysis
In order to determine the optimum network resource needed to support service of an enterprise-wide network that is based on leased trunk, the QoS parameters relating to specific traffic load and transmission rates are ob-tained by evaluating the performance of the queuing process at a node for a given buffer size.
The simulation was carried out with the range of values in mind for trunk capacity: 15 Mbps, 20 Mbps, 30 Mbps and 40 Mbps while for that of buffer capacity was varied in the range of: 5, 10, 15, 20 and 25. For the purpose of result generation, the simulation was run for 1000seconds. Readings were not taken for the first 20 seconds as the system gained stability at this point.
The above QoS parameters were taken into consideration and relationship established between them in the following order.
4.1. Cell Loss Rate as a function of Buffer Capacity at Varying Traffic Intensity for the
Different Traffic Source
In this case, a comparison is done to ascertain the behavior of the network in terms of cell loss rate and buffer capacity when the network is loaded separately with the different combination of traffic sources under consider-ation (i.e. homogeneous & heterogeneous sources) for a given traffic intensity. The comparison was done by loading the network with the different traffic types at given traffic intensity and observing its effect on the probability of traffic drop in the network (cell loss rate or blocking probability) as the capacity of the buffer at the ATM access node is varied in the range of 5, 10, 15 and 20. The set of curves obtained at this different traf-fic intensities are shown in Figures 3-5 respectively for the different traftraf-fic sources under consideration.
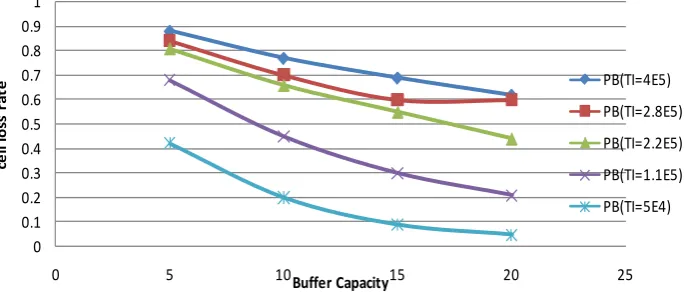
The family of curves shown in Figure 3 represents the observed behavior of the network in terms of cell loss rate and buffer capacity when the network was loaded with traffic from the homogeneous source at varying in-tensity in the range of 5.00E04, 1.10E05, 2.20E05, 2.80E05 and 4.00E5cells/second respectively.
The set of curves obtained as shown in Figure 3, shows that there is an inverse relationship between cell loss rate and buffer capacity for a given traffic intensity i.e. as the buffer capacity becomes smaller the network blocking probability of cells increases. This is attributable to the fact that as the buffer capacity at the ATM access node reduces, it becomes unable to accommodate more of the busty traffic generated by the homogene-ous source at a given traffic intensity, and as such drops some of this traffic in the network.
The set of curves obtained, it can be easily decided what buffer capacity will support a particular traffic inten-sity at a given QoS value (i.e. cell loss rate values). If we consider a buffer capacity of 10, one can easily deter-mine from the set of plots the individual QoS value for each traffic intensity under consideration. It is seen from the plots that at a traffic intensity of 5.00E04, and at an access node buffer capacity of 10, the QoS value the
0 0.1 0.2 0.3 0.4 0.5 0.6 0.7 0.8 0.9 1
0 5 10 15 20 25
ce
ll lo
ss
r
at
e
Buffer Capacity
PB(TI=4E5) PB(TI=2.8E5) PB(TI=2.2E5) PB(TI=1.1E5) PB(TI=5E4)
[image:5.595.143.486.547.693.2]network will provide at this point is 0.20. While at a traffic intensity of 1.10E05, and at an access node buffer capacity of 10, the QoS value the network will provide will be 0.45. Similarly, at a traffic intensity of 2.20E05, and at an access node buffer capacity of 10, the QoS value the network will provide will be 0.65. Furthermore, at a traffic intensity of 2.80E05, and at an access node buffer capacity of 10, the QoS value the network will provide will be 0.70. Finally, at a traffic intensity of 4.0E5, and at an access node buffer capacity of 10, the QoS value the network will provide will be 0.74.
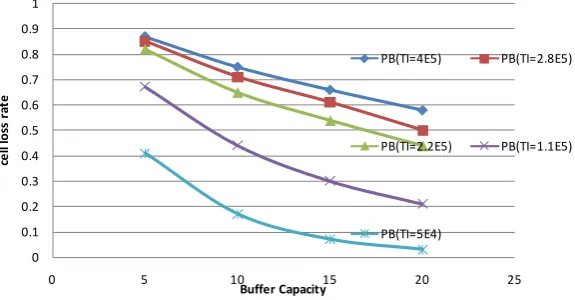
The family of curves as shown in Figure 4 represents the observed behavior of the network in terms of cell loss rate and buffer capacity when the network was loaded with traffic from the heterogeneous source (i.e. data and voice) at varying intensity in the range of: 5.0E04, 1.1E05, 2.2E05, 2.8E05 and 4.0E5cells/second respec-tively.
The set of curves obtained as shown in Figure 4, it is seen that there is an inverse relationship between cell loss rate and buffer capacity for a given traffic intensity i.e. as the buffer capacity becomes smaller the probabil-ity of traffic drop in the network (blocking probabilprobabil-ity/cell loss rate) increase. This observed behavior is attri-butable to the fact that as the buffer capacity at the ATM access node becomes small, it becomes unable to ac-commodate more of the busty traffic generated by the heterogeneous source (i.e. data and voice source) at spe-cific traffic intensity, and as such drops some of these traffic in the network.
From the set of curves obtained, one can be easily decided what buffer capacity will support a particular traf-fic intensity at a given QoS value (i.e. cell loss rate) in the network. For example if we consider a buffer capacity of 10, one can easily say from the set of plots the individual QoS value for each traffic intensity under consider-ation. It is seen from the plots that at a traffic intensity of 5.00E04, and at an access node buffer capacity of 10, the QoS value the network will provide at this point is 0.26. While at a traffic intensity of 1.10E05, and at an access node buffer capacity of 10, the QoS value the network will provide will be 0.44. Similarly, at a traffic in-tensity of 2.20E05, and at an access node buffer capacity of 10, the QoS value the network will provide will be 0.65.
Furthermore, at a traffic intensity of 2.80E05, and at an access node buffer capacity of 10, the QoS value the network will provide will be 0.70. Finally, at a traffic intensity of 4.00E5, and at an access node buffer capacity of 10, the QoS value the network will provide will be 0.80.
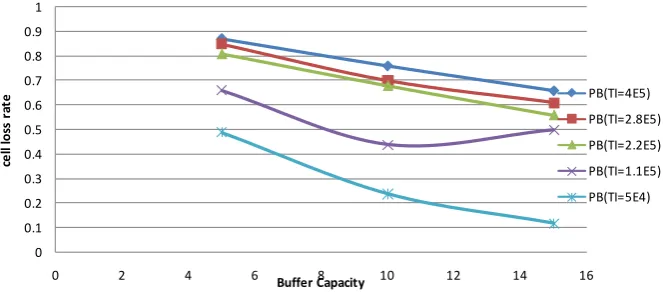
The family of curves as shown in Figure 5 represents the observed behavior of the network in terms of cell loss rate and buffer capacity when the network was loaded with traffic from the heterogeneous source (i.e. data, voice and video) at varying intensity in the range of: 5.0E04, 1.1E05, 2.2E05, 2.8E05 and 4.0E5cells/second re-spectively.
From the set of curves obtained as shown in Figure 5, it is seen that there is an inverse relationship between cell loss rate and buffer capacity for a given traffic intensity i.e. as the buffer capacity becomes smaller network blocking probability of cells increases. This observed behavior is attributable to the fact that as the buffer capac-ity at the ATM access node reduces, it becomes unable to accommodate more of the busty traffic generated by the heterogeneous source (i.e. data, voice and video source) at specific traffic intensity, and as such drops some of these traffic in the network.
0 0.1 0.2 0.3 0.4 0.5 0.6 0.7 0.8 0.9 1
0 5 10 15 20 25
ce
ll lo
ss
r
at
e
Buffer Capacity
PB(TI=4E5) PB(TI=2.8E5)
PB(TI=2.2E5) PB(TI=1.1E5)
[image:6.595.170.458.545.695.2]PB(TI=5E4)
0 0.1 0.2 0.3 0.4 0.5 0.6 0.7 0.8 0.9 1
0 2 4 6 8 10 12 14 16
ce
ll lo
ss
r
at
e
Buffer Capacity
PB(TI=4E5) PB(TI=2.8E5) PB(TI=2.2E5) PB(TI=1.1E5) PB(TI=5E4)
Figure 5. Blocking Probability against Buffer Capacity for heterogeneous source (Voice, Data & Video) at varying traffic intensity.
The set of curves obtained, one can be easily decided what buffer capacity will support a particular traffic in-tensity at a given QoS value (i.e. cell loss rate) in the network. For example if we consider a buffer capacity of 10, one can easily say from the set of plots the individual QoS value for each traffic intensity under considera-tion. It is seen from the plots that at a traffic intensity of 5.00E04, and at an access node buffer capacity of 10, the QoS value the network will provide at this point is 0.24. While at a traffic intensity of 1.10E05, and at an access node buffer capacity of 10, the QoS value the network will provide will be 0.44. Similarly, at a traffic in-tensity of 2.20E05, and at an access node buffer capacity of 10, the QoS value the network will provide will be 0.68. Furthermore, at a traffic intensity of 2.80E05, and at an access node buffer capacity of 10, the QoS value the network will provide will be 0.70. Finally, at a traffic intensity of 4.00E5, and at an access node buffer ca-pacity of 10, the QoS value the network will provide will be 0.86.
4.2. Performance Analysis of the Network with Respect to Cell Loss Rate and Buffer
Capacity at a Traffic Intensity of 2.80E05
The set of curves obtained as shown in Figure 6 shows an inverse relationship between cell loss rate and buffer capacity for the traffic generated at an intensity of 2.80E05 by the different traffic source under consideration. Form the set of curves obtained it is seen that the homogeneous source experiences a constant cell loss rate of 0.60 for a buffer capacity between 15 and 20 while the heterogeneous sources experience more cell loss at each of the corresponding buffer capacity. This observed behavior is attributable to the fact that the heterogeneous sources better utilizes the network resources as they make more use of the buffer at the access node thereby re-ducing the traffic drop experienced by the heterogeneous sources.
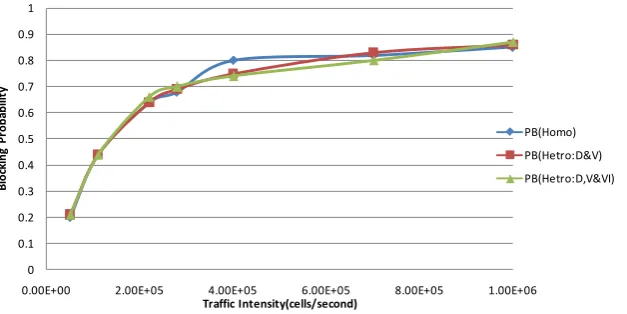
4.3. Performance Analysis of the Network with Respect to Cell Loss Rate and Traffic
Intensity at Buffer Capacity of 10
In this case, a comparison is done to ascertain the performance (utilization) of the network in terms of traffic drop when the network is loaded with the different traffic under consideration and the capacity of the buffer at the ATM access node kept constant at 10 (530Byte). Figure 7 shows the set of curve obtained. From the set of curves obtained, it is seem that there is a direct relationship between cell loss rate and traffic intensity for the different traffic sources under consideration as all curves follow almost the same pattern. Also from the set of curves as shown in Figure 7, it is also observed the homogeneous source experiences least traffic drop in the network as compared to other traffic types under consideration. This behavior is attributable to the fact that the network resource available is enough to accommodate this traffic type unlike the heterogeneous sources whose traffic combination makes it bursty and as such require more network resource in terms of buffer capacity to accommodate it and therefore reduce the traffic drop.
5. Conclusion
[image:7.595.147.479.87.233.2]0 0.1 0.2 0.3 0.4 0.5 0.6 0.7 0.8 0.9
0 5 10 15 20 25
ce
ll lo
ss
r
at
e
Buffer Capacity
PB(Homo)
PB(Hetr:D&V)
PB(Hetr:V,D&V)
Figure 6. Blocking Probability against Buffer Capacity for homogeneous and heterogeneous traffic sources at a traffic intensity of 2.80E05 cells/second.
0 0.1 0.2 0.3 0.4 0.5 0.6 0.7 0.8 0.9 1
0.00E+00 2.00E+05 4.00E+05 6.00E+05 8.00E+05 1.00E+06
Blo
ck
in
g P
ro
ba
bilit
y
Traffic Intensity(cells/second)
PB(Homo) PB(Hetro:D&V) PB(Hetro:D,V&VI)
Figure 7. Blocking Probability against Traffic Intensity at a Buffer Capacity of 10 (530 Byte) for homogeneous and heterogeneous traffic sources.
rogeneous source (i.e. data, voice and video) better utilizes the network resource as compared to the homogene-ous source when the network is loaded with traffic of varying intensity. The simulation also shows a better utili-zation of the available buffer capacity when the network is loaded with heterogeneous sources of varying band-width requirement. The result also shows that in order to maintain the QoS value of the different class of traffic that is accommodated by the network, a minimum buffer capacity of 10 is required to efficiently support trans-mission and reception of data across the various cell sites of the network. The result also shows that in order to cater for modern day real time service such as life streaming across the network, sufficient buffer capacity is re-quired at the access node to support heterogeneous sources as these classes of services are busty and delay sensi-tive.
Acknowledgements
Ajibo wishes to thank the University for the Privilege to embark on this research work especially the Depart-ment of Electronics Engineering. His appreciation also goes to his family the AJIBO’s for their spiritual and moral support.
Igboeli wishes to express his profound gratitude to Ministry of Foreign Affairs (Research Department) for sponsoring part of this research and also his family for their moral support.
[image:8.595.161.463.85.255.2] [image:8.595.160.474.292.449.2]References
[1] Kawarasaki, M. and Jabbari, B. (1991) B-ISDN Architecture and Protocol. IEEE Journal on Selected Areas in Com-munication, 9, 1405-1415.
[2] Pattavina, A. (1998) Switching Theory Architectures and Performance in Broadband ATM Networks. John Wiley & Sons Ltd., Hoboken.
[3] Jabbari, B. and Ycgcnoglu, F. (1992) An Efficient Method for Computing Cell Loss Probability for Heterogeneous Bursty Traffic in ATM Networks. International Journal of Digital and Analog Communication Systems, 5, 39-48. http://dx.doi.org/10.1002/dac.4510050105
[4] Ani, C.I. (1989) The Determination of the Blocking Probability of a Telecommunication Exchange(Station) in the De-veloping Countries. Proceedings of the International Conference on Developing Countries and the New Information Age, September 1989, 138-146.
[5] Ani, C.I., Fred, H. and Riaz, A. (1994) Methodology for Derivation of Network Resources to Support Video Related Service in ATM Based Private WAN. IEEE Proc-Communication, 142, 42.
[6] Ani, C.I. and Fred H. (1995) Simulation Technique for Evaluating Cell-Loss Rate in ATM Networks. SIMULATION,
64, 320-329. http://dx.doi.org/10.1177/003754979506400505
[7] Sykas, D., et al. (1993) Congestion Control—Effective Bandwidth Allocation in ATM Networks. High Performance Networking. IV (C-14), IFIP, Belgium, 65-80.
[8] Guerin, R., Ahmadi, H. and Naghshineh, M. (1991) Equivalent Capacity and Its Application to Bandwidth Allocation in High-Speed Networks. IEEE Journal on Selected Areas in Communications, 9, 968-981.
http://dx.doi.org/10.1109/49.103545
[9] Ani, C.I. (2004) Determination of Optimum Number of Trunk Line for Corporate Network Backbone in Nigeria. Nige-rian Journal of Technology, 23, 53.
![Figure 1. Enterprise-wide network Architecture [9].](https://thumb-us.123doks.com/thumbv2/123dok_us/8054300.774746/2.595.126.503.571.704/figure-enterprise-wide-network-architecture.webp)