An Approach to Enhance the Energy Efficiency of RFID
Protocol using NTP Protocol
Kiranpal Kaur
M.Tech CS&E Punjabi University Regional
Centre, Mohali, Punjab
Naveen Kumari
Assistant Professor CS&E Punjabi University Regional
Centre, Mohali, Punjab
ABSTRACT
A Wireless Sensor Networks (WSN) is a type of self organizing and self managing network which is not made of permanently of sensor nodes of the condition of not having internet infrastructure [6]. A wireless sensor network consists of a large number of nodes spread over a specific area where we want to look after at the changes going on there. A sensor node generally consists of sensors, actuators, memory, a processor and they do have communication ability. But this gives rise to many drastic changes to deal within the network topology such as updating the path, or the network tree etc.
The goal of this research paper is to collect the information about networking parameter, networking protocols, networking aspects and use them to improve the energy of RFID Protocol. This involves the study and evaluation of the existing energy efficient Active RFID Protocol on Wireless Sensor Network and identifies the vulnerabilities like packet collision. The analysis of the packet collision and to overcome this vulnerability for enhancing the energy of Active RFID Protocol using NTP (Network Timing Protocol) and to implement the proposed technique & compare it with the exiting technique.
Keywords
Wireless Sensor Network, RFID, NTP Protocol, MANET.
1.
INTRODUCTION
A Wireless Sensor Networks (WSN) is a type of self organizing and self managing network which is not made of permanently of sensor nodes of the condition of not having internet infrastructure [6]. A wireless sensor network consists of a large number of nodes spread over a specific area where we want to look after at the changes going on there. A sensor node generally consists of sensors, actuators, memory, a processor and they do have communication ability.
1.1
Adhoc Networks
1.1.1 MANET
1.1.2 Wireless Mesh Networks 1.1.3 Wireless Sensor Network 1.1.3.1 Underwater WSN 1.1.3.2 Underground WSN 1.1.3.3 Terrestrial WSN 1.1.3.4 Mobile WSN 1.1.3.5 Multimedia WSN
1.2
Characteristics of WSN
Small node size
Low node cost Scalability Reliability
Self–configurability Lower Power consumption Adaptability
Security
Channel utilization
1.3
Disadvantages of WSN
Retransmitting due to the packet collisions. Overhearing
Limited energy capacity
Massive and random node deployment Sensor locations
Data Aggregation Scalability
Limited Hardware resources
1.4
Architecture Components of WSN
Power management Sensing unit Processing unit Storage and timing sync Transceiver
Medium access
1.5
Applications of WSN
Environmental Monitoring Military applications Health care application Industrial process control
2.
DESIGN & IMPLEMENTATION
Many techniques are proposed for energy saving, Clustering is one of them. In this technique, the clusters are formed by clustering of the grouping nodes. The cluster heads are elected periodically such that members of a cluster can communicate with their cluster heads. These cluster heads send data received from its members to a base station. The multi clustering can also be used. The cluster head should have to be rotated for the balancing of energy and then there will be equal load on every node. The energy consumption can be reduced.
heads is fixed. The path cannot be changed until all the sensor nodes do not die means their battery goes to down. In this case some intermediate nodes will die earlier than other nodes. Then the path is break down between source and destination. Here due to path breakage the packet loss increases, the packet do not reach at the destination. Packet retransmission is also increases the whole network becomes useless. A new network is configured for complete the communication. To configure the new network again become the clusters and cluster heads it takes too much time and consume energy may be the network do not complete the communication. It is totally wastage of network resources like bandwidth, nodes battery, time, etc. figure 1 shows the network when intermediate nodes will die earlier than other nodes so it increases the packet loss and packet retransmission. In this figure all black nodes are the cluster heads of each cluster. Here S and D is source and destination nodes respectively. Between the source and destination a fixed path is established that is cluster 1 to cluster 2 to cluster 4. In this figure the data is transferred from source to cluster head of cluster1 and cluster head 1 forward the data to cluster head 2. Cluster head 2 forward the data to cluster head 4, now data goes to the intermediate node between the cluster head and the destination. The intermediate node sends the data to destination.
Fig 1: Simple network with pre-established path
[image:2.595.57.280.339.500.2]In figure 2 shows, that the cluster head 2 goes down, it cannot receive the data from cluster head 1 because its lifetime or battery is not more. Here the packets are losses and it does not reach to its destination because there is no other path is established between source and destination. In this network the further communication cannot take place. We have to need configure the new sensor network with full charged nodes so the communication takes place.
Fig 2: a network with die nodes and loss of packets
In the present work the sensor nodes are not synchronous to each other. The packet collision occurs due to the mismatch of timing. Again the packet loss and packets do not reach to their
[image:2.595.322.537.568.728.2]destination. Figure 3 shows the whole scenario of sensor network without synchronous of sensor nodes. In this figure here two nodes are the source and two destination, they followed the same path for data transfer. Cluster 1’s source send the data to cluster 4’s destination and cluster 3’s source send the data to cluster 2’s destination. Here the clock synchronous is not present between the sensor nodes. Cluster 1’s and cluster 2’s source send their data to their respective cluster heads. Now their cluster heads forward the data to next cluster head according to the routes. Here both sources have same route for transfer their data. When the data reaches to the cluster 2’s head from both sources at same time here data packets are collide to each other, the data packets are loosed and it do not reach to their respective destinations.
Fig 3: A network without synchronous nodes and packet collision
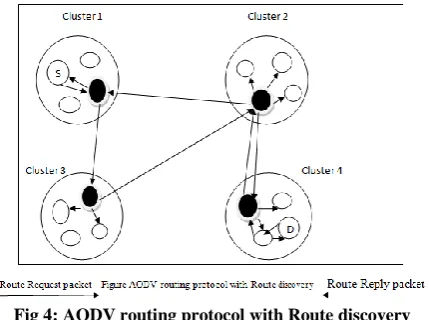
So we have to need a virtual path between the source and destination by using AODV. The sensor nodes should be synchronous to each other to avoid the packet collision by using NTP (Network Time Protocol).In the sensor network the path is established by AODV routing protocol between source and destination. The source node sends the information to the cluster head for their transmission to discover the route between sources to destination. Here the whole sensor network is divided into clusters. Figure 4.4 shows the working of ADOV. The cluster head broadcast the route request packet in whole sensor network. Route request packet contains the destination address. In the network those nodes have a route to destination node they reply back to the source node. In this a rout is discovered between the source node to destination is that cluster 1 to cluster 2 and cluster 4.
Fig 4: AODV routing protocol with Route discovery
[image:2.595.55.281.604.719.2]that path is followed by all the packets. In this approach that path is virtual path if any node is die then other route is chooses for further communication. In our proposed approach packet loss is less because of virtual paths. If packet loss is less then packet retransmission is also less. In this way network consume the less energy because path is not break again and again like pervious techniques here we use the dynamic paths.
[image:3.595.322.540.107.381.2]In the network all the sensor nodes and cluster heads are synchronous to each other by using the NTP. Figure 5 shows the synchronous process. All the sensor nodes match their time with master node which is already deployed in the sensor network. The master node is synchronized with GPS (Global Positioning System) and then master node send the information to all the cluster heads and cluster heads distribute this information to all cluster members. Now in the sensor network all the nodes are synchronized and slotted aloha is applied to the network. According to the slotted aloha which nodes want to transmit the data they reserve the time slots. All the nodes get the different slots and they transmit their data according to their turn. Here packet collision should be less and packet loss also less.
Fig 5: Node synchronous process
Node A, node B and node C they all want to transmit their data to their respective destinations. According to slotted aloha they all reserve their time for transmission. Fig 6 shows the channel reservation by slotted aloha. All the nodes sense the channel and reserve it for transmission. If the channel is free then the sensor node reserves it immediately. If channel is busy then nodes wait for channel free.
3.
WORKFLOW CHART OF DESIGN
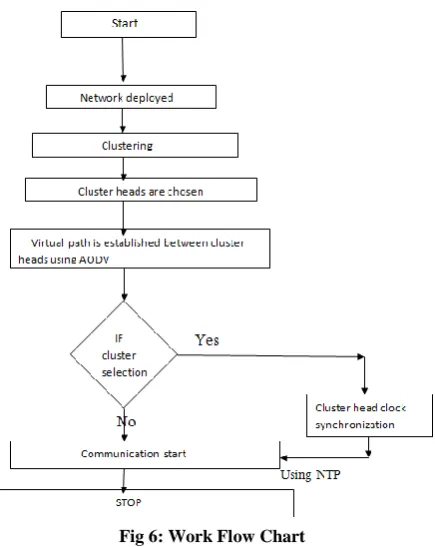
The flow chart of the proposed work is as given. First of all the sensor nodes are deployed in the fixed size area. Then the clustering of the sensor nodes is done. By using the bully algorithm the cluster head is selected means that node which has the highest energy that will be the cluster head. The virtual paths are selected between the cluster heads. The shortest path is selected by using the reactive AODV protocol. Here to avoid the collision the NTP protocol is used the clock is synchronized on each cluster head. RFID is used for the channel sensing to avoid the collisions. The master node synchronizes the clock through the GPS (Global Positioning System). The packet loss is avoided by using this technique.
4.
PERFORMANCE METRICS
Based on the selection of correct metrics in evaluating the performance of the WSN under different routing protocol. To compare the performance of RANO protocol of RFID and enhanced protocol of RFID, the metrics are packet collision, energy and throughput. Throughput is used to measure the data sent; energy is a measure of rate at which energy is used
[image:3.595.56.283.320.446.2]by the sensor nodes in a particular time period on the network; packets collision is a measure rate at which the total number of packets lost.
Fig 6: Work Flow Chart
Throughput: Throughput means number of data packets correctly received from source node to destination node. It is measured in bps and some time data may be measured in packets per second or per slot [7].
Energy consumed: Energy consumed is the measure of rate at which energy is used by the sensor nodes in a particular time. It is calculated as the total amount of energy consumed in a network over the number of nodes. Energy efficient communication is occurs with minimum possible consumption for each sensor nodes during packet transmission in network [7].
Packet Collision: Packet collision is the total number of lost of Packets during the transmission from source to destination. Packet collision reduce the overall network performance [7].
5.
IMPLEMENTATION
For the implementation of the protocol NS2 tool has been used. Set the simulation environment various scenarios are used as following below:
5.1
Simulation Environment
simulation trace file is created, and is used to plot graph and or to create animation.
[image:4.595.316.542.71.233.2]NS2 consists of two key language, C++ and Object- Oriented Tool Command Language (OTcL). The C++ defines the internal mechanism of the simulation objects, the OTcL sets up simulation by assembling and configuring the objects and scheduling discrete events. The OTcL are linked together using TclCL [24].
Fig 7: Architecture of NS2 [24]
NS2 is the simulation which provides us the animation and text based simulation. In this simulator, TCL and C++ are used for showing the simulation. The graphs are shown using XGraphs. Depending on user’s requirement the simulation are stored in trace files, which can be fed as input for analysis by different component:
A NAM trace file (.nam) is used for the ns animator to produce the simulated environment.
A trace file (.tr) is used to generate the graphical results with the help of a component.
5.2
Simulation Parameters
Table 1: Simulation Parameters
[1] Parameters [2] Values
[3] Simulator [4] NS2
[5] Protocol used [6] RANO,NTP
[7] Number of nodes in Scenario 1
[8] 20
[9] Number of nodes in Scenario 2
[10]20
[11]Simulation Area [12]800m*800m
[13]Maximum number of Packets
[14]50
5.3
Problem Implementation
5.3.1
Network Deployment
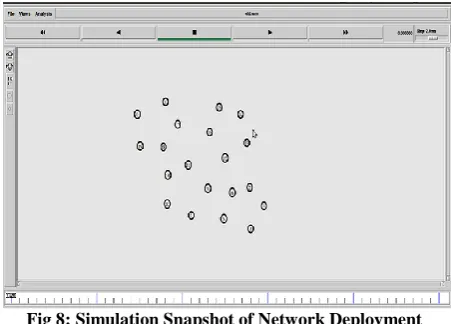
The network is deployed with the finite number of nodes. The deployed network contains the sensor nodes. The network is deployed at the far places. The sensor nodes having the capability to sense the environmental conditions. Each of the sensor nodes having the capability to communicate with every node and sink which further transmit the data through the internet. Each of sensor nodes contains the sensors which are used for sensing the weather conditions like temperature, pressure, moist etc.The heading for subsubsections should be in Times New Roman 11-point italic with initial letters capitalized and 6-points of white space above the subsubsection head.
Fig 8: Simulation Snapshot of Network Deployment
5.3.2
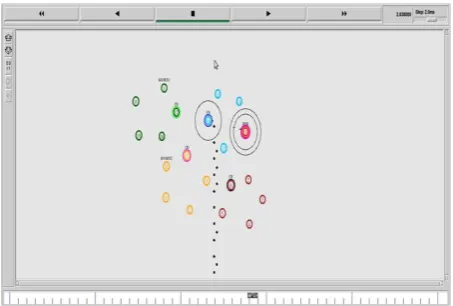
Election for cluster formation
[image:4.595.57.283.167.252.2]The whole network is divided into the fixed size of clusters. Every node exchanges its location with the corresponding node. These clusters have the capability to communicate with every cluster through single hope or multi hope communication. But to reduce the energy consumption the multi hope communication is used.
Fig 9: Simulation Snapshot of Election for cluster formation
5.3.3
Sink Deployment
[image:4.595.316.543.319.509.2]The sink is deployed in the network to get data from every cluster through the cluster heads. The sink is deployed in the network for broadcasting the sensed data to the internet.
[image:4.595.316.543.575.749.2]5.3.4
Cluster Formation
[image:5.595.317.543.72.231.2]The approach of location based clustering is followed and clusters are formed and clusters are formed in the network. Here every five nodes form the clusters and there are four clusters.
Fig 11: Simulation Snapshot for Cluster formation
5.3.5
Cluster Head selection
[image:5.595.315.544.78.456.2]When whole network is divided into fixed size clusters. The clusters heads are chosen, the cluster heads are elected on the basis of ID. Every node has equal battery when these are deployed. Every node presents its resources to its corresponding node, which are within the cluster. The cluster heads are selected to broadcast the data to sink to reduce the energy consumption.
Fig 12: Simulation Snapshot for cluster Head formation
5.3.6
Intercluster communication starts from
source 1
The communication is starts from the one cluster head to another cluster head. The fixed path is defined between the two cluster heads with using DSDV protocol. Cluster head is responsible for delivering the data to the destination. The source 1 sends the data to sink.
5.3.7
Intracluster communication starts from
source 2
[image:5.595.55.282.137.311.2]The communication starts from source 2 to another cluster head and is responsible for delivering the data to the sink. Here source 1 and source 2 are sending the data to the sink through the cluster heads.
Fig 13: Simulation Snapshot Intercluster communication from source 1
Fig 14: Simulation Snapshot for Intercluster communication from source 2
5.3.8
Collision of Packets
The fixed path creates the problem because there is possibility because there is possibility that two nodes have same path. The RFID is used for channel sensing. The clocks of the cluster heads are not synchronized due to this packet collision takes place and throughput of the network reduced and energy of the network consumption increases and overall network life time reduces.
[image:5.595.55.283.417.583.2] [image:5.595.317.544.559.712.2]5.4
Solution Implementation
5.4.1
Network deployment
[image:6.595.315.543.68.411.2]The network is deployed with the finite number of sensor nodes and sensor nodes responsible for sensing the environment conditions like pressure, temperature; moist etc. sensor node contains the sensors inside it which senses the environmental conditions. This is then converted into electrical signals and then the processing takes place and the data is then sending to the sink.
Fig 16: Simulation Snapshot for Network Deployment
5.4.2
Election for cluster
[image:6.595.55.282.180.320.2]Network is divided into the fixed size clusters using the location based clustering. These clusters are selected to send the data further to the sink. The clustering is a better technique to reduce the energy consumption of the sensor nodes. The multi hope clustering is mostly used in sensor networks.
Fig 17: Simulation Snapshot of election of cluster formation
5.4.3
Master node deployed
The master node is deployed in the network and master node synchronizes its clock using Global Positioning System (GPS). The clustering process continues. The master node synchronizes the network. It does not take part in the communication purposes. The entire network synchronizes according to the master node.
5.4.4
Cluster formation
The network is divided into fixed size clusters and master node synchronizes its clock using global positioning system (GPS). The clusters are formed in the hexagonal shape because this covers the network more appropriately. There are four clusters and every cluster have the five nodes in the hexagonal shape.
Fig 18: Simulation Snapshot of Master Node deployment
Fig 19: Simulation Snapshot for cluster formation
5.4.5
Election for cluster head
[image:6.595.55.281.412.554.2]The cluster heads are formed in each cluster. The cluster heads are formed with election algorithm. Every node is presents its resources to its corresponding nodes. The nodes which are having higher number of resources is selected as cluster head. The cluster head is elected on the basis of election algorithm (bully algorithm). It means that the node which is having the more battery is elected as a cluster head. If node is having more battery power then there are lesser chances of the change in network topology and the number of election procedures can also be reduced and the battery consumption is also reduced.
[image:6.595.317.543.556.727.2]5.4.6
Synchronization of CH with master node
[image:7.595.316.543.82.299.2]Cluster head in each cluster synchronizing its clock with the master node. The master node synchronizes its clock according to the Global Positioning System (GPS).
Fig 21: Simulation Snapshot for synchronization of cluster head with master node
5.4.7
Virtual Path Establishment
The virtual path is established between source and sink through cluster heads. The reactive routing protocol AODV is used for path establishment. The source node sends route request packets to the cluster heads. The cluster heads which is having path to destination will reply back with the route reply packets.
Fig 22: Simulation Snapshot for Virtual path establish
5.4.8
Intracluster communication
When the path is established between source and destination. The communication starts. The communication starts from source 1 to another cluster head. Also the communication starts from the source 2 towards the cluster head. And the network is synchronized according to the master node. Now there is no collision between the nodes.
5.4.9
Channel sensing
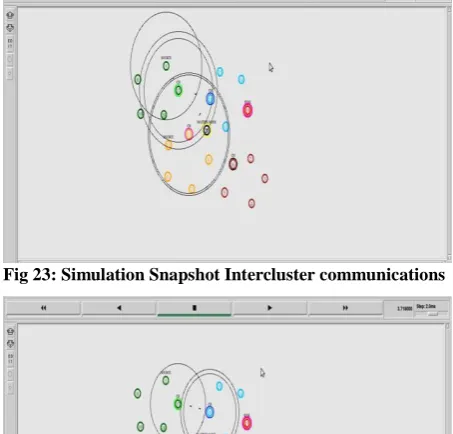
[image:7.595.54.281.127.283.2]RFID protocol is used for channel sensing and efficiency of the slotted ALOHA increases when cluster heads clocks are timely synchronized. By using the master node which is using the network time protocol (NTP). And the efficiency of the network increases. If there is no collision between the packets, then there is no need to transmit the packets again. The most of the energy consumed in the communication. If the communication reduced to again transmit the packets then the battery consumption of the nodes can also be reduced. Hence there is a less energy consumption.
Fig 23: Simulation Snapshot Intercluster communications
Fig 24: Simulation Snapshot for Channel sensing
6.
RESULTS & ANALYSIS
The following three graphs can show the improvement in the performance with the graphs of three parameter.
[image:7.595.315.543.181.387.2]1.) According to the energy graph at the X-AXIS show the time per second and the y-AXIS shows the energy in joule. Thus, energy is improved in comparison to the old one. (Fig.25)
Fig 25: compared new energy graph with old energy graph
[image:7.595.55.281.399.551.2] [image:7.595.316.545.468.672.2]Fig 26: compared old packet loss with new packet loss graph
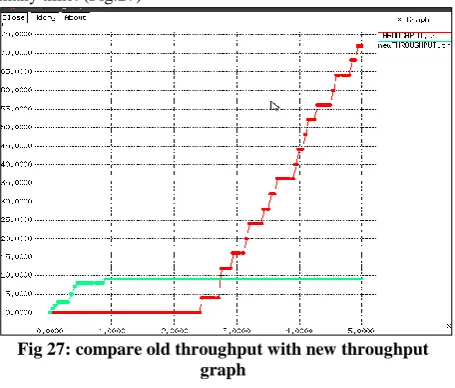
3.) According to the packet loss graph x-axis shows the time per second and y-axis show the no. of packets loss in per second. The packet loss degrade the network overall performance in our result improve the overall performance in many time. (Fig.27)
Fig 27: compare old throughput with new throughput graph
7.
CONCLUSION
The efficiency of the network increases as compared with the old system. The maximum quantity of the energy consumed is in the communication. If the communication reduced to again transmit the packets then the battery consumption of the nodes can also be reduced. Hence there is a less energy consumption.
8.
REFERENCES
[1] Akyildiz Ian F., Chowdhury Kaushik R., MelodiaTommaso,”A survey on wireless multimedia sensor networks”, Elsevier B.V Science Direct, 2005.
[2] Akyildiz Ian F, Pompili, Dario, Melodia Tommaso,” Underwater acoustic sensor networks: research challenges”, Elsevier B.V Science Direct, 2005.
[3] Amundson Isaac, “A Survey on Localization for Mobile Wireless Sensor Networks”, Springer, 2009.
[4] Atero F.J et.al. ”A Low Energy and Adaptive Architecture for Efficient Routing and Robust Mobility and Management in Wireless Sensor Networks”, IEEE, 2011.
[5] Bu Kai, Chen Shigang et.al. “Efficient Pinpointing of Misplaced Tags in Large RFID Systems” IEEE, 2011
[6] Bin-fang Cao, Jian-qi Li, Li Wang, “Energy Optimized Approach Based on Clustering Routing Protocol for Wireless Sensor Networks”, IEEE, 2013.
[7] Chabalala S.C.,Muddenahalli T.N. and Takawira F.,”Energy efficient dynamic source routing protocol for wireless sensor networks,”IJCSNS International Journal of Computer Science and Network Security,vol.12,pp.98-109,Oct.2012
[8] Chauhan Naveen, Pant Sudhanshu and Prashant Kumar “Effective Cache based Policies in Wireless Sensor Networks”, ACM, vol.11, no.10, Dec.2010.
[9] CHEN Yu-Ping, WU Quincy “Power Consumption Measurement and Clock Synchronization on Low-Power Wireless Sensor Networks”, pp.406-409, Feb.2012.
[10] Dargie, W. and Poellabauer, C., “Fundamentals of Wireless Sensor Networks: Theory and Practice”, A John Wily and Sons, Ltd., Publication ,2010,pp.7-8.
[11] DENG Huifang ,WANG Tingting “Time Synchronized High Performing Cluster-Based Routing Algorithm for Wireless Sensor Networks” IMBR,vol.5, Nov.2013.
[12] Dong, Xin and Vuran, Mehmet C., "A Channel Model for Wireless Underground Sensor Networks Using Lateral Waves" (2011). CSE Conference and Workshop Papers.
[13] Gouvy Nicolas, Hamouda Essia, Mitton Nathalie and Zorbas Dimitrios “Energy Efficient Multi-Flow Routing in Mobile Sensor Networks”, IEEE, pp.3710-3715, 2013.
[14] Guo Shuxiang and Wang Yu “Optimized Energy-Latency Cooperative Transmission in Duty-Cycled Wireless Sensor Networks”, IEEE, pp.371, Aug.2013.
[15] Ismail Mahamod and Haron Ahmad Razani “Energy Consumption and Lifetime Analysis for Heterogeneous Wireless Sensor Networks”, IEEE Tencon-Spring, 2013.
[16] Kim Dong-Hyun, Kim Jong-Deok and Lee Chae-Seok “An Energy Efficient Active RFID Protocol to Avoid Overhearing Problem”, IEEE, vol.14,pp 15-24, Jan.2014.
[17] Li Guang et.al.”An Energy-Balanced Routing Method Based on Forward-Aware Factor for Wireless Sensor Networks”, IEEE, vol.10, no.1, pp.766-773, 2014.
[18] Lo Nai-wei Li Yingjiu et.al. “A Novel RFID Tag Identification Protocol: Adaptive n-Resolution and k-Collision Arbitration “Springer, Feb .2014.
[19] Mamalis Basilis et.al. “Clustering in Wireless Sensor Networks” RFID and Sensor Networks, Jun.2009.
[20] Raj Deni Ebin” An Efficient Cluster Head Selection Algorithm for Wireless Sensor Networks – Edrleach”,IOSRJCE,vol. 2,pp.39-44,Jul.-Aug.2012.
[21] Ramasubramanian Srinivasan, Krunz Marwan and Younis Ossama “Node Clustering in Wireless Sensor Networks: Recent Developments and Development Challenges”, IEEE, vol.20, Issue 3, pp.20-25, 2006.
[22] S Diwakaran “Energy Efficient Scheduling in Wireless Sensor Networks”, IJSER,vol.2,pp.2347-3878,Jan.2014
[23] Shah.T, N.Javaid, Qureshi.T.N “Energy Efficient Sleep Awake Aware (EESAA) Intelligent Sensor Network Routing Protocol “, IEEE, pp.1-6,2012
[image:8.595.55.283.298.492.2][25] Stuntebeck Erich P. and Tassiulas T.,”Optimal Deployment of large Wireless Sensor Networks”,IEEE Transactions on Information Theory, p935-2953,Ju.2006.
[26] Taheri Hoda, Naghibzadeh Mahmoud and Neamatollahi Peyman, “A Hybrid Clustering Approach for Prolonging in Wireless Sensor Networks”, IEEE, pp.172, Feb.2011.
[27] Vhatkar Sangeeta and Atique Mohd.,” Design Issues, Characteristics and Challenges in Routing Protocols for Wireless Sensor Networks”, IJCA ,pp.0975-8887,2013.
[28] Vinay Kumar et.al.” “Energy Efficient Clustering Algorithms in Wireless Sensor Networks: A Survey”, IJCSI,vol.8pp.259-268,Sep.2011.