Munich Personal RePEc Archive
Analyzing Washington state’s welfare
program design, workfirst
Axelsen, Dan and Snarr, Hal W.
North Carolina AT State University
2006
Online at
https://mpra.ub.uni-muenchen.de/37248/
Analyzing Washington State's Welfare Program Design, WorkFirst
Dan Axelsen
ERS Group 850-562-1211
Hal W. Snarr
Department of Economics and Transportation/Logistics School of Business and Economics
North Carolina State A & T 336-334-7744
JANUARY 2006
ABSTRACT Much debate in the early nineties centered on whether the federal entitlement program Aid for Families with Dependent Children (AFDC) reduced welfare dependency. Many contend that AFDC discouraged work, increased welfare dependency, and undermined the institution of family. Partly in response to these criticisms, welfare was reformed through the Personal Responsibility and Work Reconciliation Act (PRWORA) in 1996. PRWORA modified the primary objectives of welfare by placing more emphasis on work experience accumulation and less on human capital accumulation. Temporary Assistance for Needy Families (TANF) was
designed to meet this primary objective. Washington State’s TANF program,
WorkFirst, utilizes a progressive system of programs (components) aimed at reducing welfare dependency through labor force participation. WorkFirst components have a variety of objectives including skills training, temporary subsidized employment, and
mentoring. WorkFirst’s objective is to accumulate work experience of welfare
INTRODUCTION1
On July 1, 1997 the Temporary Assistance for Needy Families (TANF) program
replaced the federal entitlement program, Aid for Families with Dependent Children
(AFDC) in Washington State. TANF provides temporary cash assistance and job
training to low-income families with dependent children. Each State is allowed to
tailor their welfare program design to the specific needs of their clients. In August
1997, the State of Washington created WorkFirst as its welfare program designed
under TANF. The WorkFirst design discourages welfare dependency through the
promotion of labor force participation and sanctions for non-compliance. Programs
(components) under WorkFirst provide individuals with mentors, educational
opportunities, and paid work experience. The underlying premise of WorkFirst is that
work experience accumulation places upward pressure on wage rates. Components
within WorkFirst promote work experience and skill building, and through the
completion of cumulative stages within WorkFirst welfare recipients become less
welfare dependent, and in many instances self-sufficient.
Washington State’s WorkFirst program is not an entitlement; it provides
temporary cash assistance, job training, and work experience to welfare recipients.
Recipients are allowed a maximum of 60 months of lifetime cash assistance, with at
most 24 consecutive months of assistance. Recipients must work or search for
employment to receive cash assistance.2 Unsuccessful individuals not finding
employment but making an effort according to WorkFirst guidelines can qualify for
1
We would like to thank the two anonymous reviewers for their helpful and insightful comments with regard to this manuscript. Their comments greatly improved our paper.
2
extensions. Because physically or mentally disabled individuals cannot participate in
WorkFirst, they will continue to receive welfare assistance.3
WorkFirst is a comprehensive and progressive welfare-to-work program that
utilizes many components consisting of over 30 different employment induced
welfare programs. For the purposes of this paper, we will study the effects of only
five of these WorkFirst components. They include Job Success Coach Initiative
(JSCI), WorkFirst Post-employment Labor Exchange (WPLEX), Job Components
(JC), Pre-Employment Training (PET), and Community Jobs (CJ). We chose these
components because they are employment training, counseling and guidance
programs. All five components are different in their nature and each attracts a
different clientele. They are also progressive and attract the most political attention.4
Clients with very poor job skills often enter the WorkFirst program by enrolling
in CJ, PET or JC. The CJ program is a community-based work and skill-building
experience for heads of households receiving TANF benefits. The CJ program
provides participants with valuable work experience and skills training. CJ benefits
both the individual and local communities, often leading to a permanent job and job
retention while meeting WorkFirst participation requirements “to work, look for work
or prepare for work.” Recipients that secure jobs under CJ are only temporarily
employed, most typically for six months. PET is a program designed to assist
individuals with additional education. The majority of PET individuals are enrolled
in a Microsoft funded community college program focused on the acquisition of
3
computer skills. The JC program is a series of classes offered by the state. These
classes teach participants how to act professional, look for work, and interview for
jobs.
The JSCI and WPLEX programs tend to attract stronger clients whom are
typically in the final stages of the WorkFirst program. The JSCI program assigns a
job coach to each enrollee. The job coach guides individuals in their job search
journey by offering advice and counseling. After clients have obtained employment
they receive additional counseling from WPLEX call center associates. After
enrollees enter the work force, the WPLEX program can assist them in finding better
jobs as their job-skills improve and work experience increases.
WorkFirst is a progressive welfare-to-work design because clients typically start
in JC, CJ or PET. After completion of any of these preliminary components, clients
enroll in JSCI or WPLEX.
LITERATURE REVIEW
Much experimental design was conducted in the early 1990's as an application of
welfare reform. Waiver programs allowed states to experiment with alternatives to
the traditional AFDC design.5 Many of these waiver programs resemble TANF,
focusing on strong work requirements through job search, therefore the waiver period
can be thought of as a foundation for understanding how to model TANF correctly.
The waiver period and the research associated with this period directly evaluate
4
A majority of the Washington State sponsored welfare studies focus their attention on the
performance of JSCI, WPLEX, JC, PET, and CJ components, which determines how TANF funds are allocated.
5
different program designs, unified by the imposition of strong work requirements.
Friedlander and Hamilton (1996) examined an experimental welfare model that
would eventually mimic TANF by testing whether imposing an obligation to work,
and the implementation of these policies that lead to work, actually increase
employment levels which in turn should reduce welfare dependency. The
experimental data and design used by Friedlander and Hamilton (1996) is known as
the Saturation Work Initiative Model (SWIM). From 1985 to 1987 the county of San
Diego initiated the SWIM welfare design, which took a cohort of people currently
enrolled in AFDC and placed them in work assignments and other types of
employment-directed programs. Results show 75 percent of those who participated in
SWIM were employed compared to 68 percent for the control group, a difference
statistically significant at the 5 percent level. Friedlander and Hamilton (1996)
successfully find that the SWIM model reduces welfare dependency more than the
existing AFDC design. However, the authors' do not conclude that the waiver
program is a successful overall welfare design, it is only marginally better than
AFDC.
Bloom and Michalopoulos (2001), Fein et al. (2001) and O’Neill and Hill (2001)
all look at the effect that similar waiver programs have had on employment, program
participation, and wages. Each of these papers found waivers to have positive effects
on employment and wages. In contrast, O’Neill and Hill, Bloom and Michalopoulos,
and Fein et al. are all similar in that they find a negative effect on AFDC
participation. They suggest that the effects on wages and employment are due to the
results are found by Bartik and Eberts (1999); Blank (2000); Figlio and Ziliak (1999);
Wallace and Blank (1999); and Ziliak, Figlio, Davis, and Connelly (2000). Each of
these authors' fails to determine whether each program design works as it is intended.
One issue with studying waiver programs is that only short-term effects of
program reform are considered. Friedlander, Greenberg, and Robins (1997) evaluate
the long-term aspects of government programs for the disadvantaged. Since welfare’s
initial inception in 1935, they find no support for positive long-term effects on
employment, wages, poverty, income inequality, and welfare participation. Although
most evaluations of the welfare population conclude that there are positive,
significant effects of training programs in the short-run, they find that there is no
evidence to support this claim over the longer-term. One explanation is the skills
learned by participants are not valued by employers over the long-term. They should
evaluate such a claim given the overall shape of the particular labor market for which
their sample resides.
Supply controls typically include recipients’ marital status, age, race, education,
recent work experience, and welfare history. Surveys are the most common method
for collecting labor supply data. The most commonly used surveys include the
Survey of Income and Program Participation (SIPP), the Panel Study on Income
Dynamics (PSID), the National Longitudinal Survey of Youth (NLSY) and
Longitudinal Database of Cases (LDB).6
6
Hoynes (2000) incorporated panel data from a subset of the LBD survey to
estimate the probability of exits, returns and duration with respect to labor supply and
demand variables using a discrete time hazard model. She found that labor market
conditions significantly determined exits, returns and duration between 1987 and
1992. That is, welfare recipients are more likely to exit welfare and less likely to
return when they are earning more. Additionally, she found that the market wage was
a strong determinate of welfare dependency.
Harris (1993) uses a panel of data, from the PSID survey, to evaluate single
mothers enrolled on AFDC from 1984 to 1986. She finds that the guarantee level is
insignificant, and that a mother enrolled on AFDC exits approximately 67 percent of
the time because of an employment opportunity.7 Harris (1996) follows up her own
work by looking at a longer panel from the same survey to estimate the probability of
single mothers re-entering AFDC once they have exited. Once again, Harris finds the
guarantee to be insignificant and, in general, claims that analyzing welfare is not
always about the recipient weighing the costs and benefits of exiting and then
returning. More important factors are those such as age, number of children,
education and marriage. These factors significantly influence repeat dependency.
The choice to exit and not return is mostly a function of the single mother’s need for
dependency and the existing social context she lives in. Women receiving welfare
assistance are less likely to exit if they are single, have more dependents, older and
less educated.
7
In a preliminary study using data from the Washington State Population Survey,
Learch, Mayfield, and Burley (1999) found that Washington State females who
participated in WorkFirst job search programs had 12 to 27 percent higher
employment rates, earned approximately $213 more per month, and had between 14
and 20 percent less welfare enrollment than clients not participating. They used client
characteristics as labor supply controls. Labor demand controls included local
economic variables and local welfare office administrative practices. Their results
were admittedly preliminary and required verification. We hope to verify these
results using administrative records, and more importantly, we intend to analyze the
WorkFirst design in the manner for which it is designed.
Supply side factors tend to be significant predictors of welfare dependency
participation, and so they should be included in any empirical specification.
However, generally speaking, demand side factors only generate statistically
significant coefficients in studies using panels over long periods of time. Because our
time horizon is so short, we do not include demand side factors in this analysis that
are aggregated at the state or local level.
The goals of the above studies are only partially relevant to our work. However,
our methodology is consistent with past methodologies. Typical methodologies
analyze the work-decision with a binary dependent variable (probit and logit models).
The use of a dichotomous variable captures whether or not recipients are working.
Any model using this feature has the ability to predict labor force participation on a
vector of independent variables. These types of models are also capable of evaluating
Many current welfare designs have a progressive, cumulative nature to them. By
modeling progression one can partially determine how well a program is designed in
terms of effectiveness in reducing welfare dependency. To do this, one must be able
to collect supply side data specific to individuals receiving welfare benefits and their
component participation choices. To categorize the sample in this manor, one must
have access to administrative records. Individuals entering WorkFirst progress
through different components of the program until they are ready to exit and enter the
work force. Participants that do not complete the series of components should be
more dependent on welfare and less likely to enter the labor force. The literature has
not yet captured this progressive analysis.
DATA SET
Most welfare studies use survey data. We use Washington State Administrative
records for our analysis. We have merged wage data from Unemployment Insurance
(UI) wage files with WorkFirst welfare data from the JOBS Automation System
(JAS) of the Employment Security Department (ESD).8 The merged data produces a
panel data set, consisting of both cross-sectional and time-series elements specific to
individuals enrolled in WorkFirst. Furthermore, this panel provides us the ability to
capture both the working decision and welfare enrollment decision of each individual
recipient over time.9 We end up with a cross-section of welfare recipients between
2000 and 2001.
8
Each employer in the state of Washington reports earnings for each of their employees on a quarterly basis to the Washington State Employment Security Department. All data are provided for by Labor Market and Economic Activity (LMEA). LMEA is a subsidiary of the Employment Security Department in Washington State (ESD). In Washington State the ESD has multiple objectives, some of which include the evaluation of Unemployment Insurance (UI) and WorkFirst in Washington State.
9
The WorkFirst design can only be analyzed by using administrative records.
Surveys offer information about the aggregate welfare population and are often
inaccurate due to survey approaches. By using individual welfare and wage data we
can track individual decision making over time. Specifically, we can track which
WorkFirst components individuals have enrolled in, which component they started in,
when they finished each component, and how they are doing in the labor force after
exiting each component. The merged data we have been able to collect allows us to
evaluate what no other study has been able to, namely, measure the effectiveness of
the WorkFirst design.
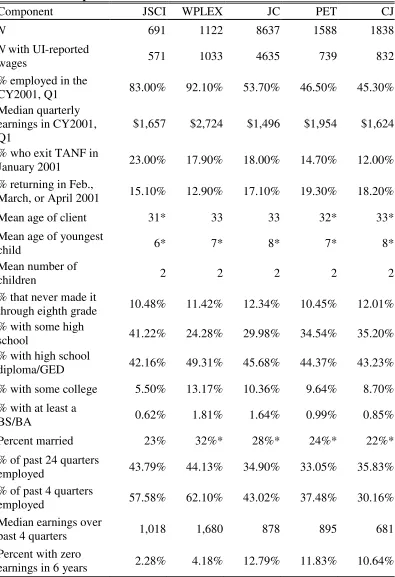
Table 1 provides various descriptive statistics of explanatory factors for the entire
sample. Of the five WorkFirst components, WPLEX generated the highest median
earnings and employment rates while having the lowest percentage of reentry into
WorkFirst; $2,742 per quarter, 92.1 percent, and 12.9 percent respectively. JSCI has
the highest exit percentage at 23 percent. JC, PET, and CJ appear to be the least
successful of the WorkFirst components. For example, after completing CJ only 45.3
percent were employed, only 12 percent exited, and median earnings were a meager
$1,624 per quarter. Demographically, the components appear very similar; marriage
percentages, education levels, mean age of youngest child, and number of children
residing in the welfare recipients household are similar across components. However,
work experience is very different across components. Individuals enrolled in
WPLEX and JSCI have more work experience than those in JC, PET, and CJ. Even
though the performance of these later programs appears to be disappointing, they are
prepared for work. Individuals that are less prepared for the work force are
encouraged to first enter JC, PET, and CJ.
We speculate that upon completion of these initial components, individuals are
more likely to succeed in WorkFirst’s terminal components, WPLEX and JSCI. It is
evident from Table 1 that enrollees who successfully progress through WorkFirst
components are better suited for the work force. That is, the likelihood an enrollee
finds a job and exits welfare is higher than that of an individual who bypasses one or
more of the initial components of WorkFirst. Those enrolled in the later stage
components seem to be descriptively more successful than those enrolled in the initial
stages of the WorkFirst design.
METHOD OF ANALYSIS
To model the Washington State welfare recipient welfare-to-work choice we utilize a
discrete dependent variable similar to that of Nakosteen and Zimmer (1980). We will
let w
i
U represent welfare recipient i’s utility of remaining on welfare while Uie will
denote i’s utility of exiting welfare given they are employed. If Xi is a set of
individual characteristics unique to recipient i, then the corresponding linear random
utility model has the form
w
i w i w
U β X and Uie β Xe i e (1)
Utility for each choice is unobservable. However, the choice made by recipient i
reveals which choice provides greater utility. If we define Wi to be the observable
i
W will be assigned the value zero. If we let F represent the cumulative normal
distribution function, β βe βw, and e w, then the probability that Wi equals
one is10
i 1 i
i i 0P W X F β X
provided that the disturbances of system (1) are normally distributed.
The probit model will allow us to determine how effective WPLEX, JSCI, PET,
CJ, and JC are at assisting WorkFirst participants in exiting welfare given the
employment choice, as measured by our dependent variable which represents an
individual who has exited welfare and is employed, W = 1. To do this, we compare
an unrestricted model with six restricted models. Each regression model will include
the following set of individual characteristics: work experience (past 6 years), work
experience (past year), education level, number of children, age of client, age of
youngest child, and wages.
We use component identifiers to flag those enrolled in each of the included
components: WPLEX, JSCI, PET, CJ, and JC. If a client is enrolled in the jth
component, then the corresponding component identifier,D j, will be assigned a one,
10
The probability of W = 1 is
1 0 0 0 e w
e e w w
e w e w
P W P U U
P P P F X
β X β X X
β X β X X
β X X
β X
zero otherwise. The unrestricted model’s independent variables will include the
entire set of WorkFirst participation identifiers,
, , , ,
U DW P L E X DJ S C I DP E T DC J DJ C
D .
For testing the direct effect of each component we specify five restricted models that
remove a corresponding component identifier. For instance, when measuring CJ's
effect on being employed and exiting welfare the component identifier matrix
becomes
, , ,
C J DW P L E X DJ S C I DP E T DJ C
D .
The sixth restricted model includes no component identifiers. The empirical model
specification is
; ,
m
W f t d t
β X δ D , (2)where the subscript m on D identifies the specification of the model as either the
unrestricted (U) or one of the restricted models: WPLEX, JSCI, PET, CJ, or JC.
A likelihood ratio test (LR) will be used to compare the unrestricted model with
the six restricted models.11 The likelihood ratio test determines whether each j
coefficient corresponding to each component identifier is significantly different from
the unrestricted model. A significant chi-square value implies that the component in
question is a significant predictor of employment and welfare exits, relative to all
11
The likelihood ratio statistic is L R 2 ln( LˆR ln LˆU), where ˆ R
L and lnLˆU are the log-likelihood
functions evaluated at the restricted and unrestricted estimates, respectively (Greene, 2000 pp. 826). For the unrestricted model, SAS reported 2 ln LˆU = 7668.53. The unrestricted model included all of
the explanatory and indicator variables. The values of 2 ln LˆR for the restricted models ranged from
other components. If the restricted model that excludes all dummy variables is
significant, the five components are more likely to create employment and reduce
welfare dependency than all other WorkFirst components not included in our study.
This test will determine the total effect of WorkFirst on employment and welfare
exits. The results of the other five restricted models determine if an individual
WorkFirst component is a significant predictor by itself, a direct test of the individual
effect of each WorkFirst component.
We would also like to predict how welfare recipient quarterly earnings, Y, are
impacted by their participation in WPLEX, JSCI, PET, CJ, and JC. To do this, we
will estimate the parameters of
i i i i
Y θ X φ D (3)
using ordinary least squares (OLS). Equation (3) will determine which predictors
have a significant relationship with earnings, and whether or not the relationship is
positive or negative. Each component identifier will determine how expected
earnings are affected by the participation in each of the five WorkFirst components.
The intercept coefficient includes all other individuals in the caseload but not enrolled
in one of the five components. We simultaneously control for demographics and
prior work experience with the inclusion of Xi.
RESULTS
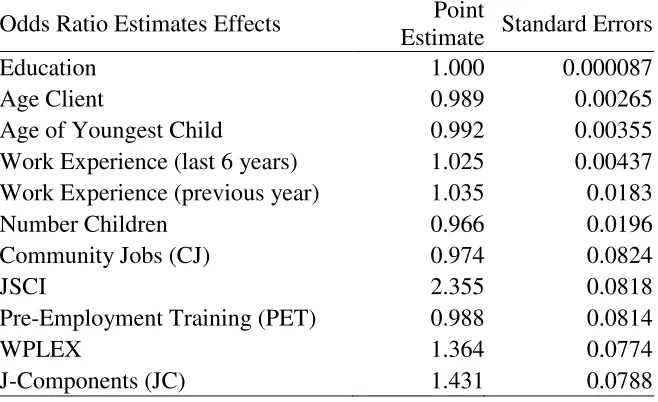
The results of the nonlinear estimation of equation (2) are reported in Table 2
below. Odds ratios and their corresponding standard errors for each of the predictors
in the unrestricted binary choice probit model are included in this table. Results show
highest odds ratios (each is greater than zero). The WPLEX odds ratio is 1.364
suggesting individuals enrolled in WPLEX are 1.364 times more likely to be
employed and have exited welfare than those recipients not enrolled in WPLEX. The
JSCI odds ratio is even greater at 2.355. Those who have successfully exited JSCI
are 2.355 times more likely to be employed and off of welfare than those not
completing JSCI during the same period. The JC component also has significant
positive effects on employment and welfare exits.
Pre-employment training and community jobs enrollment and completion is
actually less likely to yield employment and a welfare exit (0.988 and 0.974).
Education and work experience enhance the enrollee’s likelihood of finding work and
exiting welfare; while the number of children, age of youngest child, and age of client
appear to have very little effect. The older the client or the more children the client
has, decrease the chances of employment and exiting welfare. Clients that have
younger children are less likely to be employed and more likely to exit welfare. This
is a general conclusion not necessarily related to a particular component.
The likelihood ratio test statistics comparing the unrestricted probit model with
our six restricted models are reported in Table 3 below. The first row of Table 3
corresponds to the restricted regression that excludes all component identifiers, while
the other five rows correspond to the remaining five restricted regressions. Notice
that the test statistic associated with row 1 is 122.18. This implies that the programs
we chose to include in this study (WPLEX, JSCI, PET, CJ, and JC) significantly
improve a WorkFirst client’s likelihood of being employed and exiting welfare. Each
effects on employment and welfare exits relative to competing programs. Our results
suggest JSCI, WPLEX, and JC all significantly increase the likelihood of finding
work and exiting welfare, while pre-employment training and community jobs do not.
Thus, individuals enrolled in WorkFirst’s initial components are not as prepared to
exit welfare as their counterparts in the terminal components, and so should remain in
the program until the terminal components are completed.
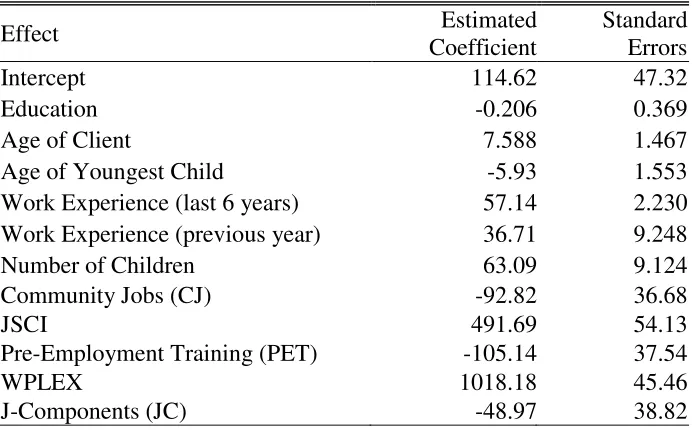
The results of the empirical estimation of equation (3) are reported in Table 4
below. Equation (3) predicts a welfare recipient’s expected quarterly earnings, Y,
given the individual’s characteristics and participation in WPLEX, JSCI, PET, CJ, or
JC. Work experience, JSCI, and WPLEX significantly increase earnings, on average.
For instance, if a participant in WorkFirst is enrolled in WPLEX, her earnings will
increase, on average, by $1,018.18 per quarter after completion. Likewise, if an
individual is enrolled in JSCI, her earnings will increase by an average of $491.69 per
quarter. The Community Jobs, Pre-Employment Training, and J-Components
programs appear to have negative effects on quarterly earnings; these programs
reduce earnings by $92.82, $105.14, and $48.97 respectively. The intercept term
represents all other programs in the WorkFirst caseload. Therefore, all other
components within the WorkFirst program increase earnings, on average, by $114.62.
Age, work experience, and number of children are positively correlated with earnings,
each is significant. Age of youngest child has a negative correlation with earnings.
Education is not a significant predictor of earnings, and therefore has no relationship
college degrees, and a college degree is the only degree that could really differentiate
earnings between these individuals.
Those who have completed later stage components have a higher probability of
working and exiting welfare at higher wages (JSCI and WPLEX). Those who
complete initial stage components are less likely to find work, exit welfare, and earn
lower wages than those completing later stage components (CJ, PET, and JC).
WorkFirst, by design, encourages individuals to initially enroll in initial stage
components such as CJ, PET, or JC. After completing these initial components, the
welfare recipient is then ready to look for work and enrolls in JSCI or WPLEX.
Those welfare recipients who progress through the WorkFirst design face better odds
of exiting the welfare rolls through employment and earn higher wages than those
who do not.
CONCLUSIONS AND POLICY RECOMMENDATIONS
Our results show that WPLEX and JSCI are stronger predictors of employment, while
completion reduces welfare dependency; both programs increase wages significantly.
On the other hand, the pre-employment training and community jobs components are
not strong predictors of employment and do not significantly reduce welfare
dependency. CJ and PET actually decrease earnings on average. This can be
explained in several ways. First, people that are enrolled in WPLEX and JSCI tend to
have more work experience, are younger, and have fewer children on average;
demographics of this group are more favorable. Secondly, these enrollees may have
already been through at least one of the other WorkFirst programs, for instance,
and job training before being enrolled in WPLEX or JSCI. The WorkFirst design is
intended to build work experience and skills through completion of several
components, or stages.
This analysis has showed several things, and has also left several questions
unanswered. WPLEX and JSCI are more effective, on average, than all other
WorkFirst programs at increasing the likelihood of employment and exiting welfare.
However, those enrolled in WPLEX or JSCI could be better prepared for the job
market than those enrolled in CJ, PET, and JC. Whether this is due to the design of
WorkFirst or attributed to the demographics and personal characteristics of each
individual is ambiguous. However, overall, if the welfare recipient does progress
through the various stages, components, they are more likely to be employed and exit
welfare.
REFERENCES
Bartik, T. and R. Eberts (1999) “Examining the Effect of Industry Trends and
Structure on Welfare Caseloads,” Economic Conditions and Welfare Reform, Edited by S. Danziger, Upjohn Institute for Employment Research, Kalamazoo, MI, pp. 119-57.
Blank, R. M. (2000) “What Causes Public Assistance Caseloads to Grow?” Journal of Human Resources 36: 85-118.
Bloom, D. and C. Michalopoulos (2001) “How Welfare and Work Policies Affect
Employment and Income: A Synthesis of Research,” New York: Manpower Demonstration Research Corporation.
Fein, D., D. Long, J. Behrens, and W. Lee (2001) “The ABC Evaluation: Turning the
Corner: Delaware’s A Better Chance Welfare Reform Program at Four Years,”
Cambridge: Abt Associates.
Figlio, D. and J. Ziliak (1999) “Welfare Reform, the Business cycle, and the Deline in
Friedlander, D. and G. Hamilton (1996) “The Impact of a Continuous Participation
Obligation in a Welfare Employment Program.” The Journal of Human Resources
31(4): 734-756.
Friedlander, D., D. H. Greenberg, and P. K. Robins (1997) “Evaluating Government
Training Programs for the Economically Disadvantaged.” Journal of Economic Literature 35(4): 1809-1855.
Greene, W. (2000) Econometric Analysis, Fourth Edition. Upper Saddle, NJ:
Prentice-Hall, Inc.
Harris, K. (1993) “Work and Welfare Among Single Mothers in Poverty,”American
Journal of Sociology 99, pp. 317-352.
Harris, K. (1996) “Life After Welfare: Women, Work, and Repeat Dependency,”
American Sociological Review 61, pp. 407-426.
Hoynes, H. (2000) “Local Labor Markets and Welfare Spells: Do Demand Conditions
Matter?” Review of Economics and Statistics 82, pp. 351-368.
Learch, S., J. Mayfield, and M. Burley (1999) "WorkFirst Job Search Services: Preliminary Analysis," Washington State Institute for Public Policy, Publication #9-06-3301.
Nakosteen and Zimmer (1980) “Migration and Income: The Question of
Self-Selection,” Southern Economic Journal 46, pp. 840-51.
O’Neill, J. and M.A. Hill (2001)“Gaining Ground? Measuring the Impact of Welfare
Reform on Welfare and Work,” NY: Manhattan Institute.
Wallace, G. and R. Blank (1999) “What Goes Up Must Come Down,”Economic
Conditions and Welfare Reform, Edited by S. Danziger, Upjohn Institute for Employment Research, Kalamazoo, MI, pp. 49-89.
Ziliak, J., D. Figlio, E. Davis, and L. Connelly (2000) “Accounting for the Decline in
AFDC Caseloads: Welfare Reform or Economic Growth?” Journal of Human
TABLE 1 Descriptive Statistics
Component JSCI WPLEX JC PET CJ
N 691 1122 8637 1588 1838
N with UI-reported
wages 571 1033 4635 739 832
% employed in the
CY2001, Q1 83.00% 92.10% 53.70% 46.50% 45.30%
Median quarterly earnings in CY2001, Q1
$1,657 $2,724 $1,496 $1,954 $1,624
% who exit TANF in
January 2001 23.00% 17.90% 18.00% 14.70% 12.00%
% returning in Feb.,
March, or April 2001 15.10% 12.90% 17.10% 19.30% 18.20%
Mean age of client 31* 33 33 32* 33*
Mean age of youngest
child 6* 7* 8* 7* 8*
Mean number of
children 2 2 2 2 2
% that never made it
through eighth grade 10.48% 11.42% 12.34% 10.45% 12.01%
% with some high
school 41.22% 24.28% 29.98% 34.54% 35.20%
% with high school
diploma/GED 42.16% 49.31% 45.68% 44.37% 43.23%
% with some college 5.50% 13.17% 10.36% 9.64% 8.70%
% with at least a
BS/BA 0.62% 1.81% 1.64% 0.99% 0.85%
Percent married 23% 32%* 28%* 24%* 22%*
% of past 24 quarters
employed 43.79% 44.13% 34.90% 33.05% 35.83%
% of past 4 quarters
employed 57.58% 62.10% 43.02% 37.48% 30.16%
Median earnings over
past 4 quarters 1,018 1,680 878 895 681
Percent with zero
earnings in 6 years 2.28% 4.18% 12.79% 11.83% 10.64%
Table 2 Odds Ratios of the Unrestricted Probit Model
Odds Ratio Estimates Effects Point
Estimate Standard Errors
Education 1.000 0.000087
Age Client 0.989 0.00265
Age of Youngest Child 0.992 0.00355
Work Experience (last 6 years) 1.025 0.00437
Work Experience (previous year) 1.035 0.0183
Number Children 0.966 0.0196
Community Jobs (CJ) 0.974 0.0824
JSCI 2.355 0.0818
Pre-Employment Training (PET) 0.988 0.0814
WPLEX 1.364 0.0774
J-Components (JC) 1.431 0.0788
Table 3 Likelihood Ratio Test Statistics (Unrestricted 2 lo g -lik e lih o o d = 7668.53)
Restricted Model 2 lo g -lik e lih o o d Likelihood Ratio*
No Identifiers 7729.59 122.118
JSCI 7717.41 97.75
J-Components 7678.24 19.42
WPLEX 7676.23 15.402
Community Jobs 7668.58 0.099
Pre-Employment Training 7668.54 0.022
*
The chi-square statistic is calculated by subtracting the unrestricted 2 lo g -lik e lih o o d
[image:22.612.118.473.417.541.2]Table 4 OLS Estimates of Equation 2
Effect Estimated
Coefficient
Standard Errors
Intercept 114.62 47.32
Education -0.206 0.369
Age of Client 7.588 1.467
Age of Youngest Child -5.93 1.553
Work Experience (last 6 years) 57.14 2.230
Work Experience (previous year) 36.71 9.248
Number of Children 63.09 9.124
Community Jobs (CJ) -92.82 36.68
JSCI 491.69 54.13
Pre-Employment Training (PET) -105.14 37.54
WPLEX 1018.18 45.46