Numerical Simulation and Comparison of Two
Conventional Ventilation Systems of Operating Room in
the View of Contamination Control
Sanjeev B Thool
Assistant Professor Rungta College of Engineering
Bhilai (CG), India
Shobha Lata Sinha
Professor
National Institute of Technology Raipur (CG), India
ABSTRACT
Operating room is likely a place of occurrence of infection to surgical site of patient due to contaminated particles. The proper ventilation system plays an important role to prevent it by safely removing contaminated particle from the critical areas of the operating room.
In the present investigation, two types of ventilation systems are analyzed by CFD simulation in the view of contamination control. These are Conventional High Supply and Low Exhaust (case 1) & Low Supply and High Exhaust (case 2). The common thing in these systems is that inlet and exhausts opening are located on walls only and operating on same Air Change Rate (ACH). These systems are just modeled by changing the inlet and exhaust openings of the same operating room.
Case 1 exhibits downward airflow whereas case 2 exhibits upward airflow movement. Numerical simulation result shows that ventilation system of case 2 is safer than case 1 in terms of contaminated particles strikes on the critical areas of Operating Room.
Keywords
Operating Room, Contamination Control, Surgical Site, Back Table, Velocity Distribution, Recirculation Zone, Thermal Plume.
1.
INTRODUCTION
Naturally, indoor air quality would not appear to be a primary concern in a critical environment like an operating room. Instead, issues such as the quality of the lighting, room layout and how potentially life saving equipment is placed, sterile procedures, and overall cleanliness of the room would seem to be paramount. However, as evidenced by the detailed requirements outlined in the Guidelines for Healthcare, American Institute of Architects (AIA) [1], the concepts for how air is distributed, filtered or exhausted, and how often the air is changed in the room are important.
The Conventional (mixing) ventilation systems are used in old hospitals Operating Rooms, which are located in majorities of developing countries. These systems are normally used for general surgeries, for example, Abdominal Surgery. Conventional ventilation system comprises inlet and exhaust opening on walls at different disposition with conventional mixing. The problem associated with these systems is with maintaining laminar airflow across the entire room, especially over the critical area around the patient. In order to avoid the turbulent airflow pattern to some extent, an alternation in the conventional cross flow ventilation system has been analyzed and compared. This alternative system is just modeled by changing the inlet and exhaust openings of the conventional
ventilation system so that airflow movement can be ensured in upward direction.
In order to support the present work, a number of air distribution strategies and design concepts such as type of supply air diffusers, exhaust / return air locations, air change rate (ACH) and lighting and medical equipment location effects are reviewed from the ASHRAE Research Transaction paper [2]. The ACH is often the factor that decisively affects performance of ventilation system. ACH is the time rate at which the room air is replaced based on total supply air quantity into the space and room volume.
ASHRAE-supported studies which used some of the latest software techniques to attempt to model air distribution concepts in operating rooms to determine theoretical optimization of the air distribution concept, as they relate to infection control. Specifically, one by Memarzadeh and Manning [3] attempts to address this topic from a computer modeling framework utilizing computational fluid dynamics software.
2.
CONTAMINATION
CONSIDERATIONS
The source of contamination considered in this study is squame. Squames are cells that are released from exposed regions of the surgery staff (for example, neck and face) and are the primary transport mechanism for bacteria in the operating room. They are of the size of approximately 25 microns by 3 to 5 microns thick. Approximately 1.15 x 10⁶ to 0.9 x 10⁸ squames are generated during a typical (2 to 4 hours) procedure [4]. In this study, the particles would be tracked to see how many of these particles hit the back table or the surgical site. For the purpose of this study, the surgical site is considered as 0.3 m x 0.3 m square where the surface temperature is 38 ˚C.
It is obvious that keeping track of so many particles in the study would not be feasible. Therefore, a representative number of particles are introduced from dominant sources. The locations of sources considered are face of surgeons (surgeon source) and face of nurses (nurse source).
The basic assumption in this study is that the squames can be simulated as particles being released from several sources surrounding the occupant. These particles are then tracked for a certain period of time in the room. From the output of the CFD simulation, the distributions of air velocities and the turbulent parameters can be directly applied to predict the path of the airborne squames in convection and diffusion processes.
namely the surgical site and the top surface of the back table. Particles that are neither vented nor strike the target are assumed to remain in the room when the overall particle tracking time limit is reached. In terms of the particles that remain in the room, it can be analyzed that the particles either become trapped in recirculation regions (which they may exit after very long time periods) or fall by gravity to the floor in low velocity flow regions.
3.
AIR FLOW MODEL
Eulerian approach is employed in airflow model. In this approach the air is treated as a continuum moving in the room as governed by the equation of conservation of mass, momentum and energy. The generalized form of conservation equation is represented as given in equation (1).
………….(1)
Where represents each of the three components of the velocity vectors, u, v and w, the kinetic energy of turbulence, k, and the dissipation rate of the kinetic energy of turbulence,
, and the air enthalpy, h. When is unity, the equation represents the conservation of mass. is the effective exchange coefficient for the dependent variable . S is the source term of the general equation. The equations are discretized into algebraic equations by the finite volume method based on a second-order upwind scheme, and SIMPLE algorithm (Patankar) [5] is adopted to couple pressure and velocity.
4.
PARTICLE TRAJECTORY MODEL
Discrete trajectory approach (Lagrangian method) is employed in the particle trajectory model. The interaction between air and the particles is treated as a one-way coupling, assuming that the effect of particles on the turbulent flow is negligible due to the small particle size and low particle concentration. The solid surfaces (ceiling, floor and walls) are assumed as perfect absorbers of particles, that is, when a small particle touches a solid surface, it sticks to it without rebound.
The Lagrangian approach [6] splits the particle phase into a representative set of individual particles and tracks these particles separately through the flow domain by solving the momentum equation. By equating the particle inertia with external forces, the momentum equation can be expressed as equation 2.
……… (2)
Where ui and up are the velocity of air and particle, respectively (m/s); is the molecular viscosity of air (kg/ms);
is the density of air (kg/m3); dp is the particle diameter (m);
p is the density of particle (kg/m3); Re is the particle Reynolds number, CD is the drag coefficient; g is the gravitational acceleration (m/s2).
In equation, the left-hand side represents the inertial force per unit mass (m/s). The first term on the right-hand side is the drag term; the second term represents the gravity and the buoyancy. Other terms Fb, Ftherm, and Fs represent the Brownian term, the thermophoretic term and lift term, respectively are small enough to be negligible.
Re is defined by equation 3 as given below:
………….. (3)
CD is the drag coefficient; which depends on Reynolds number, turbulence level, etc, and can be described as given below:
……….(4)
(5)
5.
MODELING OF OPERATING ROOM
A model of the operating room is prepared in GAMBIT software [7]. A typical operating room layout consisting of the number of surgical staff, lights, machinery, tables and patient, is considered for the baseline model for the CFD simulations. It is recognized that such items may influence the airflow and temperature distribution due to buoyancy effect of thermal plumes [8]. The general features of the baseline room are given inTable 1.
The panel of physicians approves this layout of operating room for the initial study with following considerations:
1. Items such as gas columns are not included with the belief that they obstruct the free movement of large equipment in operating rooms, limits the placement and position of operating table, and are difficult to keep clean;
2. Operating room is having connection of gas lines at the ceiling, since such lines would not provide significant blockage to airflow;
[image:2.595.95.504.609.757.2]C-arm, are not included in this study, as it is felt that they did not constitute mainstream equipment.
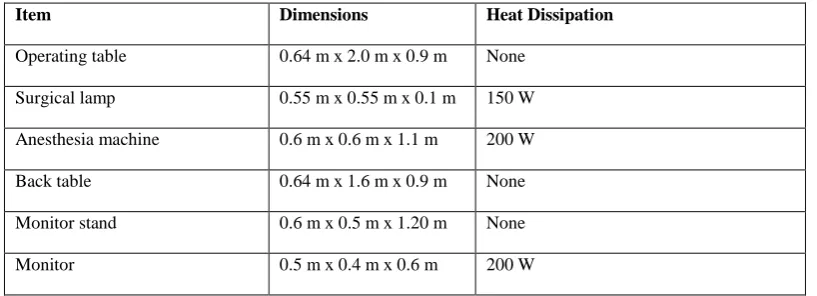
Table 1: Dimensional and Heat Dissipation of Major Items in Operating Room Item Dimensions Heat Dissipation
Operating table 0.64 m x 2.0 m x 0.9 m None
Surgical lamp 0.55 m x 0.55 m x 0.1 m 150 W
Anesthesia machine 0.6 m x 0.6 m x 1.1 m 200 W
Back table 0.64 m x 1.6 m x 0.9 m None
Monitor stand 0.6 m x 0.5 m x 1.20 m None
Surgical staff (Two surgeon and three nurses)
0.46 m x 0.28 m x 1.8 m
each 100 W each
Patient 0.46 m x 0.28 m x 1.8 m
Exposed head dissipates 46 W. Surgery site (0.3 m x 0.3 m) area with surface temperature = 38 ˚C
6.
HIGH SUPPLY AND LOW
EXHAUSTS (CASE 1)
[image:3.595.300.546.75.364.2]In this system air is supplied at high level from one side and exhausted at low level from two sides with conventional supply and exhaust diffuser type as shown in figure 1. The size of each inlet and exhaust grille is 0.61m X 0.36m. Particulate movement from the critical envelope down along the floor and out of the space represents shortest path for removal. The most suitable operating value of ACH for this system is ranging from 20 h-1 to 25 h-1. The present CFD simulation is done by taking the relevant data from the literature of work done by Memarzadeh and Manning [3], that is ACH as 25 h-1 and air velocity as 1.28 m/s with temperature as 27 C°.
Fig 1: Model of Case I
7.
LOW SUPPLY AND HIGH
EXHAUSTS (CASE 2)
[image:3.595.55.280.319.499.2]In this system air is supplied at low level from two sides and exhausted at high level from two sides with conventional supply and exhaust diffuser type as shown in figure 2. The size of each inlet and exhaust grille is 0.61m X 0.36m. Particulate movement from the critical envelope upward along the ceiling and out of the space represents shortest path for removal. The most suitable operating value of ACH for this system is ranging from 20 h-1 to 25 h-1. The present CFD simulation is done by taking the relevant data from the literature of work done by Memarzadeh and Manning [3], that is ACH as 25 h-1 and air velocity as 0.64 m/s with temperature as 27 C°.
Fig 2: Model of Case 2
8.
NUMERICAL SIMULATION OF
CASE 1
The numerical simulation is carried out for ACH of 25 h-1.
Figure 3 and Figure 4 show the velocity distribution and flow field pattern respectively obtained by FLUENT software [9]. These figures show that the major recirculation flow zones are created on both sides of critical space of Operating Room. One recirculation zone, just above the floor covering inlet diffuser side of operating room has been observed. This zone captures the area around the back table where mean age of air is more as compared to that for other than that zone. Similarly one recirculation at middle of the operating room above the operating table has also been observed.
Fig 3: Velocity Distribution for Case 1
Velocity Vectors Colored By Velocity Magnitude (m/s)
FLUENT 6.0 (3d, dp, segregated, ske) Oct 30, 2013
1.32e+00
1.19e+00
1.05e+00
9.23e-01
7.91e-01
6.59e-01
5.27e-01
3.96e-01
2.64e-01
1.32e-01
1.02e-04 Z
Y
[image:3.595.319.543.520.647.2]Fig 4: Flow field pattern for Case 1
9.
NUMERICAL SIMULATION OF
CASE 2
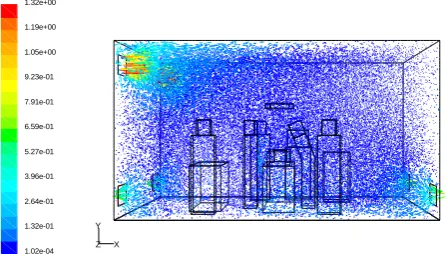
[image:4.595.55.279.76.209.2]The numerical simulation is carried out for ACH of 25 h-1. Figure 5 and 6 shows the velocity distribution and flow field pattern respectively obtain by FLUENT software. The shows that there in no air flow crossing the critical space around the operation table. Only curvature upward moment of air flow zones are created at four corners of Operating Room. It is also observed that vertical velocity vectors above the patient that is due to the formation thermal plumes. This thermal plumes are experienced due to the fact that there is no counteracting effect of horizontal velocity due to ventilation system on the convective flow of air due to relatively higher temperature of surgical site lamp.
Fig 5: Velocity Distribution for Case 2
Fig 6: Flow Field Pattern for Case 2
10.
PARTICLE TRAJECTORY
[image:4.595.317.544.76.204.2]SIMULATIONS AND PERFORMANCE
Results from the numerical simulation (Table 2) show that effectiveness of these two cases. These results are the outcomes from the FLUENT software. Representative numbers of particles generated from face of the each surgical staff are considered to be 564 per hour as one of the boundary condition for particle trajectory simulation in FLUENT. And number of particles striking on the surgical site and back table is tabulated as output. This is an expected result, but there are interesting points to be drawn from the results. For same ACH, there is a marked difference in terms of the percentage of particles removed via ventilation. Case 2 demonstrates a more effective removal of particles than case 1. The reason in this example is that the ventilation system in Case 1 results in the formation of two large recirculation zones in the room where particles can become trapped (Figure 4) whereas in Case 2, the ventilation system works with the thermal plume in the center of the room in driving the particles up to the high level exhausts (Figure 6).Table 2: Percentage of Particles Vented from Room and Percentage of Particles Strike on Surgical Site and Back Table
Cases Particle Source
Total Number of particles released
Contaminated particles escaped
from Operating Room
Contaminated Particles Strike on
Surgery Site
Contaminated Particles Strike on
Back Table
Nos. % Nos % Nos %
Case 1
Surgeons 564*2 = 1128 519 46.0 3 0.26 17 1.5
Nurse 564*3 = 1692 865 51.1 6 0.35 42 2.5
Case 2
Surgeons 564*2 = 1128 837 74.2 0 0.0 3 0.26
Nurses 564*3 = 1692 1406 83.1 0 0.0 18 1.1
Path Lines Colored by Velocity Magnitude (m/s)
FLUENT 6.0 (3d, dp, segregated, ske) Oct 30, 2013
1.28e+00
1.15e+00
1.02e+00
8.96e-01
7.68e-01
6.40e-01
5.12e-01
3.84e-01
2.56e-01
1.28e-01
0.00e+00 Z
Y
X
Velocity Vectors Colored By Velocity Magnitude (m/s)
FLUENT 6.0 (3d, dp, segregated, ske) Oct 29, 2013
8.76e-01
7.88e-01
7.01e-01
6.13e-01
5.26e-01
4.38e-01
3.51e-01
2.63e-01
1.75e-01
8.77e-02
1.30e-04 Z
Y
X
Path Lines Colored by Velocity Magnitude (m/s)
FLUENT 6.0 (3d, dp, segregated, ske) Oct 29, 2013
8.37e-01
7.53e-01
6.69e-01
5.86e-01
5.02e-01
4.18e-01
3.35e-01
2.51e-01
1.67e-01
8.37e-02
0.00e+00 Z
Y
[image:4.595.80.517.572.732.2]In case 1, Contaminated particles generated from both surgeons and nurses are not trapped on back table and especially on surgical site, which is the main advantage of this system over Case 2. It is also found that percentage of contaminated particles escaped from the operating room is remarkably more in Case 2 than Case 1. The main responsible factor for this advantage is thermal plume, which is generated from the surgical site and other equipment like lamp, monitor and anesthesia machine. In case 1, effect of plumes is nullified because of relatively higher inlet air velocity. However, it is verified that this performance is affected by the heat load in the Operating Room, which in turn, it is affected by the amount and type of equipment, people and lights used. Other variable may also affect the efficiency, for example the movement of people in the Operating Room, and the occurrence of open doors.
11.
CONCLUSION
The numerical results of the ventilation systems discussed above reveals that the air moves across contaminated personnel and equipment before reaching the patient. This results in localized areas of turbulent flow and low velocity recirculation zones, thus possibly increase the risk of infection.
The percentage of particles that hit the surgical site from the Surgeons and Nurses are low, less than 1% in ventilation system of case 2. The reason behind is that, the relative dominance of the thermal plume caused by the surgical site since obstruction of field velocity above the operating table is very weak. This percentage becomes significant only when the particles are released close to the site, in particular the contaminant source from main surgeon performing the operation.
12.
REFERENCES
[1] AIA Guidelines (2006). “Guidelines for Design and Construction of Hospital and Health Care Facilities”.
[2] Farhad Memarzadeh, and Andrew Manning. “Comparison of Operating Room Ventilation Systems in the Protection of the Surgical site.” ASHRAE Transactions 108 (2).
[3] Farhad Memarzadeh and Zheng Jiang. “Effect of Operating Room Geometry and Ventilation System Parameter Variations on the Protection of the Surgical Site”.
[4] M. A. Melhao, J. L. M. Hensen, and M. Loomans. “Review of Ventilation System in Operating Rooms in View of Infection Control”, Proceedings of the 6th
Int. Postgraduate Research conference in the Built and Human Environment, 6 – 7 April. pp. 478-487.
[5] S.V.Patankar, Numerical Heat Transfer and Fluid Flow, McGraw Hill, Washington, (1980).
[6] Z. Zhang, Q. Chen 1983. “Experimental measurements and numerical simulations of particle transport and distribution in ventilated rooms”. Atmospheric Environment, 40 (2006) 3396 – 3408.
[7] GAMBIT 2.2 Tutorial Guide. September 2004.
[8] S. L. Sinha, R.C. Arora and Subhransu Roy, 2002. “Numerical simulation of room air distribution with Buoyancy at different outlet locations”. Fluid Mechanics and Fluid Power, pp: 181-190.