http://dx.doi.org/10.4236/as.2015.68080
How to cite this paper: Li, Y.Q., Zhang, S.H. and Peng, Y. (2015) Soil Erosion and Its Relationship to the Spatial Distribution of Land Use Patterns in the Lancang River Watershed, Yunnan Province, China. Agricultural Sciences, 6, 823-833.
http://dx.doi.org/10.4236/as.2015.68080
Soil Erosion and Its Relationship to the
Spatial Distribution of Land Use Patterns in
the Lancang River Watershed, Yunnan
Province, China
Yueqiang Li, Shanghong Zhang
*, Yang Peng
Renewable Energy School, North China Electric Power University, Beijing, China Email: *zhangsh928@126.com
Received 30 July 2015; accepted 17 August 2015; published 20 August 2015
Copyright © 2015 by authors and Scientific Research Publishing Inc.
This work is licensed under the Creative Commons Attribution International License (CC BY). http://creativecommons.org/licenses/by/4.0/
Abstract
The Lancang River Watershed is one of the most biologically diverse areas in the world. The river flows through Yunnan Province, China, which suffered serious deforestation since the 1980s; this in turn led to increased soil erosion in the region. To investigate the influence of the spatial dis-tribution of land use and slope on soil erosion in the Lancang River Watershed, the Soil and Water Assessment Tool (SWAT) model was used to establish hydrological models using two-phase land use maps (1975 and 1985), a soil map, and meteorological data from 11 gauging stations. The sa-tisfactory values of Nash-Sutcliffe efficiency Ens and correlation coefficient R2 during the calibra-tion and validacalibra-tion period indicated that SWAT can be used in this area to simulate the average annual soil erosion under different land use scenarios change. By comparing soil erosion rate un-der different land use scenarios change, forests and grasslands had similar effects on preventing soil erosion. A parameter, soil erosion increment (Ei), was used to assess the effects of slope on soil erosion. The results revealed that variation in sediment yield was more sensitive to land use change for slopes exceeded 25˚ than for slopes being 0˚ - 15˚. The spatial distribution of land use also had a relationship to soil erosion. Compared with the soil erosion rate in each sub-watershed using two-phase land use maps, the soil erosion rate increased when the percent cover of natural vegetation decreased. The results of this study provide baseline data for soil conservation and protection of the environment and ecology of the Lancang River Watershed in Yunnan Province.
Keywords
Lancang River Watershed, Land Use, Slope, Soil Erosion, SWAT, Forest, Grassland
1. Introduction
Soil erosion, a major environmental problem, often leads to loss of nutrients, a decline in soil fertility, and a re-duction in crop productivity. Soil erosion is a type of non-point source pollution that can cause river silting and water pollution, and affects normal flood discharge as well as service life and efficiency of hydropower projects
[1]. Many factors influence soil erosion, including natural conditions and human activities [2] [3]. Natural fac-tors include geomorphology, soil type, climate, and vegetation. Human activity facfac-tors mainly include construc-tion and engineering projects as well as land development and use. Land use change is one of the largest single threats causing increased sediment yield and soil erosion [4]-[8]. During the past several decades, research re-lated to this issue has received increasing attention by scholars globally [9]-[16].
The Lancang River is one of six major water systems in Yunnan Province; human activities in the watershed have exacerbated soil erosion problems [17] [18]. The upstream portion of the Lancang River Watershed has a high percentage of forest cover, but income from timber harvest that creates deforestation has long been the pil-lar of the local economy. The middle reaches of this watershed experience intensive human disturbance, because highway construction, mining, and power plant construction are concentrated in this area. As a result, this area experiences wide variations in land use, which creates environmental issues. The expanding economy also creates problems with immigration while making sustainable economic development very problematic. The lower reaches of the Lancang River Watershed in the Xishuangbanna district, a tropical area of China, are inha-bited by mountain people who have applied traditional slash and burn methods to make use of the land, so rapid changes are occurring in land use and vegetation coverage. In general, the Lancang River Watershed has a very fragile environment that is a result of deforestation and an unsustainable agricultural system [17]. Yao et al. used geographic information system (GIS) to study the spatial distribution of soil erosion and factors influencing soil erosion in the Lancang River Watershed [19], while the study revealed the effect of land use on soil erosion without excluding slope as a factor, and analyzed the response of soil erosion to slope without excluding the acreage factor. Therefore, delineating the areas that are most vulnerable to soil erosion as well as revealing the relationship between soil erosion and the spatial distribution of land use can assist local land use managers in applying appropriate in the Lancang River Watershed.
In recent years, many watershed scale models have been developed to study the hydrological processes [20]- [23]. The Soil and Water Assessment Tool (SWAT) is one of the most suitable models for simulating water and sediment yields underland use and management scenarios [24]-[26]. SWAT as a physically based, distributed, continuous daily time step parameter model, is designed to predict the impact of land management practices on water, sediment and agricultural chemical yields in large, complex watersheds with varying soils, land use and management conditions over long periods of time. Therefore, in this study, the SWAT model was chosen as the tool to study the influence of slope and the spatial distribution of land use on soil erosion.
The main study objectives of this paper were to: (a) explore the effect of land use change and slope on soil ero- sion characteristics in the Lancang River Watershed, Yunnan Province, and (b) analyze the average annual soil ero- sion in each sub-watershed and reveal its relationship to the characteristics of the spatial distribution of land use.
2. Study Area
The Lancang River of Yunnan Province drains a 76,147 km2 watershed that covers 23.08% of the Yunnan Province and is located at 21˚08' - 29˚15'N 98˚36' - 102˚19'E (see Figure 1); further south it is known as the Mekong River. The long and narrow, north to south aligned watershed has high elevations in the north and low elevations in the south. The main stream of the Lancang River in Yunnan Province, which consists of 96 rivers, is 1240 km long. The climates changes from north to south in the watershed. This is reflected in the average an-nual temperature that increases from 4.8˚C to 21.1˚C when going from high to low latitudes and elevations. The entire watershed covers seven climatic zones: cold temperate zone, temperate zone, warm temperate zone, north subtropics, mid-subtropics, south subtropics, and north tropical zone. Most regions of the Lancang Watershed receive an average of more than 1000 mm precipitation annually; most rain (~85%) falls between May and Oc-tober due to the southwest monsoon. The main land use types in this watershed are forest and farmland.
3. Materials and Methods
3.1. Data Collection
Figure 1. Location of Lancang River watershed in Yunnan province, China.
positions at regularly spaced intervals, land use map, soil map, and climatic data used to drive the SWAT model for this study were collected as follows (1) DEM data with a spatial resolution of 30 × 30 m was downloaded from the International Scientific Data Service Platform (http://datamirror.csdb.cn). (2) Two 1:100,000 land use maps, one each from 1986 and 2000, were obtained from the Data Sharing Infrastructure of Earth System Science (www.geodata.cn), and land use patterns were then classified into six types: forest, grass, river, urban, paddy field, and upland field. In this paper, the paddy field and upland field were collectively known as grain field. (3) The spatial distribution of soil types (1:1,000,000) and soil data based on soil physical characteristics data collected from the Environment and Ecological Science Data Center for West China
(http://westdc.westgis.ac.cn). The classification standard of soil particles used in the SWAT model is the stan-dard system used in the United States and the data base used in this study applied the same stanstan-dard, so soil par-ticle data did not need to be converted. (4) The daily rainfall, maximum and minimum air temperature, wind speed, and humidity data at 11 gauges collected during 1970-2000 was downloaded from the China Meteoro-logical Data Sharing Service System (http://cdc.cma.gov.cn). Because of the lack of measured solar radiation data during the model running time, a weather generator was established to simulate solar radiation. The monthly climatic statistical data which were used in the weather generator was calculated based on the measured daily data from 1951-1973 of Weixi, Baoshan, Jinghong and Lincang gauge station. (5) The day runoff and se-diment yield data collected at Jinghong Gauging Station during 1975-1985 were taken from a book named The Hydrological Data of South Tibetan and West Yunnan [27].
3.2. Model Setup
and the outlet of the watershed. When using a DEM to extract the river network in this study, the threshold value was set as 50,000 ha and the outlet was selected at the position where the Lancang River flows out of Yunnan Province. Finally, the entire watershed was divided into 71 sub-watersheds. An HRU is the basic unit of the SWAT model simulation; this study applied the multiple land use/soil-type method and set the HRU threshold as 10/10, namely if the percentage of one kind land use or soil type is less than 10%, this land use or soil type would be neglectful and replaced by adjacent type; the entire Lancang Watershed, as defined above, was divided into 1705 HRUs.
In this study, the simulation of runoff applied the SCS runoff curve number method; the skewed normal dis-tribution method was adopted to simulate the rainfall; the potential evaporation was calculated based on the Penman-Monteith method and the channel calculus applied the variable storage method which had high simula-tion precision. More details could be found in theoretical documentasimula-tion [28].
The purpose of parameter sensitivity analysis is to discover how the variation of the input parameters influ-ences the output and to determine which input parameter variation has the most influence on the output; that is, the sensitivity analysis results will provide a reference for determining the most sensitive parameters. This study compared the simulated runoff and sediment yield with measured data, and sensitivity analysis was used to de-termine the importance of several parameters that affected the accuracy of runoff and sediment yield simulation results. Appropriate parameters were selected (Table 1 andTable 2) and the model was calibrated accordingly.
3.3. Evaluation Indicator
Model performance was evaluated by the correlation coefficient R2 and the Nash-Sutcliffe efficiency Ens[29].
The two indicators can be computed by the following equations:
(
)(
)
(
) (
)
2
2
2 2
m m s s
m m s s
Q Q Q Q
R
Q Q Q Q
− − ∑ = ∑ − ∑ − (1)
(
)
(
)
2 21 m s
ns m m Q Q E Q Q − ∑ = − −
∑ (2)
where Qm and Qs are the observed and simulated data, and Qm are the Qs mean values of the observed and
simulated data. If R2 > 0.6 and Ens > 0.5, the model performance can be regarded as acceptable. The higher the
[image:4.595.93.538.509.614.2]values, the better the model performance.
Table 1. Calibrated values for runoff simulation.
The most sensitive parametersa Parameter definition Range Calibrated value
CN2 Initial SCS CN II value ±25% +16%b
SOL_AWC Soil available water capacity ±30% +10%b
ALPHA_BF Base flow alpha factor ±30% +12%b
ESCO Soil evaporation compensation factor 0.01 - 1 0.95
CH_K2 Channel effective hydraulic conductivity 0 - 100 53
[image:4.595.88.541.644.705.2]a. Parameters are ordered according to their level of sensitivity; b. Indicates the percentage by which the original values changed.
Table 2. Calibrated values for sediment yield simulatio.
The most sensitive paramtersa Parameter definition Range Calibrated value
SPCON Linear parameters for sediment re-entrainment 0.0001 - 0.01 0.0011
SPEXP Exponent parameter for sediment re-entrainment 0.8 - 2.0 0.9
3.4. Study the Effects of Land Use Change and Slope on Soil Erosion
Based on Chinese hydraulic erosion intensity classification reference indicators, reclaiming fields with slopes of 15˚ - 25˚ would probably lead to moderate erosion that harms the growth of crops. Reclaiming fields with slopes greater than 25˚ would lead to severe erosion, and steeply sloping fields are the main source of water and soil loss. Therefore, based on the practical situation in the study area, seven different vegetation recovery scenarios were established to simulate the impact of land use change on sediment yield (seeTable 3); other land use-type areas remained unchanged in the simulation. By comparing the soil erosion rate under different scenarios, one can see the effect of land use change on soil erosion in the Lancang River Watershed. Two main types of scena-rios were developed: converting grain fields to either forest or grassland. This was done because 63.7% of the entire watershed is forested, while grassland and farmland (including paddy fields and upland fields) account for 18.4% and 16.4% of the landscape, respectively. Also, farming activities are the main element influencing ve-getation cover. Therefore, this study emphasized the analysis of the effect of returning grain fields to forest or grassland on soil erosion in the Lancang River Watershed.
Slope is also a major factor influencing sediment yield and soil erosion. To determine the effect of slope on soil erosion rate, a parameter named soil erosion increment was defined using Equation (3).
1
i i
i
S S
E A
−
= (3)
where Ei is soil erosion increment (t/km2), S1 and Si are the sediment yield of land use scenario 1 and scenario i
(t), S1 is the reference scenario and Ai is the area of farmland changed during scenario i. The soil erosion
incre-ment provides the relative variation in sediincre-ment yield per unit area so that a larger Ei indicates greater variation.
Comparing the soil erosion increment under different land use scenarios can reveal whether the variation of se-diment yield is sensitive to the variations in slope [30]. In this part of the study, the land use of 1986 and the av-erage annual rainfall were used to simulate the soil erosion values.
3.5. Assessing the Effects of the Spatial Distribution of Land Use on Soil Erosion
Changes in the spatial distribution of land use could change the characteristics of soil erosion, so the effects of the spatial distribution of land use on soil erosion had to be assessed. This study simulated the average annual soil erosion rate in each sub-watershed using two-phase land use maps. Five sub-watersheds with the most se-rious variation in soil erosion were selected for analysis. The soil erosion rate and land use types in these sub- watersheds were compared for 1986 and 2000 to clearly identify the effects of land use change on soil erosion. This method removed the effects of the intensity of precipitation, slope, and soil conditions on the soil erosion so that the results only showed the effects of the spatial distribution of land use on soil erosion in the sub- watershed scale. This part of the study helped to identify the areas that were most vulnerable to soil erosion and revealed the influence of land use change in a practical way. It will also help land use managers to conduct land use planning more efficiently.
4. Results and Discussion
4.1. Runoff and Sediment Yield Calibration and Validation
Data collected on runoff and sediment yield from 1975 to 1985 and meteorological data from 1970 to 2000 were used in this study. The years of 1970-1974 were selected as the warm-up period, 1975-1980 were the calibration
Table 3. Calibrated values for runoff simulation.
Scenarios 1 2 3 4 5 6 7
The sloping fields of
0˚ - 5˚ Original condition field to forest Return grain
Return grain
field to grass - - - -
The sloping fields of
15˚ - 25˚ Original condition - - field to forest Return grain
Return grain
field to grass - -
The sloping fields
over 25˚ Original condition - - - - field to forest Return grain
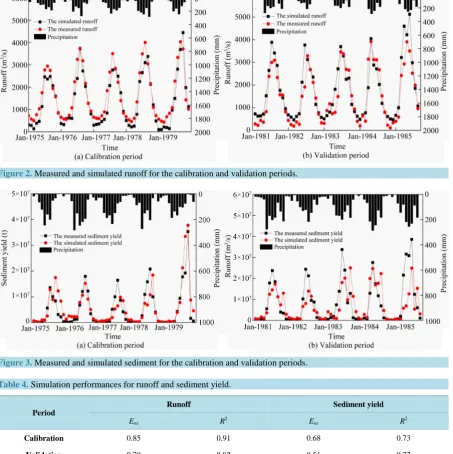
year, and 1981-1985 were the validation year.Figure 2and Figure 3compare measured and simulated runoff and sediment yield at the Jinghong Gauging Station during the calibration and validation years.
Table 4 presents the simulation performance for runoff and sediment yield. The Ens values were more than 0.5
and R2 values were generally more than 0.7 for both the calibration and validation years, so one can conclude that the SWAT model can be used to study the impact of the spatial distribution of land use on characteristics of soil erosion in the Lancang River Watershed.
4.2. Effects of Land Use Change and Slope on the Soil Erosion
[image:6.595.89.543.257.712.2]In this study watershed, grain field with slopes of 0˚ - 15˚, 15˚ - 25˚ and over 25˚ accounting for 61.10%, 30.79% and 8.11%, respectively. The average annual soil erosion rate (t/km2) under land use scenarios, 1, 2, 3, 4, 5, 6 and 7 were 1152, 879, 891, 815, 835, 448 and 510, respectively. The results showed that the soil erosion rate decreased when grain fields were returned to forest or grassland. This indicates that both forestland and
[image:6.595.89.539.446.610.2]Figure 2.Measured and simulated runoff for the calibration and validation periods.
Figure 3. Measured and simulated sediment for the calibration and validation periods.
Table 4. Simulation performances for runoff and sediment yield.
Period
Runoff Sediment yield
Ens R2 Ens R2
Calibration 0.85 0.91 0.68 0.73
[image:6.595.89.541.654.721.2]grassland are in favour of reducing soil erosion when compared with grain fields. And returning grain fields to forest had a slightly better effect on reducing erosion than returning grain fields to grassland.
Table 5shows E6 is 10,892 t/km2, which is 2.2 times the value of E2. This indicates that the variation of se-diment yield is more sensitive to land use change when the slope exceeds 25˚; the same conclusion can be drawn from a comparison of E7 and E3 because E7 is 2.1 times the value of E3. From an economic perspective, this re-sult shows that managing 1 km2 of farmland with a slope over 25˚ was equal to managing almost 2 km2 of farm-land with a slope of 0˚ - 15˚. Land managers should seriously consider changes in land use for farmland with slopes exceeding 25˚ to achieve very efficient land use planning and management. The radio of E6 to E2 in this study area is different with the radio in other watershed although they are all bigger than 2, the rainfall intensity and soil type are the main influencing factors, and the different radios between different watersheds need further study. In addition, the fact that E2 > E3, E4 > E5 and E6 > E7 (Figure 4) illustrates that the variation of sediment yield is slightly sensitive to forest than grassland. Because the difference was not obvious, returning grain fields to grassland would be a more cost-effective method than returning grain fields to forest.
4.3. Effect of the Spatial Distribution of Land Use on Soil Erosion
Figure 5 provides the soil erosion under average annual rainfall in each sub-watershed under the two-phase land use maps. InFigure 5(a) andFigure 5(b) the five colors represent the different soil erosion levels based on the erosion hazard classification established by the Ministry of Water Resources of the People’s Republic of China
[31]: mired, mild, medium, intense, and very intense (Table 6). One can conclude soil erosion in downstream areas is greater than that in the upstream and midstream areas because high-intensity precipitation mainly occurs in the downstream areas of the watershed. To quantify the effects of the spatial distribution of land use on soil erosion, five sub-watersheds (25, 26, 36, 38 and 59) were selected because these five sub-watersheds obviously experienced the most variation in soil erosion from 1986 to 2000 (Figure 5(c)). By comparing the two land use
Table 5. The soil erosion increment of different land use scenarios.
Sediment yield (105 t) S1 S2 S3 S4 S5 S6 S7
873.76 666.83 675.31 618.21 632.84 339.55 386.43
Area (km2) A2 A3 A4 A5 A6 A7
4153.75 4153.75 2661.5 2661.5 4904.5 4904.5
Soil erosion increment (t/km2)
E2 E3 E4 E5 E6 E7
5054 4778 9602 9052 10892 9936
Figure 5. Spatial distribution of the average annual soil erosion rate for the two-phase land use map: (a) 1986, (b) 2000, (c) the absolute change in soil erosion in each sub-watershed.
Table 6. Classification of erosion intensity.
Level Mired Mild Medium Intense Very intense
Average erosion modulus (t/(km2∙a)) <500 500 - 2500 2500 - 5000 5000 - 8000 8000 - 15,000
Table 7.The main land use changes and concurrent changes in the soil erosion rate in five sub-watersheds.
Sub-watershed Land use types
Area of each land use type (km2)
Variation (km2)
Soil erosion rate(t/km2)
Variation (t/km2)
1986 year 2000 year 1986 year 2000 year
25
Forest 418.5 415.25 −3.25
4473.3 4859.8 +386.5
Grass 104.25 91.5 −12.75
Sum 522.75 506.75 −16
26
Forest 450.25 444.25 −6
1916.4 2637.7 +721.3
Grass 38.5 27 −11.5
Sum 488.75 471.25 −17.5
36
Forest 102.5 99.5 −3
8057.8 7705.5 −352.3
Grass 182.25 186.25 +4
Sum 284.75 285.75 +1
38
Forest 418 395.5 −22.5
5749.3 6052.6 +303.3
Grass 103 66.25 −36.75
Sum 521 461.75 −59.25
59
Forest 380.25 363 −17.25
2321.2 2504.7 +183.5
Grass 34.5 47.25 +12.75
Sum 414.75 410.25 −4.5
5. Conclusions
The SWAT model was used to simulate average annual sediment yield in the Lancang River Watershed, Yunnan, China under different land use and slope scenarios to investigate the effects of the spatial distribution characte-ristics of land use and slope on soil erosion.
By comparing soil erosion rate under different land use scenarios, both forests and grasslands are seen to have similar effect on reducing soil erosion. A parameter named soil erosion increment (Ei) was defined to assess the
effect of slope on soil erosion. Farmland with slopes over 25˚ was seen to be more sensitive to land use change in terms of increased relative erosion rate than farmland with slopes of 0˚ - 15˚ and 15˚ - 25˚, the Ei ratio
be-tween the area over 25˚ and 0˚ - 15˚ is above 2, and forests were slightly better than grasslands in reducing ero-sion on steep slopes when land use changed.
The characteristics of the spatial distribution of the soil erosion rate under average annual rainfall in each sub- watershed were analyzed for 1986 and 2000 and the area in the middle and lower reaches of the river along the mainstream channel experienced serious soil erosion. Based on the comparison of the five sub-watersheds, a negative proportional relationship exists between the soil erosion rate and forest area. If less land is covered by natural vegetation, the soil erosion rate would obviously increase.
The findings of this study can provide baseline information and reference data in support of soil conservation and environmental protection efforts in the Lancang River Watershed.
Acknowledgements
soil physical characteristics and the China Meteorological Data Sharing Service System, which supports the collection of meteorological data.
References
[1] Wilson, G.V., Cullum, R.F. and Römkens, M.J.M. (2008) Ephemeral Gully Erosion by Preferential Flow through a Discontinuous Soil-Pipe. Catena, 73, 98-106. http://dx.doi.org/10.1016/j.catena.2007.09.008
[2] Hessel, R. and Jetten, V. (2007) Suitability of Transport Equations in Modelling Soil Erosion for a Small Loess Plateau Catchment. Engineering Geology, 91, 56-71. http://dx.doi.org/10.1016/j.enggeo.2006.12.013
[3] Vrieling, A., Jong, S.M., Sterk, G. and Rodrigue, S.C. (2009) Timing of Erosion and Satellite Data: A Multi-Resolution Approach to Soil Erosion Risk Mapping. International Journal of Applied Earth Observation and Geoinformation, 10, 267-281.
[4] Marques, M.J., Bienes, R., Jiménez, L. and Pérez-Rodríguez, R. (2007) Effect of Vegetal Cover on Runoff and Soil Erosion under Light Intensity Events. Rainfall Simulation over USLE Plots. Science of The Total Environment, 378, 161-165. http://dx.doi.org/10.1016/j.scitotenv.2007.01.043
[5] Bakker, M.M., Govers, G., van Doorn, A., Quetier, F., Chouvardas, D. and Rounsevell, M. (2008) The Response of Soil Erosion and Sediment Export to Land-Use Change in Four Areas of Europe: The Importance of Landscape Pattern.
Geomorphology, 98, 213-226. http://dx.doi.org/10.1016/j.geomorph.2006.12.027
[6] García-Ruiz, J.M. (2010) The Effects of Land Uses on Soil Erosion in Spain: A Review. Catena, 81, 1-11. http://dx.doi.org/10.1016/j.catena.2010.01.001
[7] Feng, X., Wang, Y., Chen, L., Fu, B. and Bai, G. (2010) Modeling Soil Erosion and Its Response to Land-Use Change in Hilly Catchments of the Chinese Loess Plateau. Geomorphology, 118, 239-248.
http://dx.doi.org/10.1016/j.geomorph.2010.01.004
[8] Shen, Z., Chen, L., Hong, Q., Qiu, J., Xie, H. and Liu, R. (2013) Assessment of Nitrogen and Phosphorus Loads and Causal Factors from Different Land Use and Soil Types in the Three Gorges Reservoir Area. Science of the Total En-vironment, 454-455, 383-392. http://dx.doi.org/10.1016/j.scitotenv.2013.03.036
[9] Hao, F.H., Cheng, L.Q., Liu, C.M. and Dai, D. (2004) Impact of Land Use Change on Runoff and Sediment Yield.
Journal of Soil and Water Conservation, 18, 5-8.
[10] Ward, J.P., Balen, R.T., Verstraeten, G., Renssen, H. and Vandenberghe, J. (2009) The Impact of Land Use and Cli-mate Change on Late Holocene and Future Suspended Sediment Yield of the Meuse Catchment. Geomorphology, 103, 389-400. http://dx.doi.org/10.1016/j.geomorph.2008.07.006
[11] Nunes, A.N., Almeida, A.C. and Coelho, C.A.O. (2011) Impacts of Land Use and Cover Type on Runoff and Soil Ero-sion in a Marginal Area of Portugal. Applied Geography, 31, 687-699. http://dx.doi.org/10.1016/j.apgeog.2010.12.006
[12] Blavet, D., Noni, G.D., Bissonnais, Y.L., Leonard, M., Maillo, L., Laurent, J.Y., et al. (2009) Effect of Land Use and Management on the Early Stages of Soil Water Erosion in French Mediterranean Vineyards. Soil and Tillage Research, 106, 124-136. http://dx.doi.org/10.1016/j.still.2009.04.010
[13] Cai, T., Li, Q.F., Yu, M.X., Lu, G.B., Cheng, L.P. and Wei, X. (2012) Investigation into the Impacts of Land-Use Change on Sediment Yield Characteristics in the Upper Huaihe River Basin, China. The Physics and Chemistry of the Earth, 53-54, 1-9. http://dx.doi.org/10.1016/j.pce.2011.08.023
[14] Ouyang, W., Skidmore, A.K., Hao, F. and Wang, T. (2010) Soil Erosion Dynamics Response to Landscape Pattern.
Science of the Total Environment, 408, 1358-1366. http://dx.doi.org/10.1016/j.scitotenv.2009.10.062
[15] Ouyang, W., Hao, F.H., Skidmore, A.K. and Toxopeus, A.G. (2012) Soil Erosion and Sediment Yield and Their Rela-tionships with Vegetation Cover in Upper Stream of the Yellow River. Science of the Total Environment, 409, 396- 403. http://dx.doi.org/10.1016/j.scitotenv.2010.10.020
[16] Wu, Y. and Chen, J. (2012) Modeling of Soil Erosion and Sediment Transport in the East River Basin in Southern China. Science of the Total Environment, 441, 159-168. http://dx.doi.org/10.1016/j.scitotenv.2012.09.057
[17] Xu, J.C., Zhang, P.F. and Wang, Y.H. (2003) Land Use and Land Cover in Lancang Watershed of Yunnan. Acta Bota-nica YunnaBota-nica, 25, 145-154. (In Chinese)
[18] Dong, S.C., Zhou, C.J. and Wang, H.Y. (2002) Ecological Crisis and Countermeasures of the Three Rivers’ Head-stream Regions. Journal of Nature Resources, 17, 713-719. (In Chinese)
[19] Yao, H.R., Yang, Z.F. and Cui, B.S. (2006) Spatial Analysis on Soil Erosion of Lancang River Watershed in Yunnan Province under the Support of GIS. Geographical Research, 25, 421-425. (In Chinese)
[21] Jones, R.N., Chiew, F.H.S., Boughton, W.C. and Zhang, L. (2006) Estimating the Sensitivity of Mean Annual Runoff to Climate Change Using Selected Hydrological Models. Advances in Water Resources, 29, 1419-1429.
http://dx.doi.org/10.1016/j.advwatres.2005.11.001
[22] Du, J.K., Qian, L., Rui, H.Y., Zuo, T.H., Zheng, D.P., Xu, Y.P. and Xu, C.Y. (2012) Assessing the Effects of Urbani-zation on Annual Runoff and Flood Events Using an Integrated Hydrological Modeling System for Qinhuai River Ba-sin, China. Journal of Hydrology, 464-465, 127-139. http://dx.doi.org/10.1016/j.jhydrol.2012.06.057
[23] Beskow, S., Mello, C.R., Norton, L.D., Curi, N., Viola, M.R. and Avanzi, J.C. (2009) Soil Erosion Prediction in the Grande River Basin, Brazil Using Distributed Modeling. Catena, 79, 49-59.
http://dx.doi.org/10.1016/j.catena.2009.05.010
[24] Romanowicz, A.A., Vanclooster, M., Rounsevell, M. and Junesse, I.L. (2005) Sensitivity of the SWAT Model to the Soil and Land Use Data Parametrisation: A Case Study in the Thyle Catchment, Belgium. Ecological Modelling, 187, 27-39. http://dx.doi.org/10.1016/j.ecolmodel.2005.01.025
[25] Asres, M.T. and Awulachew, S.B. (2010) SWAT Based Runoff and Sediment Yield Modelling: A Case Study of the Gumera Watershed in the Blue Nile Basin. Ecohydrology & Hydrobiology, 10, 2-4.
http://dx.doi.org/10.2478/v10104-011-0020-9
[26] Baker, T.J. and Miller, S.N. (2013) Using the Soil and Water Assessment Tool (SWAT) to Assess Land Use Impact on Water Resources in an East African Watershed. Journal of Hydrology, 486, 100-111.
http://dx.doi.org/10.1016/j.jhydrol.2013.01.041
[27] Hydrological Stations in Yunnan Province (1985) The Hydrological Data of South Tibetan and West Yunnan. Hydro-logical Stations in Yunnan Province Publisher, Yunnan Province.
[28] Neitsch, S.L., Arnold, J.G., Kiniry, J.R. and Williams, J.R. (2005) Soil and Water Assessment Tool (SWAT) Theoreti-cal Documentation. Blackland Research Center, Texas Agricultural Experiment Station and Grassland, Soil and Water Research Laboratory, Temple, TX.
[29] Nash, J.E. and Sutcliffe, J.V. (1970) River Flow Forecasting through Conceptual Models Part I—A Discussion of Prin-ciples. Journal of Hydrology, 10, 282-290. http://dx.doi.org/10.1016/0022-1694(70)90255-6
[30] Zhang, S.H., Liu, Y. and Wang, T.W. (2014) How Land Use Change Contributes to Reducing Soil Erosion in the Jial-ing River Basin, China. Agricultural Water Management, 133, 65-73. http://dx.doi.org/10.1016/j.agwat.2013.10.016