Vision based Assistance for Vehicular Navigation
Sajal Garg
Department of Computer Science, Jaypee Institute of Information and Technology, Noida, India
Arpit Kulshrestha
Department of Computer Science, Jaypee Institute of Information and Technology, Noida, India
ABSTRACT
Autonomous vehicle system is a demanding application in our daily lives. With increasing number of road accidents, loss to life and property has increased the demand of autonomous technology in vehicles. The interaction between the driver and system should aid the driving process without interfering with safety and ease of vehicle operation. The system must be optimum so that it can come into existence in Real-World. This research focuses on the development of the assistance system where a machine vision system is used as a detector for the automated steering system to extract information.
General Terms
Computer Vision, Machine Learning, Image Processing, Vehicular Navigation
Keywrds
Vehicle Assistance System
1.
INTRODUCTION
Road accidents kill about 400 thousand people each year in India. Up to 80% of these accidents are caused by driver faults. Driver Assistance System may help reduce this huge number of human fatalities. An assistance system with the help of lane detection and cars & pedestrian detection is designed.
In this work, the development of a driver assistance system is provided. It consists of 4 modules: Lane detection, Vehicle detection, pedestrian detection and creation of an assistance system from data gathered by lane, vehicle and pedestrian detection [1].
For Lane detection [2], which can extract required lane parameters for automated steering systems, is presented. This work introduces methods where the offset between the left lane marker and the longitudinal axis of the vehicle, and the angle between the left lane marker and the longitudinal axis of the vehicle are calculated. First, a single image is acquired and a sequence of image processing operations is used to filter unwanted visual information which affects the output image. These image operations include: setting of region of interest (ROI), adaptive thresholding, image equalization, and line finder. The perspective error caused by the camera position in the car is also tackled by mapping of the image. The calibrated image is in the form of inverse perspective. The lane parameters are then calculated from this image.
For Vehicle/pedestrian detection, Haar-like feature detector is used to detect vehicles and pedestrians. Haar-like feature detector is used because it is fast and efficient. Template matching methods do not succeed to use in real-time system [3, 4]. The execution time of the methods is proportional to the number of templates used. That is, the execution time increases with more templates. However, Haar-like feature detector searches the frame once. The detector also generates false positive because the detector models the various shapes
of the vehicles. If focus is only on the shapes of the cars in the training data set, the detector easily finds those cars. However, the detector may fail to find the cars which are not trained. It is dangerous for the autonomous vehicle. Thus, the constraints of the detector are loosened and some false positive detection is received. Many false positive rectangles (or detections) can be filtered out, when the image based on the context of the scene is processed.
It is assumed that the size of the car has certain ranges. If the car is located near the vanishing point (upper part of the gathered image), the size should be small. If the car located at the bottom of the frame, the size should not be small as the car near to you always seems big in comparison with the car far from you. And any car cannot be on the sky too. With this simple method, the false positive detections are filtered out.
For Assistance System, information from the lane detection system and vehicle detection system is used. Frame is taken as matrix of 3X3 and other vehicles are mapped onto it to know the position of other vehicles relative to our vehicle, thus knowing the state of surrounding [5].
2.
DESIGN AND DEVELOPMENT
2.1
Basic Design
2.1.1
Image Acquisition
The acquired image is the grey scale image which is an 8-bit unsigned integer representing grey scale values between 0 and 255. For initial working, the vehicle speed has been limited to 20Km/h. By limiting the speed of the vehicle, all of the processes involved are well contained in the real-time conditions.
2.1.2
Snap Image
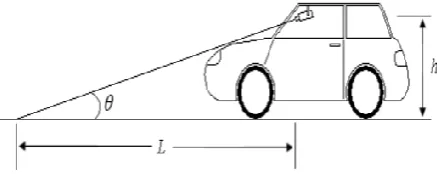
This step is an initialization stage, where a single image is snapped. Before the image can be snapped, the camera setting including its angle, focal length, and aperture opening are tuned. The angle of the camera position is determined by measuring the longitudinal distance on the ground from the camera to a look-ahead distance, L, and the distance from the camera to the ground, h. The angle of the camera position, θ, can be calculated by θ = . The placement of camera
[image:1.595.319.538.638.725.2]inside the car is shown in Figure 1.
2.2
Module 1 (Lane Detection)
2.2.1
Setting the Region of Interest (ROI)
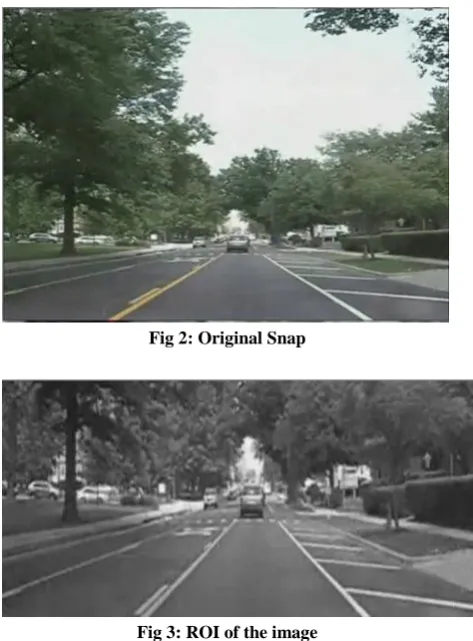
[image:2.595.317.558.73.494.2]A region of interest (ROI) is an area of an image on which image analysis and processing are performed. Neither the ROI nor the pixel size of ROI is fixed, and it is totally dependent on the camera settings. Figure 2 shows the original image acquired from the camera. There is a 57 % reduction of the image size, which will help to reduce the load on the CPU and will also reduce the processing time. In addition, by setting the ROI, fault lane detection can be reduced; as all unwanted objects are filtered before being processed by other image processing operations. ROI of the image is shown in Figure 3.
Fig 2: Original Snap
Fig 3: ROI of the image
2.2.2
Image Calibration
The camera position projected to the look-ahead distance location creates perspective error in the image. This error is nothing but the elongated view of the road, which when analysed for extraction of parameters, does not provide raw image for processing. This perspective error has to be corrected to provide accurate lane parameter extraction [6]. Figure 4 shows the difference between a normal image and an image with perspective errors. Fig 4(a) shows the image where a camera is positioned from inside the car at angle θ (after setting ROI). Fig 4(b) shows the calibrated image ready for the extraction of the data about lane markers etc and its processing.
Fig 4(a): ROI of the Image
Fig 4(b): Calibrated Image
2.2.3
Image Analysis and Processing
There are several image analyses and processing operations involved in the lane detection software. All of these operations are applied to the 8-bit images acquired by the camera. These operations consist of Equalizer histogram, calculations of adaptive thresholding, binary morphology, and line finder.
The Equalizer histogram is a basic image-processing function that highlights details in areas containing significant information at the expense of other areas [7]. An Equalizer histogram converts input grey-level values from the source image into other grey-level values in the transformed image. Equalizer histogram used in this research is based on the exponential correction where it expands high grey-level ranges while compressing low grey-level ranges. When using this, the transformations decrease the overall brightness of an image and increase the contrast in bright areas at the expense of the contrast in dark areas. Lane markers have high grey-level values, while the background has low grey grey-level value. Therefore, this transformation is well suited with the lane detection software as the contrast of the lane markers are enhanced while the background brightness is decreased.
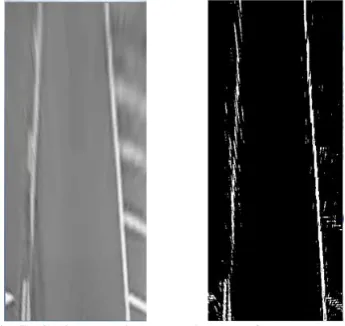
[image:2.595.53.290.225.546.2]software takes advantage of this by using the mean grey level value to change the lower range of the thresholding value since the type of acquired image is grey scale image which has grey-level values ranging from 0 to 255. The lane detection software is set to add 5 grey-level value to the calculated mean grey-level value while the upper thresholding range is set to 250. Figure 5 shows conversion from calibrated image to image after threshold.
Fig 5: Calibrated image to image after threshold
[image:3.595.80.253.165.328.2]After the thresholding process is completed, the image is transformed into a binary image. A binary image is an image containing particle regions with pixel values of 1 and a background region with pixel values of 0. The resulting binary image may contain unwanted information, such as noise particles on the road surface, particles touching the lane markers, and incomplete lane markers. Binary morphological functions can remove this unwanted information, thus improving the information in the binary image. We have used the erosion function to improve the binary image. Erosion eliminates pixels isolated in the background and erodes the contour of particles according to the template defined by the structuring element. A square 3x3 structuring element has been chosen in the erosion process. Figure 6 shows output image after erosion
Fig 6: Image after Erosion
The lane detection is done based on line finder principles. Consequently, the binary image produced after the binary morphological process needs to be transformed back into a grey scale image, because the line finder cannot be applied on a binary image. Basically, it locates discontinuities in the grey-level value of an image. The discontinuities are typically associated with the abrupt changes in grey-level values that characterize the boundaries of objects in a scene. To minimize the error, a different searching direction is applied on each lane. First, the ROI is divided into two regions; the left region
and the right region. From these regions, algorithm will search the vertical lines in each region for discontinuities in the grey-level values. After all the edges are found, curve fitting is applied to form the best fit line. This line represents the road lane markers. Fig 7 shows the road lane markers as the output of the line-finder. The left marker is chosen as the dominant lane. The detected right lane marker is used when the left lane marker cannot be found. Markers from previous frame are used when no marker is found on the current frame.
Fig 7: Left and right Lane markers
2.2.4
Lane Parameters Extraction
Since the image has been calibrated and the lines are detected, the offset between the left lane marker and the longitudinal axis of the vehicle, Ly, and the slope of the lane S can be
calculated directly. Ly is calculated by locating the first pixel
coordinates at the uppermost point of the detected left lane marker. The distance between the first pixel location and the longitudinal axis of the vehicle or the virtual centre line which separated the ROI into two regions is the Ly. As for S, the
slope is calculated by treating the lane as a geometric line and finding coordinates of both points, hence finding slope
2.3
Module 2 (Vehicle Detection)
We have used Haar-like feature detector to detect vehicles. Haar-like features are digital image features used in object recognition. They owe their name to their intuitive similarity with Haar wavelets and were used in the first real-time face detector.
2.3.1
Haar-like Feature Detector
We use Haar-like feature detector and AdaBoost to detect the cars. Viola and Jones suggest AdaBoost into computer vision [8, 9].
2.3.2
Haar-like Feature
[image:3.595.353.503.178.393.2]2-rectangle feature can indicate where the border lies between a dark region and a light region.
We use three kinds of Haar feature. Denote the feature set as F = fi|i = 1...N and the corresponding feature values on
images observation z as V(z) = Vi(z)|i = 1....N.
The number of features even in a 24 by 24 image patch is so huge to calculate them every time. However, we may easily calculate them if we have an accumulated sum of intensity from origin.
If a rectangle is defined by the region
, the sum of intensity in the rectangle is
following.
2.3.3
Learning with AdaBoost
A Haar-like feature is a classifier because a feature can classify the whole group of images into positive image and negative ones. We use the Haar-like feature as a weak classifier of AdaBoost algorithm, as the Viola and Jones did it for face detection. Even if a feature satisfies a simple criteria (the error ratio is less than a guess (0.5)), we can use the feature as a weak classifier. If we have n week classifiers those error ratio are e1, e2, e3... en respectively, the total error ratio is bounded by following:
To train the car image, we use 500 positive images from data sets (Cars 1999(Rear) 2 and MIT CBCL). The positive images are carefully aligned, because Haar-like feature is sensitive to the alignment. We use 700 negative images that are cropped from the normal road such as road, curb, trees and buildings. In the test set, 91% of cars are correctly detected and 9% of cars are missed.
2.3.4
Gathering Required Data
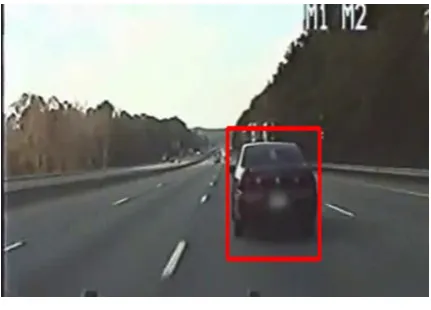
With the help of Haar like feature detector cars can be detected. One rectangle is drawn on all the detected cars. Figure 8 shows the output. Prior information such as viewpoint (vanishing point and height from the road) is used to impose context. The information can be used to verify the hypothesis generated from the detectors. To simplify the process, only the size of rectangles (or window) is considered based on the location in the image. Intuitively the window should be large if the window is located on the bottom of image. The window should be small if the window is near the vanishing point.
Moreover, there is no window for the car above the vanishing point. The vanishing point (Vpx, Vpy) is found by hough
transform. If the bottom of a rectangle is on y = Yheight, the
size of rectangle is proportional to the Yheight − Vpy (when
Yheight > Vpy). We estimate the probability of size of window
based on the location as following.
[image:4.595.315.531.112.267.2]
If the probability of a hypothesis (rectangle) is so small, the rectangles are rejected.
Figure 8: Vehicle Detection
2.4
Module 3 (Pedestrian Detection)
[image:4.595.316.541.409.540.2]Pedestrians are also detected with Haar-like Feature Detector as vehicles are detected. To train the pedestrian image, 400 positive images from data sets (NICTA pedestrian dataset) are used. The positive images are carefully aligned, because Haar-like feature is sensitive to the alignment. 700 negative images are used that are cropped from the normal road such as road, curb, trees and buildings. In the test set, 94% of pedestrians are correctly detected and 6% of them are missed. Output is shown by Figure 9.
Figure 9: Pedestrian and vehicle detection
2.5
Module 4 (Assistance System)
After Collecting and processing all the required information about the road, vehicles, pedestrians an assistance system is designed which helps the driver in the driving process by telling various steps whether the driver should take like turn left, turn right, overtake , move left , move right, brake etc.
2.5.1
Processing Lane information
By processing lane data information about the turns, vehicle going off-road etc. is gathered. After detecting lane markers the slope of both the lane markers from the x, y coordinate of each lane can be calculated.
2.5.1.1
Alert for Left / Right Turn
slope value under various conditions, after which particular alert must be given
.
If the slope is positive and is more than right threshold then driver is assisted by alert for right turn.
If the slope is negative and is less than left threshold then driver is assisted by alert for left turn.
2.5.1.2
Alert for Off-road
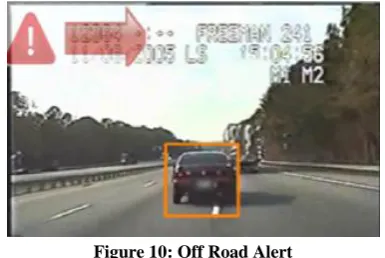
Off-road alert is given when the car moves out of the lane either to left or right side.
For off road/off lane alerts the lower x, y coordinates of the lane markers are used. Again, the threshold coordinate (left and right) are calculated after which alert must be given i.e. whether the vehicle is going off road or not. Threshold coordinates can be found by taking values under various conditions and choose appropriate values.
[image:5.595.315.544.156.298.2]If the left coordinate is more than left threshold then driver is assisted by giving alert for moves right as shown in figure 10. If the right coordinate is less than right threshold then driver is assisted by giving alert for left moves.
Figure 10: Off Road Alert
2.5.2
Processing vehicle/pedestrian information
By processing other vehicles and pedestrian data we can get information about the road traffic, when to apply brakes, when to overtake etc.
Firstly, we divide the input image into the matrix of 3X3 as shown in figure 11.
1
2
3
4
5
6
[image:5.595.70.263.315.444.2]7
8
9
Figure 11: 3 X 3 matrix
Value inside each box represents the block number in the image.
Code 2 and 8 represents block far from our vehicle and near our vehicle respectively.
For every other vehicle, block code is found, and with the help of block code, calculations can be made.
If the vehicle/pedestrian is located at block code 8, it means the vehicle/pedestrian is very close to the vehicle, assistance for applying brake is given as shown in figure 12.
If the vehicle/pedestrian is located at block code 5 and neither at 4 nor at 1, it means driver can overtake. Hence, assistance to overtake is given. (According to American traffic rules)
Figure 12: Assistance for Brake
If the vehicle/pedestrian is located at block code 1, 2, 3 means that the vehicle is quite far hence, there is no need for special assistance.
[image:5.595.320.536.386.546.2]If the vehicle/pedestrian is located at block 6, means that straight route is clear hence, assistance to move straight is given as shown in Figure 13.
Figure 13: Assistance to go straight
3.
RESULTS
In this research, development of the assistance system is carried out that helps the driver in its driving process. For this, the whole process is divided into 4 modules and worked on. On running, program shows the acceptable result as it gather the data of surrounding quite correctly and gives correct assistance too with the help of the beep and signs on the output screen.
In lane detection module, accuracy is shown in table 1.
Table 1: Lane Detection Results Route Total Lanes Detected
correctly
Rate of lane detection(in %)
1 400 324 81
[image:5.595.97.239.551.669.2]In Vehicle detection module, accuracy is shown by table 2 Table 2: Vehicle Detection Results Route Total
Cars
Cars Detected Rate of Car detection(in %)
1 23 25 109
2 26 29 115
In Table 2 Number of cars detected is more than the actual number of cars because detector also generates false positive. If focus is only on the shapes of the cars in the training data set, the detector easily finds those cars. However, the detector may fail to find the cars which are not trained. It is dangerous for the autonomous vehicle. Thus, the constraints of the detector are loosened and received some false positive detection.
From the above tables above, the results of the vehicles and the road detection are acceptable. The application can be used to create product with the help of single camera, output screen and some sort of CPU which can be installed in the car and used as the assistance system.
4.
LIMITATION AND FUTURE WORKS
Even though the program shows an acceptable result, some of the limitation and problems are detected. Future research will be conducted to solve the current dilemmas.
Detection of traffic lights can also be done. Detection and recognition of the different on road traffic directions available on road – side and overhead road holdings can also be included. Detection of in-vehicular conditions of driver and alarming in case of negligence on his behalf can also be a matter of concern. Detection of Road conditions for the safe vehicular driving and estimating driving specifications for driver can also be included in this system.
5.
CONCLUSION
The developed driving assistance system is capable of extracting the surrounding parameters under various conditions and helps the driver with appropriate output. The software runs continuously without any software crashes, and it runs in real-time mode. Even though there are some limitations that it cannot detect lighting system found on
highway and urban roads, the software can deliver, whatever it is designed for. Additional useful research can be conducted by using the output from this research to study automated steering system, assistance system which detects all aspects of the road and surrounding includes traffic lights, animals etc.
6.
References
[1] Guanglin Ma,” Visionbased pedestrian detection -reliable pedestrian candidate detection by combining IPM and a 1D profile”, IEEE Intelligent Transportation Systems Conference, pp.137-142, 2007.
[2] Minghao Hu, “A vision based road detection algorithm”, IEEE Conference on Robotics, Automation and Mechatronics, pp. 846-850, 2004.
[3] Yongquan Xia,” A Novel On-Road Object Detection Approach Based on Vision”, International Conference on measuring Technology and Mechatronics Automation, ICMTMA '09, 2009
[4] Li-Chen Fu,” Computer Vision Based Object Detection and Recognition for Vehicle Driving”, IEEE International Conference on Robotics and Automation, pp. 2634-2641, 200q.
[5] Ming Huang,” Research on Autonomous Driving Control Method of Intelligent Vehicle Based on Vision Navigation”, International Conference on Computational Intelligence and Software Engineering (CISE), pp. 1-7, 2010
[6] Aly, M ,” Real time detection of lane markers in urban streets”, IEEE Intelligent Vehicles Symposium, pp.7-12, 2008
[7] Bertozzi, M.,” GOLD: a parallel real-time stereo vision system for generic obstacle and lane detection”, IEEE Transactions on Image Processing, pp. 62-81, 1998 [8] Khammari, A,” Vehicle detection combining gradient
analysis and AdaBoost classification”, IEEE Intelligent Transportation Systems, pp. 66-71, 2005