http://dx.doi.org/10.4236/ojcm.2014.43017
The Studies on the Surface Organic
Modification of Tourmaline Powder
with Stearic Acid and Its Composite
Yingmo Hu
School of Materials Science and Technology, China University of Geosciences, Beijing, China
Email: huyingmo@163.com
Received 9 May 2014; revised 9 June 2014; accepted 25 June 2014
Copyright © 2014 by author and Scientific Research Publishing Inc.
This work is licensed under the Creative Commons Attribution International License (CC BY).
http://creativecommons.org/licenses/by/4.0/
Abstract
Stearic acid modified tourmaline powder had been investigated to improve the compatibility and dispersed stability between tourmaline and polymer matrix. The experimental results indicated that the activation index was 100% and contact angle reached 120˚ when the ratio of the ore slur-ry is 5:50, the dosage of stearic acid and p-toluenesulfonic acid is 10% and 0.5% (of tourmaline powder’s quantity) respectively with reaction at 80˚C for 6.0 h, and the modified tourmaline exhi-bited an excellent hydrophobic property. The introduction of stearic groups reduced the reunion of tourmaline particles clearly and improved the dispersivity in polymers, and the amount of neg-ative ions released of modified tourmaline increased obviously for both modified tourmaline powders and its composite with polyamide-66 compared to the unmodified tourmaline. Moreover, the structure of modified tourmaline was also characterized by means of Fourier Transform infrared spectroscopy, X-ray diffraction, thermal gravimetric analysis, scanning electron micro-scope.
Keywords
Tourmaline, Stearic Acid, Surface Modification, Negative Ion, Composites
1. Introduction
health-care products or special light & electrical functional materials [6]-[8].
Generally, tourmaline powders and polymers are in poor compatibility due to their different surface properties. The poor dispersity of tourmaline, especially in a non-polar polymer matrix, can always reduce the mechanical properties, and thus leading to low overall performance of the material [9]. Therefore, organic surface modifica-tions are requisite to improve the compatibility and dispersion stability between tourmaline and the polymer-re- sin matrix [10]. Recently, the organic modification of tourmaline is very active and receiving the attentions of scientists and engineers [11] [12]. Accordingly, some related applications have been advanced, e.g. the far-in- frared radiation and negative oxygen ions released functional materials [13] [14].
In this study, we report our investigation on the reactivity between tourmaline powders and stearic acid, in which the activation index and contact angle are the two major experimental parameters that we concerned on, and the tourmaline/PA-66 composites combined with a polar polymer polyamide-66. The structure of modified tourmaline was characterized, and the amounts of negative ions released by modified tourmaline powders and its composite have been measured quantitatively.
2. Experimental Procedures
2.1. Materials and Instruments
Tourmaline powder with diameters of d50 1.75 mm and d97 5.23 mm (purity 98%) was purchased from Yanxin
Mineral Company Limited, Hebei, China; stearic acid (analytical reagent) was obtained from West Long Chem-ical Company; and liquid paraffin (chemChem-ical pure), ethanol (analytChem-ical reagent), acetone (analytChem-ical reagent), to-luene (analytical reagent) and p-toluenesulfonic acid (analytical reagent) were purchased from Beijing Chemical Reagent Factory, and polyamide-66 was purchased from Pindingshan Shenma Engineering Plastics Company Limited.
The testing devices included a Perkin Elmer Spectrum 100 Fourier transform infrared (FTIR) spectrometer (Shanghai Company) and a Rigaku D/max-rA 12 kw X-ray diffractometer (XRD) (Japan). Scanning electron microscope (SEM) images were observed on a Hitachi Model S-450 scanning electron microscope, and the DSA100M optical measurement (Zhongchen Digital Technology & Instrument Company, Shanghai) was used for the measurements of the contact angles. Thermal gravimetric analysis (TGA) was analyzed with Q500 Thermogravimetric Analyser (TA instrument Company, American); And the amount of negative ions released were measured on the AIC1000 negative ion concentration tester (Alphalab Company, American).
2.2. Experimental Method of Stearic Acid Modified Tourmaline
In a 100 ml three-neck flask, 5 g of super-fine tourmaline powder and stearic acid in 50 ml of toluene was stirred adequately, then p-toluenesulfonic acid was added into flask, reacted at 80˚C for 5 h. The samples were sepa-rated by centrifugation, washed three times with ethanol and acetone, and finally dried and ground prior to cha-racterization.
2.3. Characterization
2.3.1. The Measurement of Contact Angle
The sample was pressed into a circle using a press, and distilled water was then dripped onto the surface of the sample to evaluate the contact angle using optical measurements. Each value was averaged over three tests.
2.3.2. The Determination of the Activation Index
The activation index of the modified tourmaline was determined according to the HG/T2567 standard (former Ministry of Chemical Industry). In a 100 ml beaker, 1.0 g of modified tourmaline (M0) in 50 ml of water was
stirred for 5 min and allowed to stand statically for 5 h. The turbid solution in the middle of the beaker turned clear, and the powders floating on top of the solution were collected, dried and weighed as M1. The activation
index was calculated as follows:
( )
[
1 0]
3. Results and Discussion
3.1. The Influence of the Reaction Conditions on the Modification of Tourmaline Powder
The modification effect of tourmaline powder under various conditions such as the quantity of stearic acid and p-toluenesulfonic acid, reaction temperature and time were studied by focusing on the experimental parameters of the activation index and contact angle.3.1.1. The Influence of the Amount of Stearic Acid
The influence of the amount of stearic acid is shown in Figure 1. Both curves indicate that the activation index and contact angle of modified tourmaline increase sharply at first and then trend to fall a bit with increasing of the amount of stearic acid, and reached their maximum values when the weight ratios of stearic acid to tourma-line was 0.5:5.
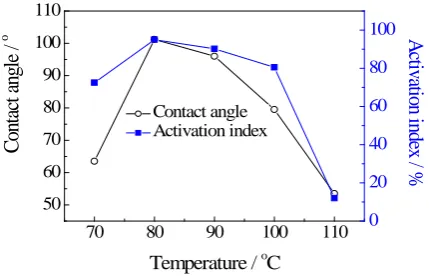
3.1.2. The Influence of the Reaction Temperature
The influence of the reaction temperature is displayed in Figure 2. The results showed that the activation index and contact angle of modified tourmaline first increase and then decrease quickly with the raise of reaction tem-perature. The maximum values appeared at 80˚C. Therefore, the temperature of 80˚C was selected as the opti-mum reaction temperature.
3.1.3. The Influence of the Reaction Time
The influence of reaction time on the modification of tourmaline is plotted in Figure 3. The both curves demon-strated that the activation index and contact angle of modified tourmaline first rise rapidly and then drop with prolonging the reaction time, and reach their maximum values at 6 h. Therefore, 6 h was chosen as the optimum reaction time for further experiments.
0.0 0.2 0.4 0.6 0.8 1.0 1.2 1.4 0 20 40 60 80 100 Contact angle Activation index
Weight ratios of stearic acid to tourmaline
[image:3.595.206.421.385.526.2]C
ont
ac
t
angl
e
/
o
0 20 40 60 80 100A
cti
va
tion
inde
x /
%
Figure 1. Effect of weight ratios of stearic acid to tourma-line.
70 80 90 100 110
50 60 70 80 90 100 110 Contact angle Activation index
Temperature / oC
C
ont
ac
t a
ngl
e /
o 0 20 40 60 80 100A
cti
va
tion
inde
x /
%
[image:3.595.206.421.567.707.2]3.1.4. The Influence of the Amount of p-Toluenesulfonic Acid
The influence of the amount of p-toluenesulfonic acid on the modification of tourmaline is presented in Figure 4. Both the activation index and contact angle of the modified tourmaline exhibit similar trends with respect to the amount of p-toluenesulfonic acid and reach their maximum values at 0.5% (of tourmaline powder’s quantity). Therefore, 0.5% was selected as the optimal amount of p-toluenesulfonic acid for further experiments.
3.1.5. The Influence of the Mass Ratios of the Ore Slurry
The mass ratios of tourmaline to solvent also have impact on the modification of tourmaline, which is illustrated
in Figure 5. The curves indicated that the activation index and contact angle of the modified tourmaline sharply
increase with increasing the amounts of tourmaline before the mass ratio of tourmaline to solvent reaches 5:50. After this point, the activation index and contact angle level off and then decrease with further increases in the mass ratio, because of the reaction efficiency of tourmaline with stearic acid has dropped for stearic acid could not contact with tourmaline sufficiently while the mass ratios of the ore slurry increased. The optimum mass ra-tio of tourmaline to solvent is therefore 5:50. The activara-tion index of the modified tourmaline is 100% and its contact angle reaches 120˚, which exhibit excellent hydrophobic properties.
3.2. The Structural Characterization of Modified Tourmaline
The structure of modified tourmaline was characterized by IR spectra, XRD analysis, SEM images and so on.
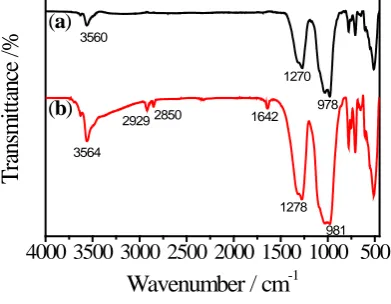
3.2.1. IR Spectra
Figure 6 shows the IR spectra of unmodified and modified tourmaline, in which the unmodified tourmaline [15]
exhibits absorption bands at 3560 cm−1 (-OH group), 1270 cm−1 (B-O group) and 978 cm−1 (Si-O group). Com-pared with Figure 6(a), the IR spectrum of modified tourmaline (Figure 6(b)) shows new absorption bands of methyl (2929 cm−1), methylene (2850 cm−1) and carbonyl (1642 cm−1) groups, which indicates that stearic acid reacts with the hydroxyl groups on the surface of tourmaline to produce the stearate of tourmaline. The carbonyl
2 4 6 8 10
50 60 70 80 90 100 Contact angle Activation index
Reaction time / h
[image:4.595.204.420.406.706.2]C ont ac t a ngl e / o 0 20 40 60 80 100 A cti va tion inde x / %
Figure 3. Effect of reaction time.
0 2 4 6 8
40 50 60 70 80 90 100 110 120 Contact angle Activation index
The amount of p-toluenesulfonic acid / %
C
ont
ac
t a
ngl
e
/ o
0 20 40 60 80 100A
cti
va
tion
inde
x /
%
0.05 0.10 0.15 0.20 0.25 0.30 104 108 112 116 120 Contact angle Activation index
Weight ratios of tourmaline to solvent
[image:5.595.205.421.86.223.2]C ont ac t angl e / o 95 96 97 98 99 100 A cti va tion inde x / %
Figure 5. The influence of weight ratios of tourmaline to solvent.
4000 3500 3000 2500 2000 1500 1000 500
981 1278
978 1270
(
b
)
(
a
)
T
ran
sm
it
tan
ce /
%
Wavenumber / cm
-13560
3564
2929 2850 1642
Figure 6. IR spectra of unmodified (a) and modified (b) tourmaline.
band exhibits a red shift because of the electric effect of the metal ions on the surface of tourmaline. Other peaks (e.g., the B-O and Si-O bands) are also red shifted for a few wave numbers and broadened. These results indi-cate that stearic groups were introduced onto the surface of the tourmaline by the reaction of stearic acid with tourmaline powder (Equation (1)), and therefore the hydrophobic properties of tourmaline were improved.
CH3(CH2)15CH2COO H HO Tourmaline
CH3(CH2)15CH2 C O Tourmaline O
+
(1)
3.2.2. XRD Patterns
The XRD patterns of unmodified and modified tourmaline are shown in Figure 7(a) and Figure 7(b), respec-tively. The major peaks of unmodified tourmaline appeared at 2θ angles of 13.8˚, 21.0˚, 22.0˚, 25.5˚, 26.7˚, 30.3˚, 34.7˚, 44.3˚, 47.1˚, 55.3˚, 57.7˚, 61.5˚ and 63.9˚. The major peaks of the modified tourmaline were located at the same 2θ angles with no other phases being detected. These results demonstrate that the modifications of tourma-line with stearic acid only altered the surface properties of tourmatourma-line, and the crystal structure of tourmatourma-line remains unchanged.
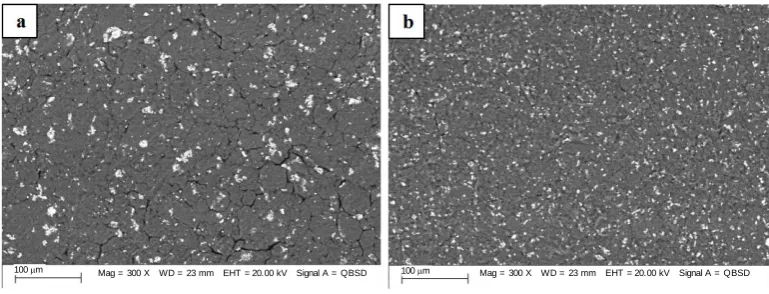
3.2.3. SEM Images
[image:5.595.215.411.266.418.2]the surface polarity of the tourmaline was reduced after the organic modification, thereupon the surface energy was depressed, thus the dispersivity of the tourmaline particles was improved.
[image:6.595.219.408.205.338.2]3.2.4. TGA Curves
Figure 9 showd the TGA curves of unmodified and modified tourmaline. The TGA curve of modified
tourma-line (Figure 9(b)) exhibits a significantly greater weight loss in the temperature range of 138˚C - 380˚C com-pared with the unmodified tourmaline (Figure 9(a)). The organic chains introduced onto the surface of line particles decomposed easily in this temperature range, indicating that stearic acid had reacted with tourma-line resulting in the introduction of the hydrophobic alkyl chain, which also corresponded to the IR analysis.
10 20 30 40 50 60 70
CP
S
2
θ
/ o [image:6.595.146.485.378.523.2](a) (b)
[image:6.595.216.409.555.696.2]Figure 7. XRD spectra of unmodified (a) and mod-ified (b) tourmaline.
Figure 8. SEM images of unmodified (a) and modified (b) tourmaline.
100 200 300 400
98.0 98.5 99.0 99.5 100.0
(b) (a)
W
eig
ht / %
Temperature / %
Figure 9. The TGA curves of unmodified (a) and modified (b) tourmaline.
3.3. Performance Characterization
3.3.1. The Mensuration of the Negative IonsThe amount of negative ions released from the unmodified and modified tourmaline was listed in Table 1. From the data in the table, the amount of negative ions released by tourmaline modified with stearic acid is more than 2.69 times greater than that released by the unmodified tourmaline. These results indicate that the surface energy of the organic-modified tourmaline particles was reduced, aggregation of the particles decreased and the surface area of tourmaline particle increased, which resulted in an increased amount of released negative ions.
3.3.2. The Dispersancy of Tourmaline in Polyamide-66 (PA-66)
In order to evaluate the dispersancy of modified tourmaline in a polymer, the composites of modified tourmaline and unmodified tourmaline with polyamide-66 (PA-66) were prepared, and characterized by SEM images and by the detection of the release of negative ions.
1) The preparation of tourmaline/PA-66 composites
Tourmaline (5% of PA-66 dosage) was added to a flask that contained PA-66 dissolved in dimethyl sulfoxide (DMSO) and stirred for 40 min at 170˚C. The mixture was cooled and poured into the distilled water with stirred quickly, then filtrated and washed three times with distilled water, dried to get the tourmaline/PA-66 composite.
[image:7.595.120.505.480.627.2]2) SEM analysis of tourmaline/PA-66 composites
Figure 10 indicates that the unmodified tourmaline images display some aggregation matrix in PA-66,
whe-reas the modified tourmaline images show that the sample was homogeneously dispersed in PA-66. The excel-lent dispersion in PA-66 of modified tourmaline was because that the stearic groups were introduced onto the surface of tourmaline by the reaction of stearic acid with tourmaline powder (Equation (1)), which favored its dispersion in polymer. This result is consistent with the previously discussed experimental results of the activa-tion index and contact angle of modified tourmaline.
3) The examination of amount of negative ions released of tourmaline/PA-66 composites
The amount of negative ions released by tourmaline/PA-66 composites is shown in Table 2. The data in the table reveal that the amount of negative ions released from modified tourmaline/PA-66 composite is obviously beyond that released from the tourmaline/PA-66 composite. These results indicated that the dispersancy of tourmaline was the crucial factor that affects the amount of negative ions released.
4. Summary
The activation index of modified tourmaline powder can reach 100% when tourmaline-to-solvent mass ratios is
[image:7.595.126.468.678.720.2]Figure 10. The SEM images of unmodified tourmaline/PA-66 (a) and modified tourmaline/PA-66 (b) composites.
Table 1. The amount of negative ions released by unmodified and modified tourmaline.
Sample The amount of negative ions (ions/cm3)
Tourmaline 320
Modified tourmaline 860
Table 2. The amount of negative ions released by composites of tourmaline/PA-66 and mod-ified tourmaline/PA-66.
Composites The amount of negative ions (ions/cm3)
5% tourmaline/PA-66 300
5% modified tourmaline/PA-66 500
5:50, the dosage of stearic acid and p-toluenesulfonic acid are 10% and 0.5% (of tourmaline powder’s quantity) respectively, at 80˚C for 6.0 h. The contact angle of the modified tourmaline is 120˚, which exhibits excellent hydrophobic properties for the modified tourmaline. The experimental results indicated that the stearic groups were introduced onto the surface of tourmaline by transesterification of the hydroxyl groups at the surface of the tourmaline particles with stearic acid, which improved the hydrophobic properties of tourmaline surface while keeping its crystal configuration unchanged, and reduced the reunion of tourmaline particles clearly and im-proved the dispersivity in polymers. And the amount of negative ions released by modified tourmaline increased obviously for both modified tourmaline powders and its composite with PA-66 compared to the unmodified tourmaline. The results offered an importance to prepare functional tourmaline composites.
Acknowledgements
This work is supported by the National Natural Science Foundation of China (No. 51072187, No. 51372233).
References
[1] Rieche, E. (1913) The Molecular Theory of the Piezo-Electricity of Tourmaline. Archives des Sciences Physiques et
Naturelles, 36, 101-112.
[2] Jiang, K., Sun, T.H., Sun, L.N. and Li, H.B. (2006) Adsorption Characteristics of Copper, Lead, Zinc and Cadmium Ions by Tourmaline. Journal of Environmental Sciences, 18, 1221-1225.
http://dx.doi.org/10.1016/S1001-0742(06)60066-1
[3] Eduardo, G., Sergio, A., Christian, F.L., Paolo, C., Pietro, V., Valier, G. and Maarten, L. (2011) Mineralogical and Chemical Variability of Fluvial Sediments 2. Suspended-Load Silt (Ganga-Brahmaputra, Bangladesh). Earth and Pla-
netary Science Letters, 302, 107-120. http://dx.doi.org/10.1016/j.epsl.2010.11.043
[4] Ekosse, G.I.E. (2010) Kaolin Deposits and Occurrences in Africa: Geology, Mineralogy and Utilization. Applied Clay
Science, 50, 212-236. http://dx.doi.org/10.1016/j.clay.2010.08.003
[5] Xu, H.Y., Prasad, M. and Liu, Y. (2009) Schorl: A Novel Catalyst in Mineral-Catalyzed Fenton-Like System for Dye- ing Wastewater Discoloration. Journal of Hazardous Materials, 165, 1186-1192.
http://dx.doi.org/10.1016/j.jhazmat.2008.10.108
[6] Liu, S.M., Li, D.C., Hu, W.T., Qin, G.Q. and Li, L.F. (2008) Ion-Beam Deposition of Tourmaline Film on Glass.
Journal of Non-Crystalline Solids, 354, 1444-1446. http://dx.doi.org/10.1016/j.jnoncrysol.2006.11.052
[7] Park, S.H. and Bandaru, P.R. (2010) Improved Mechanical Properties of Carbon Nanotube/Polymer Composites through the Use of Carboxyl-Epoxide Functional Group Linkages. Polymer, 51, 5071-5077.
http://dx.doi.org/10.1016/j.polymer.2010.08.063
[8] Lvov, Y. and Abdullayev, E. (2013) Functional Polymer-Clay Nanotube Composites with Sustained Release of Chem- ical Agents. Progress Polymer Science, 38, 1690-1719. http://dx.doi.org/10.1016/j.progpolymsci.2013.05.009
[9] Zhang, J., Ju, S., Jiang, D. and Peng, H.X. (2013) Reducing Dispersity of Mechanical Properties of Carbon Fiber/ Epoxy Composites by Introducing Multi-Walled Carbon Nanotubes. Composites Part B, 54, 371-376.
http://dx.doi.org/10.1016/j.compositesb.2013.05.046
[10] Bhui, D.K. and Misra, A. (2012) Synthesis of Worm Like Silver Nanoparticles in Methyl Cellulose Polymeric Matrix and Its Catalytic Activity. Carbohydrate Polymers, 89, 830-835. http://dx.doi.org/10.1016/j.carbpol.2012.04.017 [11] Harald, G.D. (2010) The “Chessboard” Classification Scheme of Mineral Deposits: Mineralogy and Geology from
Aluminum to Zirconium. Earth-Science Reviews, 100, 1-420. http://dx.doi.org/10.1016/j.earscirev.2009.10.011 [12] Jana, S., Saikia, A., Purkait, M.K. and Mohanty, K. (2011) Chitosan Based Ceramic Ultrafiltration Membrane: Prepa-
ration, Characterization and Application to Remove Hg(II) and As(III) Using Polymer Enhanced Ultrafiltration. Che-
mical Engineering Journal, 170, 209-219. http://dx.doi.org/10.1016/j.cej.2011.03.056
Geology Reviews, 34, 87-112. http://dx.doi.org/10.1016/j.oregeorev.2007.09.003
[14] Liang, J.S., Wang, L.J., Xu, G.K., Meng, J.P. and Ding, Y. (2006) Far Infrared Radiation Property of Rare Earth Min- eral Composite Materials. Journal of Rare Earths, 24, 281-283. http://dx.doi.org/10.1016/S1002-0721(07)60381-0 [15] Prasad, P.S.R. and Sarma, D.S. (2005) Study of Structural Disorder in Natural Tourmalines by Infrared Spectroscopy.
Scientific Research Publishing (SCIRP) is one of the largest Open Access journal publishers. It is currently publishing more than 200 open access, online, peer-reviewed journals covering a wide range of academic disciplines. SCIRP serves the worldwide academic communities and contributes to the progress and application of science with its publication.