http://dx.doi.org/10.4236/ajps.2014.515253
The Use of Sequence-Based SSR Mining for
the Development of a Vast Collection of
Microsatellites in Aquilegia formosa
Brandon Schlautman
1, Vera Pfeiffer
2, Juan Zalapa
1,3, Johanne Brunet
3,4 1Department of Horticulture, University of Wisconsin, Madison, USA2Department of Zoology, University of Wisconsin, Madison, USA 3USDA-ARS, VCRU, University of Wisconsin, Madison, USA
4Department of Entomology, University of Wisconsin, Madison, USA
Email: jbrunet@wisc.edu
Received 8 May 2014; revised 12 June 2014; accepted 7 July 2014
Copyright © 2014 by authors and Scientific Research Publishing Inc.
This work is licensed under the Creative Commons Attribution International License (CC BY). http://creativecommons.org/licenses/by/4.0/
Abstract
Numerous microsatellite markers were developed for Aquilegia formosa from sequences depo-sited within the Expressed Sequence Tag (EST), Genomic Survey Sequence (GSS), and Nucleotide databases in NCBI. Microsatellites (SSRs) were identified and primers were designed for 9 SSR containing sequences in the Nucleotide database, 3803 sequences in the EST database, and 2226 sequences in the GSS database. For validation purposes, 45 primer pairs were used to amplify DNA from 16 A. formosa individuals from the H. J. Andrews experimental forest in Oregon, a Long Term Ecological Research (LTER) site. Genetic polymorphisms were identified at 30 of the 45 microsa-tellite loci with an average of 13.2 alleles per locus, and the observed level of heterozygosity was greater than 0.8 for 21 of the 30 loci. The use of these polymorphic loci was sufficient to indivi-dually separate the 16 individuals using a principal coordinate analysis. This comprehensive col-lection of primers significantly increased the availability of microsatellite primers for Aquilegia spp. and provided ample material for future studies that required highly variable SSRs such as mapping and association studies and investigation of plant mating system and gene flow.
Keywords
Aquilegia formosa, Microsatellites, SSR Mining
1. Introduction
genus Aquilegia,which includes approximately 75 species with the similar number of species occurring in North America, Asia and Europe [1]. The phylogenetic relationships among species within the genus have been diffi-cult to resolve, possibly due to a rapid speciation in the group [2]-[4]. Two independent radiation events have emerged, however, one leading to the North American and the other to the European clades [1] [4].
The ecology of many Aquilegia species has been well studied and there exists ample variation in pollinators, floral traits and mating systems among species, among populations and even within populations of the same species, with evidence of some causal relationships between pollinators, floral traits and mating systems [3] [5]-[9][10]. Phenotypic plasticity exists for many of the floral traits with potential adaptive responses to global warming [11] [12]. Habitats can range from Alpine to Lowland, and can include desert springs, temperate fo-rests and rocky outcrops [1] [13]. Moreover, habitat specialization may have played a greater role in the radia-tion of columbines in Europe while pollinator specializaradia-tion has been more important in the diversificaradia-tion of North American species [1] [3].
The presence of unusual floral organs in Aquilegia species, which include sepals that have the appearance of petals (petaloid sepals), the staminodium, an additional whorl of a novel type of organ placed between carpels and stamens, and petal with a spur with nectaries found at the tip of the spurs, permits the evolutionary study of floral novelties [14] [15]. As a result of its variation in ecology, floral morphology, pollination, floral develop-ment and mating system, the genus Aquilegia is ascending to the status of model species for studies in ecology, evolution and plant development [16] [17]. To improve its usefulness as a model species, genomic tools are be-ing developed for this genus [18], including the recent release of the A. coerulea Goldsmith whole genome se-quence (http://www.phytozome.net). The plant A. coerulea Goldsmith is, however, not the wild A. coerulea spe-cies, but represents an unknown mixture of different Aquilegia species of both North American and European origins (S. A. Hodges, personal communication).
Microsatellites remain important genetic markers in many studies including genetic mapping, association mapping, investigations of plant mating systems and paternity analyses. Despite the recent development of nuc-lear tools for Aquilegia, the suitability of the primers developed for currently existing microsatellite loci [19]- [21] remains limited because some of the loci are redundant [22] and others display low levels of polymorphism [21]. In this study, we identified microsatellites (SSRs) and designed primers from the Nucleotide database, the Expressed Sequence Tag (EST) database, and the Genomic Survey Sequence (GSS) database through NCBI, and validated the screening by testing 45 of the primers using a wild A. formosa population. Our goal was to develop a larger number of microsatellite loci with a wide range of motif length and repeat number from this data mining process to facilitate well-needed studies of population genetic structure of Aquilegia species [22] [23], and to promote further investigations of the role of pollinators on plant reproductive success [24], mating system [8], floral selection and gene movement within and among populations of Aquilegia species.
2. Materials and Methods
2.1. Data Mining of SSRs
The SSR mining was performed on128,082 Aquilegia formosa nucleotide sequences publically available online through NCBI. These sequences included 106 sequences from the nucleotide database and 12,310 sequences from the genomic survey sequences (GSS) database for A. formosa, and an additional 115,666 sequences in the EST database from A. formosa × A. pubescens pooled RNA. The presence of short sequence repeats (SSRs) within these sequences was detected using SSR Locator [25]. The program parameters were set to identify and localize microsatellite motifs ranging from 1 - 10 bp and only the sequences containing motifs with repeat lengths of mono ≥ 12, di ≥ 6, tri ≥ 4, and tetra through nona ≥ 3 were considered to be SSRs.
We chose the program WebSat [26] to design the oligonucleotide primers from the SSR flanking sequences because it offers the unique ability to visualize the SSR containing sequences. This feature ensured that the pri-mer sequence did not overlap with the SSR of interest and that no pripri-mer pair contained more than one SSR. The major parameters selected for primer design were a primer length of 19 to 25 bp (optimum 22 bp), a PCR prod-uct size varying between 120 and 325 bp, a GC content between 40% and 80%, and an optimum melting tem-perature of 55˚C.
2.2. Plant Material and DNA Isolation
expe-rimental forest in Oregon, a Long Term Ecological Research (LTER) site. Permission to collect was obtained from Mark Schulze, the Director of the H. J. Andrews experimental forest. The plant species, A. formosa, is not an endangered or protected species and the coordinates for the population were 44.12656 latitude and −122.07827 longitude. Total genomic DNA from 0.1 g leaf tissue was extracted using a Macherey-Nagel (MN) Plant II kit (Düren, Germany) following the manufacturer’s instructions.
2.3. PCR, SSR Genotyping, and Diversity Analysis
TheSSR forward primers were appended with the M13 sequence (5’-CACGACGTTGTAAAACGAC-3’) to al-low indirect fluorescent labeling of reactions [27]. The reverse primers were appended with the PIG sequence (5’-GTTTCTT-3’) to promote non-templated (A) addition and facilitate genotyping [28]. The PCR reactions were performed in 8 μL total volume using 3.5 μL 1 × JumpStart REDTaq ReadyMix (Sigma, St. Louis, MO, USA), 1.0 μL of 15 ng/μL genomic DNA, 2.0 μL of H2O, 0.5 μL of 5 μM M13-FAM or HEX primer, 0.5 μL of 5 μM forward primer, 0.5 μL of 50 μM reverse primer. The thermocycling conditions included an initial melting step (94˚C for 3 min), followed by 33 cycles of 94˚C for 15 s, 55˚C for 90 s, and 72˚C for 2 min, a final elonga-tion step (72˚C for 30 min), and an indefinite soak at 4˚C. The PCR fragment separation was performed at the University of Wisconsin Biotechnology Center DNA Sequence Facility using an ABI 3730 fluorescent sequenc-er (POP-6 and a 50 cm array; Applied Biosystems, Fostsequenc-er City, CA, USA). Individuals wsequenc-ere genotyped using carboxyfluorescein (FAM) and hexachlorofluorescein (HEX) M13 tags and a carboxy-X-rhodamine (ROX) ladder (GeneFlo-625 ROX; CHIMERx, Milwaukee, WI, USA). The resulting sequences were visualized using GeneMarker software v1.91 (SoftGenetics, State College, PA, USA).
Forty-five SSR primer pairs were used to conduct a survey of genetic polymorphism using 16 A. formosa in-dividuals. These primer pairs were selected based on the length of their motif and the number of repeats. Nine of these primer pairs came from the nucleotide sequence database, 18 from the GSS, and 18 from the EST se-quences. We attempted to redesign primers for specific use with M13 sequences and PIG tails for the 32 SSR loci which were previously available for A. formosa[19] [20]. However, because of the high stringency of our parameters (length, GC content, melting temperatures, and annealing temperatures), the observed redundancy of loci, and the SSR position in the sequences obtained from NCBI, we were only able to redesign acceptable pri-mer pairs for eight loci. Therefore, eight of the 9 sequences containing SSRs from the nucleotide database in this study were previously identified [19] although the current study used different parameters and protocols for primer pairs design and genotyping.
The observed number of alleles (Na), the levels of observed (Ho) and expected heterozygosity (He), the Shan-non Information Index (I), and the major allele frequency (MAF) or frequency of the most common allele were calculated for each polymorphic locus in GenAlEx 6.4 [29]. In addition, Hardy-Weinberg Equilibrium (HWE), null allele frequency, and non-exclusion probability of identity (NE-I) were calculated for each polymorphic lo-cus using Cervus 3.0 [30]. One-Way ANOVAs were performed to identify differences in diversity statistics among the three databases (Nucleotide, EST and GSS). Finally we performed a principal coordinate analysis (PCoA) with all polymorphic loci in GenAlEx 6.4 [29] based on the genetic distances between pairs in order to demonstrate the markers’ ability to discriminate between unique individuals.
3. Results and Discussion
A screen of the 128,082 A. formosa sequences deposited in NCBI identified a total of 65 SSRs in the nucleotide database, 4372 SSRs in the GSS database, and 11,519 SSRs in the EST database. The most frequent motifs identified among the 15,956 ungapped SSR loci were trinucleotides (48.9%), followed by mononucleotides (19.1%), tetranucleotides (13.2%) and finally dinucleotides (9.5%) (Figure 1; Table S1). The most frequent mononucleotide motif was A (17.2% of the total), dinucleotide was AG (4.6%), trinucleotide, GAA (7.6%) and tetranucleotide, AGAA (2.0%). The 15,956 sequences containing SSR were inspected for suitable flanking sites for primer design, and primer-pairs were designed for 9 of the SSRs from the nucleotide database, 3,803 of the EST SSRs, and 2226 of the GSS SSRs using WebSat [26] (Table S2 and Table S3).
Figure 1. Frequency of repeat numbers within mononucleotide through nonanucleotide microsatellite (SSR) motif levels. The nonanucleotide for GSS and EST only have repeats of 3 while the octanucleotides for GSS have repeats of 3 and 4. These repeat numbers were examined within 11,519 SSRs identified in the NCBI EST database from A. formosa × A. pu-bescens pooled RNA and within 4,372 SSRs identified in the NCBI GSS database for A. formosa.
signed for this study [19], only 6 amplified in a diploid inheritance pattern (Table 2, Table S4). Therefore, of the SSR loci previously available for Aquilegia, 20 have low allelic diversity [21] and only 6 of the 32 SSR loci with higher allelic diversity [19] [20] met the more stringent criteria used for primer development in this study.
The 30 polymorphic loci yielded 408 alleles with an average of 13.6 alleles and a range of 5 to 25 alleles (Na) per locus (Table 2). These values are consistent with previous primer discoveries in Aquilegia species from North America where, for 28 individuals and 16 primers, an average of 14.4 alleles per locus has been reported for A. formosa, and 13.9 alleles per locus for A. pubescens [19]. In addition, Gallagher et al. (2004) [20] re-ported 15.5 alleles per locus in A. chrysantha from 16 primers in 165 individuals. Lower number of alleles per locus has been detected in two Asian columbine species, with 2 - 4 alleles per locus in A. flabellata and 2 to 5 in
A. oxysepala [21]. For most of the loci examined, the level of heterozygosity was high, a pattern that has been previously observed for another columbine species, A. coerulea [11].
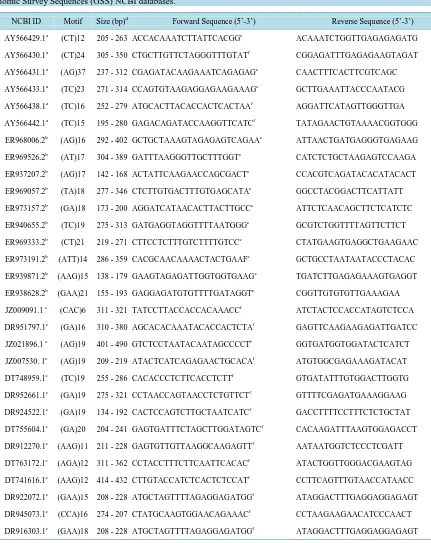
Table 1. Primer sequences and their relevant characteristics. These primers were designed for 30 polymorphic SSR contain-ing loci from A. formosa identified in sequences retrieved from the Nucleotide, Expressed Sequence Tag (EST), and Ge-nomic Survey Sequences (GSS) NCBI databases.
NCBI ID Motif Size (bp)d Forward Sequence (5’-3’) Reverse Sequence (5’-3’)
AY566429.1a (CT)12 205 - 263 ACCACAAATCTTATTCACGGe ACAAATCTGGTTGAGAGAGATG
AY566430.1a (CT)24 305 - 350 CTGCTTGTTCTAGGGTTTGTATf CGGAGATTTGAGAGAAGTAGAT
AY566431.1a (AG)37 237 - 312 CGAGATACAAGAAATCAGAGAGe CAACTTTCACTTCGTCAGC
AY566433.1a (TC)23 271 - 314 CCAGTGTAAGAGGAGAAGAAAGe GCTTGAAATTACCCAATACG
AY566438.1a (TC)16 252 - 279 ATGCACTTACACCACTCACTAAf AGGATTCATAGTTGGGTTGA
AY566442.1a (TC)15 195 - 280 GAGACAGATACCAAGGTTCATCf TATAGAACTGTAAAACGGTGGG
ER968006.2b (AG)16 292 - 402 GCTGCTAAAGTAGAGAGTCAGAAe ATTAACTGATGAGGGTGAGAAG
ER969526.2b (AT)17 304 - 389 GATTTAAGGGTTGCTTTGGTe CATCTCTGCTAAGAGTCCAAGA
ER937207.2b (AG)17 142 - 168 ACTATTCAAGAACCAGCGACTe CCACGTCAGATACACATACACT
ER969057.2b (TA)18 277 - 346 CTCTTGTGACTTTGTGAGCATAe GGCCTACGGACTTCATTATT
ER973157.2b (GA)18 173 - 200 AGGATCATAACACTTACTTGCCe ATTCTCAACAGCTTCTCATCTC
ER940655.2b (TC)19 275 - 313 GATGAGGTAGGTTTTAATGGGe GCGTCTGGTTTTAGTTCTTCT
ER969333.2b (CT)21 219 - 271 CTTCCTCTTTGTCTTTTGTCCe CTATGAAGTGAGGCTGAAGAAC
ER973191.2b (ATT)14 286 - 359 CACGCAACAAAACTACTGAAFe GCTGCCTAATAATACCCTACAC
ER939871.2b (AAG)15 138 - 179 GAAGTAGAGATTGGTGGTGAAGe TGATCTTGAGAGAAAGTGAGGT
ER938628.2b (GAA)21 155 - 193 GAGGAGATGTGTTTTGATAGGTe CGGTTGTGTGTTGAAAGAA
JZ009091.1 c (CAC)6 311 - 321 TATCCTTACCACCACAAACCf ATCTACTCCACCATAGTCTCCA
DR951797.1c (GA)16 310 - 380 AGCACACAAATACACCACTCTAf GAGTTCAAGAAGAGATTGATCC
JZ021896.1 c (AG)19 401 - 490 GTCTCCTAATACAATAGCCCCTf GGTGATGGTGGATACTCATCT
JZ007530. 1c (AG)19 209 - 219 ATACTCATCAGAGAACTGCACAf ATGTGGCGAGAAAGATACAT
DT748959.1c (TC)19 255 - 286 CACACCCTCTTCACCTCTTf GTGATATTTGTGGACTTGGTG
DR952661.1c (GA)19 275 - 321 CCTAACCAGTAACCTCTGTTCTf GTTTTCGAGATGAAAGGAAG
DR924522.1c (GA)19 134 - 192 CACTCCAGTCTTGCTAATCATCf GACCTTTTCCTTTCTCTGCTAT
DT755604.1c (GA)20 204 - 241 GAGTGATTTCTAGCTTGGATAGTCf CACAAGATTTAAGTGGAGACCT
DR912270.1c (AAG)11 211 - 228 GAGTGTTGTTAAGGCAAGAGTTf AATAATGGTCTCCCTCGATT
DT763172.1c (AGA)12 311 - 362 CCTACCTTTCTTCAATTCACACf ATACTGGTTGGGACGAAGTAG
DT741616.1c (AAG)12 414 - 432 CTTGTACCATCTCACTCTCCATf CCTTCAGTTTGTAACCATAACC
DR922072.1c (GAA)15 208 - 228 ATGCTAGTTTTAGAGGAGATGGf ATAGGACTTTGAGGAGGAGAGT
DR945073.1c (CCA)16 274 - 207 CTATGCAAGTGGAACAGAAACf CCTAAGAAGAACATCCCAACT
DR916303.1c (GAA)18 208 - 228 ATGCTAGTTTTAGAGGAGATGGf ATAGGACTTTGAGGAGGAGAGT
aSequences from the NCBI Nucleotide Database; bSequences from the NCBI GSS Database; cSequences from the NCBI EST Database; dM13 tail and
PIG tail included in the observed allele size range; ePCR performed with 5’ FAM fluorescently labeled primers; fPCR performed with 5’ HEX fluo-rescently labeled primers.
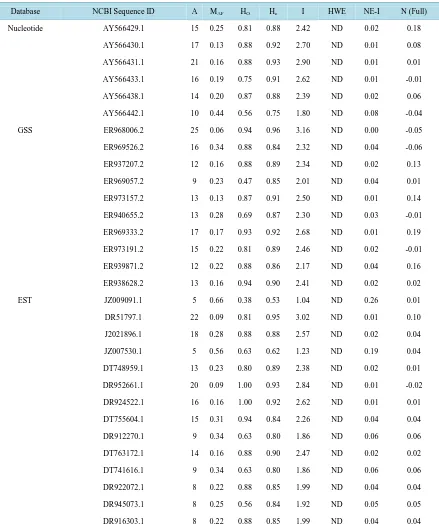
Table 2.Diversity statistics for 30 polymorphic SSR loci tested in 16 A. formosa individuals.
Database NCBI Sequence ID A MAF HO He I HWE NE-I N (Full)
Nucleotide AY566429.1 15 0.25 0.81 0.88 2.42 ND 0.02 0.18
AY566430.1 17 0.13 0.88 0.92 2.70 ND 0.01 0.08
AY566431.1 21 0.16 0.88 0.93 2.90 ND 0.01 0.01
AY566433.1 16 0.19 0.75 0.91 2.62 ND 0.01 -0.01
AY566438.1 14 0.20 0.87 0.88 2.39 ND 0.02 0.06
AY566442.1 10 0.44 0.56 0.75 1.80 ND 0.08 -0.04
GSS ER968006.2 25 0.06 0.94 0.96 3.16 ND 0.00 -0.05
ER969526.2 16 0.34 0.88 0.84 2.32 ND 0.04 -0.06
ER937207.2 12 0.16 0.88 0.89 2.34 ND 0.02 0.13
ER969057.2 9 0.23 0.47 0.85 2.01 ND 0.04 0.01
ER973157.2 13 0.13 0.87 0.91 2.50 ND 0.01 0.14
ER940655.2 13 0.28 0.69 0.87 2.30 ND 0.03 -0.01
ER969333.2 17 0.17 0.93 0.92 2.68 ND 0.01 0.19
ER973191.2 15 0.22 0.81 0.89 2.46 ND 0.02 -0.01
ER939871.2 12 0.22 0.88 0.86 2.17 ND 0.04 0.16
ER938628.2 13 0.16 0.94 0.90 2.41 ND 0.02 0.02
EST JZ009091.1 5 0.66 0.38 0.53 1.04 ND 0.26 0.01
DR51797.1 22 0.09 0.81 0.95 3.02 ND 0.01 0.10
J2021896.1 18 0.28 0.88 0.88 2.57 ND 0.02 0.04
JZ007530.1 5 0.56 0.63 0.62 1.23 ND 0.19 0.04
DT748959.1 13 0.23 0.80 0.89 2.38 ND 0.02 0.01
DR952661.1 20 0.09 1.00 0.93 2.84 ND 0.01 -0.02
DR924522.1 16 0.16 1.00 0.92 2.62 ND 0.01 0.01
DT755604.1 15 0.31 0.94 0.84 2.26 ND 0.04 0.04
DR912270.1 9 0.34 0.63 0.80 1.86 ND 0.06 0.06
DT763172.1 14 0.16 0.88 0.90 2.47 ND 0.02 0.02
DT741616.1 9 0.34 0.63 0.80 1.86 ND 0.06 0.06
DR922072.1 8 0.22 0.88 0.85 1.99 ND 0.04 0.04
DR945073.1 8 0.25 0.56 0.84 1.92 ND 0.05 0.05
DR916303.1 8 0.22 0.88 0.85 1.99 ND 0.04 0.04
Note: A = Number of alleles sampled; MAF = Major allele frequency; Ho = Observed heterozygosity; He = Expected heterozygosity; I = Shannon’s
diversity index; HWE = Hardy-Weinberg Equilibrium; ND = No significant deviation; NE-I = Non-exclusion probability of identity; N (Full) = Fre-quency of null alleles.
are eliminated in the adult population as a result of the strong inbreeding depression that exists in the species [33].
Figure 2. Principal Coordinate Analysis (PCoA) showing the genetic relationships of 16 A. formosa individuals. Leaf tissue for these individuals was collected from the H. J. Andrews experimental forest in Oregon, USA. The PCoA used alleles from 30 po-lymorphic microsatellite loci identified in sequences retrieved from the NCBI Nucleo-tide, Expressed Sequence Tag (EST), and Genomic Survey Sequence (GSS) databas-es.
clusion probability of identity for the 30 markers (9.33E−49) indicates that these markers are suitable for genetic fingerprinting and other studies. For example, genotyping using only two primers, DR51797 and ER968006.2, discriminated all 16 individuals because the combined non-exclusion probability of identity for the two markers was 2E−5. These results indicate the potential of these SSRs for examining population-level processes such as paternity analyses and studies where individuals must be identified [24]. Researchers can achieve the same ge-netic information content using one microsatellite with k alleles as (k-1) biallelic markers such as SNPs [34]. Furthermore, SSRs are relatively evenly distributed across genomes which make them useful for conducting comparative genomic analyses, linkage and QTL mapping, and genome wide association studies [35]. Finally, the transcript-based SSRs for which primers were designed in this species are likely to be associated with func-tional genes and could be an important resource for studies searching for and identifying genes in Aquilegia.The 6038 primer-pairs designed for SSR loci in A. formosa and the 30 polymorphic SSR which were tested and va-lidated (Tables S2 & S3) complement the molecular tools currently available for Aquilegia research [18].
4. Conclusion
An extensive number of microsatellite primers located in transcribed and genomic regions were developed for A. formosa. This collection is the most comprehensive set of microsatellite primer-pairs developed in Aquilegia to date, and illustrates how sequence-based SSR mining can produce many microsatellites of a diverse motif type and repeat length that adds to the existing microsatellite libraries often based on enrichment methods to provide a larger marker resource for scientists. The collection of microsatellites presented here contributes to the various molecular tools being developed in Aquilegia. Given the extensive knowledge of the ecology, pollination biolo-gy, floral biology and mating system of some Aquilegia species, these molecular tools can facilitate the mapping of functional genes and promote studies of the population genetic structure, selection and gene flow in diverse species.
Acknowledgements
project was provided by the USDA—Agricultural Research Service to J. B. and to J. E. Z.
References
[1] Bastida, J.M., Alcantara, J.M., Rey, P.J., Vargas, P. and Herrera, C.M. (2010) Extended Phylogeny of Aquilegia: The Biogeographical and Ecological Patterns of Two Simultaneous but Contrasting Radiations. Plant Systematics and Evolution, 284, 171-185. http://dx.doi.org/10.1007/s00606-009-0243-z
[2] Hodges, S.A. and Arnold, M. (1994) Columbines: A Geographically Widespread Species Flock. Proceedings of the National Academy of Sciences, 91, 5129-5132. http://dx.doi.org/10.1073/pnas.91.11.5129
[3] Whittall, J.B. and Hodges, S.A. (2007) Pollinator Shifts Drive Increasingly Long Nectar Spurs in Columbine Flowers. Nature, 447, 706-710. http://dx.doi.org/10.1038/nature05857
[4] Fior, S., Li, M., Oxelman, B., Viola, R., Hodges, S.A., Ometto, L. and Varotto, C. (2013) Spatiotemporal Reconstruc-tion of the Aquilegia Rapid Radiation through Next-Generation Sequencing of Rapidly Evolving cpDNA Regions. New Phytologist, 198, 579-592. http://dx.doi.org/10.1111/nph.12163
[5] Brunet, J. and Eckert, C.G. (1998) Effect of Floral Morphology and Display on Outcrossing in Blue Columbine, Aqui-legia caerulea (Ranunculaceae). Functional Ecology, 12, 596-606. http://dx.doi.org/10.1046/j.1365-2435.1998.00231.x
[6] Fulton, M. and Hodges, S.A. (1999) Isolation between Aquilegia formosa and Aquilegia pubescens. Proceeding of the Royal Society of London B, 266, 2247-2252.
[7] Herlihy, C.R. and Eckert C.G. (2005) Evolution of Self-Fertilization at Geographical Range Margins? A Comparison of Demographic, Floral, and Mating System Variables in Central vs. Peripheral Populations of Aquilegia canadensis (Ranunculaceae). American Journal of Botany, 92, 744-751. http://dx.doi.org/10.3732/ajb.92.4.744
[8] Brunet, J. and Sweet, H.R. (2006) Impact of Insect Pollinator Group and Floral Display Size on Outcrossing Rate. Evolution, 60, 183-195. http://dx.doi.org/10.1111/j.0014-3820.2006.tb01102.x
[9] Herlihy, C.R. and Eckert, C.G. (2007) Evolutionary Analysis of a Key Floral Trait and Its Effect on the Mating System in Aquilegia canadensis (Ranunculaceae). Evolution, 61, 1661-1674.
http://dx.doi.org/10.1111/j.1558-5646.2007.00137.x
[10] Brunet, J. (2009) Pollinators of the Rocky Mountain Columbine: Temporal Variation, Functional Groups and Associa-tions with Floral Traits. Annals of Botany, 103, 1567-1578. http://dx.doi.org/10.1093/aob/mcp096
[11] Brunet, J. and Larson-Rabin, Z. (2012) The Response of Flowering Time to Global Warming in a High-Altitude Plant: The Impact of Genetics and the Environment. Botany, 90, 319-326. http://dx.doi.org/10.1139/b2012-001
[12] Van Etten, M.L. and Brunet, J. (2013) The Impact of Global Warming on Floral Traits That Affect the Selfing Rate in a High-Altitude Plant. International Journal of Plant Sciences, 174, 1099-1108. http://dx.doi.org/10.1086/671805
[13] Chase, V.C. and Raven, P.H. (1975) Evolutionary and Ecological Relationships between Aquilegia formosa and A. pubescens (Ranunculaceae), Two Perennial Plants. Evolution, 29, 474-486. http://dx.doi.org/10.2307/2407260
[14] Kramer, E.M., Holappa, L., BillieGould, M., Jaramillo, A., Setnikov, D. and Santiago, P.M. (2007) Elaboration of B Gene Function to Include the Identity of Novel Floral Organs in the Lower Eudicot Aquilegia. The Plant Cell, 19, 750-766. http://dx.doi.org/10.1105/tpc.107.050385
[15] Voelckel, C., Borevitz, J.O., Kramer, E.M. and Hodges, S.A. (2010) Within and between Whorls: Comparative Tran-scriptional Profiling of Aquilegia and Arabidopsis. PLoS ONE, 5, e9735.
http://dx.doi.org/10.1371/journal.pone.0009735
[16] Kramer, E.M. (2009) Aquilegia: A New Model for Plant Development, Ecology, and Evolution. Annual Review of Plant Biology, 60, 261-277.
[17] Kramer, E.M. and Hodges, S.A. (2010) Aquilegia as a Model System for the Evolution and Ecology of Petals. Philo-sophical Transactions of the Royal Society B, 365, 477-490. http://dx.doi.org/10.1098/rstb.2009.0230
[18] Fang, G.C., Blackmon, B.P., Henry, D.C., Staton, M.E., Saski, C.A., Hodges, S.A., Tomkins, J.P. and Luo, H. (2010) Genomic Tools Development for Aquilegia: Construction of a BAC-Based Physical Map. BMC Genomics, 11, 621.
http://dx.doi.org/10.1186/1471-2164-11-621
[19] Yang, J.Y., Counterman, B.A., Eckert, C.G. and Hodges, S.A. (2005) Cross-Species Amplification of Microsatellite loci in Aquilegia and Semiaquilegia (Ranunculaceae). Molecular Ecology Notes, 5, 317-320.
http://dx.doi.org/10.1111/j.1471-8286.2005.00913.x
[20] Gallagher, K.G., Milligan, B.G. and White, P.S. (2004) Isolation and Characterization of Microsatellite DNA Loci in Aquilegia sp. Molecular Ecology Notes, 4, 686-688. http://dx.doi.org/10.1111/j.1471-8286.2004.00785.x
http://dx.doi.org/10.3732/ajb.1100057
[22] Brunet, J., Larson-Rabin, Z. and Stewart, C.M. (2012) The Distribution of Genetic Diversity within and among Popu-lations of the Rocky Mountain Columbine: The Impact of Gene Flow, Pollinators, and Mating System. International Journal of Plant Sciences, 174, 1099-1108.
[23] Garrido, J.L., Fenu, G., Mattana, E. and Bacchetta, G. (2012) Spatial Genetic Structure of Aquilegia Taxa Endemic to the Island of Sardinia. Annals of Botany, 109, 953-964. http://dx.doi.org/10.1093/aob/mcs011
[24] Brunet, J. and Holmquist, K.G.A. (2009) Influence of Distinct Pollinators on Female and Male Reproductive Success in the Rocky Mountain Columbine. Molecular Ecology, 18, 3745-3758.
http://dx.doi.org/10.1111/j.1365-294X.2009.04304.x
[25] da Maia, L.C., Palmieri, D.A., de Sonza, V.Q., Kopp, M.M., de Carvalho, F.I. and de Oliveira, A.C. (2008) SSR Loca-tor: Tool for Simple Sequence Repeat Discovery Integrated with Primer Design and PCR Simulation. International Journal of Plant Genomics, 2008, 412696-412705.
[26] Martins, W.S., Lucas, D.C.S., Neves, K.F.S. and Bertioli, D.J. (2009) WebSat—A Web Software for MicroSatellite Marker Development. Bioinformation, 3, 282-283. http://dx.doi.org/10.6026/97320630003282
[27] Schuelke, M. (2000) An Economic Method for the Fluorescent Labeling of PCR Fragments. Nature Biotechnology, 18, 233-234. http://dx.doi.org/10.1038/72708
[28] Zalapa, J., Cuevas, H., Zhu, H., Steffan, S., Senalik, D., Zeldin, E. McCown, B., Harbut, R. And Simon, P. (2012) Us-ing Next-Generation SequencUs-ing Approaches to Isolate Simple Sequence Repeat (SSR) Loci in the Plant Sciences. American Journal of Botany, 99, 193-208. http://dx.doi.org/10.3732/ajb.1100394
[29] Peakall, R. and Smouse, P.E. (2006) GENALEX 6: Genetic Analysis in Excel. Population Genetic Software for Teaching and Research. Molecular Ecology Notes, 6, 288-295. http://dx.doi.org/10.1111/j.1471-8286.2005.01155.x
[30] Kalinowski, S.T., Taper, M.L. and Marshall, T.C. (2007) Revising How the Computer Program CERVUS Accommo-dates Genotyping Error Increases Success in Paternity Assignment. Molecular Ecology, 16, 1099-1006.
http://dx.doi.org/10.1111/j.1365-294X.2007.03089.x
[31] Fu, Y.B., Peterson, G.W., Richards, K.W., Tarn, T.R. and Percy, J.E. (2009) Genetic Diversity of Canadian and Exotic Potato Germplasm Revealed by Simple Sequence Repeat Markers. American Journal of Potato Research, 86, 38-48.
http://dx.doi.org/10.1007/s12230-008-9059-6
[32] Mujaju, C., Sehic, J. and Nybom, H. (2013) Assessment of EST-SSR Markers for Evaluating Genetic Diversity in Wa-termelon Accessions from Zimbabwe. American Journal of Plant Sciences, 4, 1448-1456.
[33] Yang, J.Y. and Hodges, S.A. (2010) Early Inbreeding Depression Selects for High Outcrossing Rates in Aquilegia formosa and Aquilegia pubescens. International Journal of Plant Sciences, 171, 860-871.
http://dx.doi.org/10.1086/655772
[34] Hamblin, M.T., Warburton, M.L. and Buckler, E.S. (2007) Empirical Comparison of Simple Sequence Repeats and Single Nucleotide Polymorphisms in Assessment of Maize Diversity and Relatedness. PLoS ONE, 2, Article ID: e1367.
http://dx.doi.org/10.1371/journal.pone.0001367
[35] Adam-Blondon, A.F., Roux, C., Claux, D., Butterlin, G., Merdinoglu, D. and This, P. (2004) Mapping 245 SSR Mark-ers on the Vitis vinifera Genome: A Tool for Grape Genetics. Theoretical and Applied Genetics, 109, 1017-1027.
Appendix
Table S1. The total number of loci containing microsatellites for motif levels mono to nonanucleotide.
Motif Level
Mono- Di- Tri- Tetra- Penta- Hexa- Hepta- Octa- Nona- Total
Database
Nucleotide 13 16 19 9 5 3 0 0 0 65
GSS 1714 505 883 797 278 142 46 2 5 4372
EST 1325 994 6902 1300 378 567 46 5 2 11,519
Combined 3052 1515 7804 2106 661 712 92 7 7 15,956
These microsatellites were identified in 106 A. formosa sequences from the NCBI Nucleotide database, 12,310 A. formosa sequences from the Ge-nomic Survey Sequences (GSS) NCBI database, and an additional 115,666 sequences in the NCBI Expressed Sequence Tag (EST) database from
Aquilegia formosa×Aquilegia pubescens pooled RNA.
Table S2. Untested primer sequences and their characteristics for 3785 microsatellite containing loci identified within A. formosa sequences deposited in the NCBI Expressed Sequence Tag (EST) database.
https://www.dropbox.com/s/bg8xeu4ooj1qpqm/SupplementaryTable2.xlsx
Table S3. Untested primer sequences and their characteristics for 2208 microsatellite containing loci identified within A. formosa sequences deposited in the NCBI Genomic Survey Sequence (GSS) database.
Table S4. Primer sequences and their relevant characteristics for 15 SSR loci from A. formosa which did not amplify, dis-play polymorphism, or disdis-play the expected inheritance pattern.
Database NCBI Sequence ID Repeat Motif Primer sequences (5’-3’) Fluorescence
Nucleotide AY566435.1 ᵻ (AC)11 F: GAAAGATGATATAGCGAACCC FAM
R: AGGAAGTAGTCCTCGAATAGC
AY566441 .1 ᵻ (TC)25 F: TATAATGAGGGAGAAGACGAAG HEX
R: AGAAGTTATCCTGTAAAAGCCC
GM711827 .1 ᵻ (TC)33 F: ATTCTCATCAGCTCTGGAAA FAM
R: CATCAGCACTCACTTCTATACG
GSS ER936871.2 ᵻ (CT)17 F: ATGACACATGGATTTCAGC FAM
R: AAACACAAGAATAAGACCCC
ER969937.2* (TA)19 F: GGCCTCATACATTCCAAAA FAM
R: GCATACCATCCGCTATAAATAC
ER939203.2* (AT)19 F: CTAGACGCTGGTAAATCTTCTC FAM
R: GAACTTAAAACAGCTCGTGACT
ER939308.2* (AG)21 F: GATGTGAGGAGCAAATATCATC FAM
R: TTTCTAACTGAAGAACTCTGGC
ER972897.2* (GA)21 F: GGGAAGAGTAATTGCCAGA FAM
R: CCCTTATACTGGACCTTGAAT
ER973211.2 ᵻ (ATA)12 F: TCATAGAGAAAGCTGGATGAAC FAM
R: GTGTAAATTGTGAAGGAAGGAC
ER970243.2 ᵻ (CAT)15 F: ACTGCTCATTTACCTCTTCTGT FAM
R: ACTTCAGACTATGGATGGGAT
ER972134.2* (TAT)24 F: TAAATATGCGTGGCTTTGAG FAM
R: ATAGACGACGAAAGGAAACG
EST JZ017427.1* (GA)16 F: CTCTTCTTACTTGTTGCATTGG HEX
R: GACTACTTTGAATTTGCCCTCT
DR946658.1* (CT)16 F: GTGCAACTCTCTCTCTCTCTCT HEX
R: TATACTGGAAAGACTAATGGCTG
DR926317.1* (GA)16 F: CTGGTACATCCAGAGCACAT HEX
R: GAAATGAACTCCTTCTCCATC
DR928536.1* (AG)18 F: ACTCAACTGCTACTCCTCAAGT HEX
R: AGTAAAGAGAGACCCTGCTATG
currently publishing more than 200 open access, online, peer-reviewed journals covering a wide range of academic disciplines. SCIRP serves the worldwide academic communities and contributes to the progress and application of science with its publication.
Other selected journals from SCIRP are listed as below. Submit your manuscript to us via either