Monitoring System Based on Acoustic Fingerprint for
the Crimping Process of the Composite Insulators
Claudiu-Ionel Nicola*, Marcel Nicola, Adrian Vintilă, Ion Pătru
National Institute for Research, Development and Testing in Electrical Engineering – ICMET, Craiova, 200746, Romania
Copyright©2018 by authors, all rights reserved. Authors agree that this article remains permanently open access under the terms of the Creative Commons Attribution License 4.0 International License
Abstract
The crimping process is mainly determined by the initial tolerance field of the fitting-rod assembly and the hardness of the fittings. The initial tolerance field of the fitting-rod assembly results in a higher crimping pressure as the tolerance field increases. The greater the hardness of the fittings, the higher the crimping pressure. In practice, due to the above mentioned factors, it is impossible to set an optimum crimping pressure to ensure a correct fitting-rod assembly. The article presents a system for monitoring the acoustic emissions during the crimping process of composite insulators. The system achieves an automatic classification of the type of crimping, a database of the acoustic emission graph recordings, the storage of the values as TDMS files, and generates automatic reports of the crimping process. This method was successfully tested.Keywords
Crimping Process, Acoustic Emissions, Monitoring System1. Introduction
The efficiency of electric power systems depends on the reliability of power networks and equipment. The transmission of electric energy from power stations to end users has been carried out in recent years using extra high voltage power lines. Electric power transmission systems rely on key components such as insulators, which are used to support the conductors at high voltage. They must be capable of withstanding not only regular voltages and overvoltages, such as lightning and switching events, but also various effects of the environment, such as rain, snow and pollution. Composite insulators are designed to fulfill long-term structural roles in power transmission and substation applications. The main parts of these insulators are: a glass reinforced polymer (GRP) composite rod, and two metal end-fittings which are attached by mechanical crimping or adhesive bonding to the ends of the rod during assembly. Due to the high mechanical
strength-to-weight ratio, the improved damage tolerance, flexibility, and ease of installation, composite insulators are more advantageous than their porcelain counterparts. However, considering that they are relatively recent products, their design is still in the development stage, and their structural integrity and expected life until failure are matters under consideration for both utilities and manufacturers since [1-3].
Damage to composite materials during the crimping operation can occur due to several factors, and can result in serious impairment of their load carrying capacity. Serious damage can occur due to even apparently minor impact events, especially in thin-walled structures. Costly and extremely time-consuming inspections are often necessary to ensure the safety of the structure. Undetected damage can become critical and result in catastrophic failures of structures. For this reason, aircraft and aerospace structures are equipped with damage monitoring systems to improve their safety and significantly reduce maintenance costs. Composite materials and structures are characterized by inherent material defects and manufacturing anomalies, therefore the successful application of non-destructive testing (NDT) techniques for damage detection and monitoring is necessary when the composites are manufactured for large scale production; in order to meet the requirements regarding the applicability of their physics, some of the techniques often have to be adjusted especially for composites [4-10].
techniques, since it is a continuous monitoring technique rather than a tool for non-destructive inspection; in fact, acoustic emissions can be collected after the structure is loaded, and eventually damaged [11-18].
The paper is organized as follows: Section 2 describes the crimping process for the composite insulators. Section 3 presents the structure of the acoustic signals monitoring system for the crimping process. The experimental results are presented in Section 4 and the paper includes a section of conclusions at the end, which describe the main aspects and benefits of the developed acoustic signal monitoring system for the crimping process.
2. Crimping Process for the Composite
Insulators
[image:2.595.63.286.341.466.2]Composite insulators consist of the following components: a glass reinforced polymer (GRP) rod, two metal end fittings attached to the rod during assembly and a series of electrically insulating rubber sheds (Figure 1).
Figure 1. Composite insulator
The insulator assembly is required to withstand tensile forces according to certain specifications of the insulator. The end fittings perform the main task of providing a mechanical connection and transferring loads from the high voltage conductor to the GRP-rod (at the line end), and from the GRP rod to the tower (at the tower end). Modern GRP have several advantages, in contrast to conventional materials. Compression type joints are the state-of-art in composite insulators technology due to their reliability, low cost and reproducibility. The force of compression applied during crimping and the friction coefficient between the fitting and the rod greatly influence the coupling between the GRP rod and the metal end fitting in the insulators. As a result of excessive straining from the crimping process, breaking can occur in the core. The factors leading to a gradual progression of the cracks during operation are the complex mechanical (static and cyclic) stress as well as the chemical and electrical environment associated with high voltage applications. The performance of over-crimped composite insulators in service can be seriously affected by humidity and corona discharges [4].
Cracking failures in high voltage composite suspension
insulators in service are caused by the combined effect of the mechanical, electrical and environmental stress. By contrast, deformation caused by under-crimping will result in a loose joint. In order to determine the mechanical strength of a composite insulator with crimped end-fittings, the GRP rod is pulled out of the end-fittings.
By using a hydraulic press, the die set is driven in radial direction, towards the end fitting. The standard crimping process is carried out as follows: first, the crimping pressure increases up to the preset value; next, the pressure is maintained at this value for a preset holding time; the final step consists in releasing the pressure.
The compression applied during manufacturing, the friction properties of the rod/fitting interface and the geometry of the fitting are the parameters which affect the strength of the insulator. The geometry of the fitting influences the strength of the insulator according to three factors. The first factor is the length of the fitting: a greater insulator strength is obviously achieved in the case of long fittings, as opposed to short ones. The second important factor relates to the gap between the internal surface of the fitting and the rod surface before applying the crimping process. The internal surface of the fitting represents the third factor: in order to obtain the same insulator strength properties, greater stress-strain compression is required to be applied to the fitting and the rod surface in the case of smooth surfaces in comparison with rough surfaces (for example threaded surfaces). The insulator strength also depends on a third factor, namely the material of the fitting. In order to achieve the mechanical connection between the GRP rod and fitting in crimped composite insulators, the material of the fitting undergoes plastic deformation during crimping, therefore the insulator strength could be significantly affected by the ductility of the fitting. For the same level of compression applied to the fitting, the internal stress distributions in the GRP rod and thus the insulator strength can vary according to the different elasto-plastic properties of the fitting materials. The properties of the materials and tolerances of the components are the two main factors affecting the crimping process, for the same load and for the same joint. The acoustic emission technology is used by the composite insulators manufacturers to monitor the crimping process of the end fittings. Acoustic emissions may be defined as transient elastic waves which are generated by the rapid release of energy within the material. The sounds of fiber glass breaking and cracks expanding can be detected by using the AE equipment. This AE monitoring method is used only to determine the occurrence of cracks [13].
practice, due to these mentioned factors, it is impossible to set an optimum crimping pressure to ensure a correct fitting-rod assembly. The end assemblies (fittings) are fastened to the insulator rod through controlled pressure crimping in the dies of a special crimping press with automatically tracked and controlled parameters (pressure, time and travel) [4].
The fastening of the metal end fittings to the glass fiber reinforced epoxy resin rod is important and is carried out through crimping (carried out by means of a hydraulic press). Through crimping, the metal in the end fittings is compressed symmetrically radially without damaging the fibers of the rod or the resin matrix. Excess compression can crush the rod and destroy the coupling between the rod and the end fittings, therefore reducing the mechanical strength of the insulator. Insufficient compression may cause slipping between the rod and the end fittings.
[image:3.595.307.534.161.311.2]The interface between the rod and the end fittings is critical for the long-term functionality of the insulator in service. Figure 2 shows the possible failures of the interface between the rod and the end fittings caused by the insulator tensile stress [5].
Figure 2. a) ‘‘Pull-out’’ (preferred), b) Separation failure, c) Delamination
A “pull-out” failure indicates that cracking has occurred due to the excessive strain of the end fitting during the crimping process. On the other hand, a separation failure is indicative of excessive pressure during the crimping process. These failures can be detected by measuring the acoustic emissions which occur during the process.
In general, the tolerance field for the fittings is of 0 ÷ 0.2 mm and the tolerance field of the fiberglass rod is of 0 ÷ (-0.2) mm. In order to achieve optimum technology, gauges were achieved in order to check and sort the end fittings and fiberglass rods. By using these gauges, these
semi-products are sorted so that the initial fitting-rod travel is the smallest possible.
Composite insulators are crimped in the following two ways [4-6]:
[image:3.595.61.290.349.587.2] Standard crimping (higher compression force at the end of the rod) as shown in Figure 3;
Figure 3. Normal stress condition
Reverse crimping as opposed to standard crimping (lower compression force at the end of the rod) as shown in Figure 4.
Figure 4. Reversed stress condition
The acoustic emissions generated during the crimping process of the fittings to the rod of the composite insulator are detected by using the acoustic sensor mounted on the die of the crimping press (see Figure 5). The electrical signal is filtered and amplified. The hydraulic installation of the crimping press sends an electric signal of pressure via a pressure transducer to the equipment for acoustic emission monitoring and for crimping pressure control. The data are sent by the equipment to the computer running the software. Another function of the monitoring equipment is to limit the crimping pressure achieved by the hydraulic installation.
[image:3.595.309.533.368.497.2]Figure 5. Block diagram of the automated system for composite insulator crimping
3. The acoustic Signal Monitoring
System for Crimping Process
The monitoring system for the crimping process is based on the virtual instrumentation (VI) concept.
A virtual instrument consists of a PC host equipped with powerful application software, cost-effective hardware such as plug-in boards, and driver software, which together perform the functions of traditional instruments. Virtual instruments represent a fundamental shift from traditional hardware-centered instrumentation systems to software-centered systems that exploit the computing power, productivity, display, and connectivity capabilities of popular PC host.
LabVIEW is an integral part of virtual instrumentation
because it provides an easy-to-use development environment application designed specifically with the needs of engineers and scientists in mind. LabVIEW offers powerful features that enable connection to a wide variety of hardware and other software.
3.1. Hardware Description
The functional model of the acoustic emission monitoring and crimping pressure control system has the following hardware structure:
Acquisition board – model NI USB-6009;
Signal conditioner– model ASCO-PH3 – Vallen;
Acoustic sensor – model VS900-M Vallen;
Industrial miniPC– model HCP SG1;
Industrial touchscreen display – model IDS-3210;
Acoustic signals generator and multivibrator.
The DAQ NI USB-6009 has the following specifications: 8 analog inputs (14-bit, 48 kS/s); 2 static analog outputs (12-bit); 12 digital I/O; 32-bit counter; bus-powered for high mobility; built-in signal connectivity; compatible with LabVIEW, LabWindows™/CVI, and Measurement Studio for Visual Studio .NET.
The ASCO-PH3 (see Figure 6) conditions the AE signal so that it can be recorded and evaluated by using a low-cost PC plug-in data acquisition card and a minimum of software that shows voltage over time. With ASCO-PH3 the integration of AE measurements into an industrial application becomes straightforward and very cost effective. The ASCO-PH3 forms a very useful addition to the mechanical testing machine [19].
[image:4.595.89.501.490.663.2]The AE signal delivered by the piezo-electrical AE sensor VS900-M is fed-in over a BNC-connector and amplified by a low noise preamplifier. A filter module rejects unnecessary frequency components. The high frequency signal is rectified and the logarithm is obtained. This signal is smoothened by a low pass filter and submitted at the Output ASL (average signal level). In parallel, the logarithm signal is processed by a peak-stretcher which holds even very low peak values for a defined period of time and is submitted at the Output APK (AE peak amplitude). The log signal is compared against a threshold fed-in as analogue voltage and when the signal exceeds the selected threshold, a pulse is generated, and fed over an optocoupler.
APK and ASL are derived from the same logarithmic output, but APK represents the peak amplitude and ASL represents the average amplitude.
The VS900-M is a passive piezoelectric AE-sensor that has a wide frequency response. Its response is characterized by two peaks at 190 kHz and 350 kHz with accompanying anti-resonances at 200 kHz and 400 kHz. The benefits of the VS900-M consist in high sensitivity over a wide frequency range with compromises regarding the flatness of response. It combines a good response in the standard frequency - and high frequency range.
3.2. Software Description
Software is the most important component of a virtual instrument. LabVIEW graphical programming is a powerful and versatile analysis and instrumentation software system for measurement and automation.
LabVIEW is designed to facilitate data collection and analysis, and provides many display options. With data collection, analysis and display combined into a flexible programming environment, the PC host functions as a dedicated measurement device. LabVIEW contains a comprehensive set of VIs and functions for data acquisition, analysis, display, and storage [20-21].
The software architecture of the acoustic emission monitoring system is presented in Figure 7.
The application software for acoustic emission monitoring system is based on state machines. A state machine is programming architecture capable of implementing any algorithm which can be explicitly described by a state diagram or flowchart.
The main software modules of the application perform the data acquisition and filtering of the acquired signal in order to reduce noise and the filtered data are written in the MySQL Server using the Database Write Module.
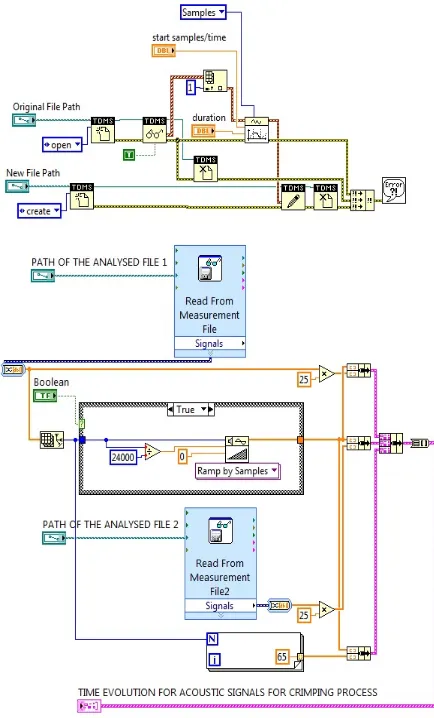
[image:5.595.311.534.83.383.2]The following modules are used for viewing the instant evolution of the acquired values, for achieving automatic reports, and storing the evolution as TDMS files (Technical data Management Streaming): Acoustic Emission Analysis, TDMS Read/Write Module and Automatic Report Software Module.
Figure 7. The software architecture of the acoustic emission monitoring system
The criterion for the classification of the probe is given by (1) and the software implementation is presented in Figure 8:
(
)
∑ − = = 2 1 s N i kk y(i) a (i) min
I (1)
Where:
Ns – number of samples of acoustic signals of the crimping process;
y – acoustic signal of the probe;
ak – acoustic signal patterns (k=1 - rated crimping, k=2 - over crimping, k=3 - under crimping).
Figure 9 shows the software block diagram of the Acoustic Emission Analysis Module. The MySQL database structure and the software block diagram for read and write database are presented in Figure 10.
The block diagram of the automatic report software is presented in Figure 11.
Figure 8. The software block diagram for the automated classification of the crimping process probe
[image:6.595.187.404.379.738.2]Figure 10. The software block diagram for Database connection: (a) Database structure, (b) Database Write Module, (c) Database Read Module
Figure 11. The software block diagram for the automatic report
[image:7.595.86.515.365.735.2]4. Experimental Results
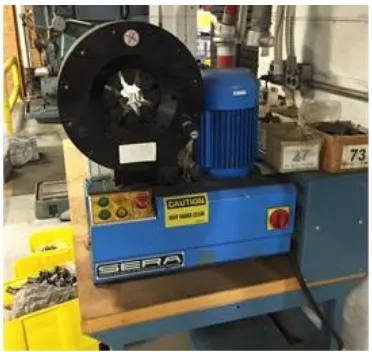
[image:8.595.82.268.204.380.2]The SERA insulator crimping machine PE 180TC model (see Figure 13) performs a uniform compression of the metal fittings on the fiberglass rod through 8 dies moving evenly in radial direction. The dies are hydraulically operated, the compression force being adjusted according to the diameter and length of the end fittings. The maximum crimping pressure is adjusted by using the pressure switch HYDAC EDS 300.
[image:8.595.78.274.407.552.2]Figure 13. Crimping machine SERA model PE 180TC
Figure 14. Monitoring system for acoustic emission
The acoustic emission monitoring system is shown in Figure 14.
The main technical features of the SERA crimping machine PE 180TC model:
Compression force: 240 tf;
Compression diameters 10, 12, 15, 18, 21, 24, 27, 30, 33, 39, 45, 48, 51, 57, 66, 70 and 73 mm;
Length of dies: 38 mm;
Supply voltage 400 V;
Electric motor output: 5.5 kW.
The crimping tests were carried out on end fittings with Ø 32 mm outer diameter, 16 mm Ø inner diameter and 38 mm compression length. After the crimping process, the insulators were tested at 70% of the specific mechanical load, indicating the fact that, in the case of over-compression, the values of the acoustic emissions recorded during the crimping process show cracks in the insulator fiberglass rod.
Following the tests carried out with the system and the technology described above, graphs were achieved, representing the time evolution of the acoustic emission signals during the crimping process in the following cases: rated compression, over-compression, and under-compression. In the case of rated compression crimping, the product passes the tensile test, in the case of over-compression crimping, the fiberglass rod breaks during the tensile test, and in the case of under-compression crimping, the fiberglass rod detaches from the end of the fitting during the tensile test.
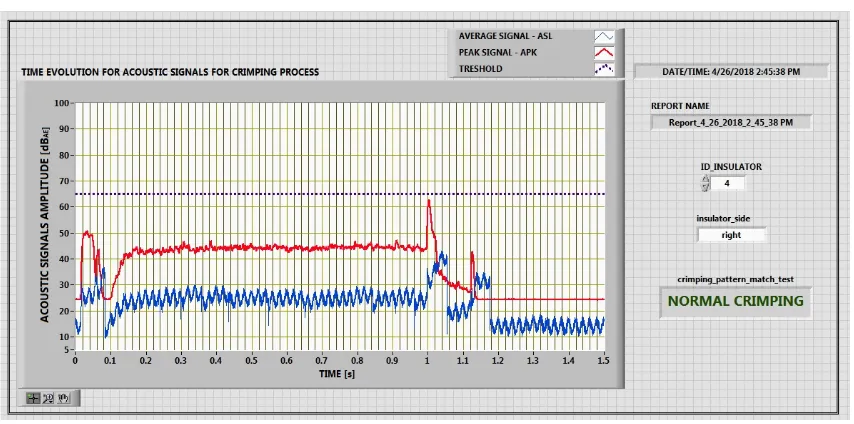
For the cases of rated crimping, over crimping and under crimping, the patterns of the acoustic emissions during the crimping process were obtained for 1.5 seconds, as shown in Figures 15, 16 and 17.
During the crimping process, for each insulator, the acoustic signals are recorded in the database and the automatic classification of the crimping quality is achieved according to the data presented in section 3.
Figure 15. Pattern waveform graph for acoustic signals ASL an APK - Normal crimping
[image:9.595.88.513.379.662.2]Figure 17. Pattern waveform graph for acoustic signals ASL an APK - Under crimping
Figure 18. Probe acoustic signals ASL and APK
5. Conclusions
The acoustic emission monitoring system is flexible, allowing for fast implementation of additional functions in order to adapt to the crimping of different composite insulators featuring different technical parameters.
By measuring the acoustic emissions during the process and comparing them to a configurable admissible threshold of acoustic emissions, “pull-out” and separation failures are prevented, which are indicative of the excessive straining of the composite insulator end-fitting. The system achieves an automatic classification of the
type of crimping, ensures the recording of the acoustic emission graph in a database, the storage of the values as TDMS files and generates automatic reports of the crimping process.
Acknowledgements
[image:10.595.85.512.374.586.2]REFERENCES
[1] IEEE Guide for Application of Composite Insulators, IEEE Std 987-2001 (Revision of IEEE Std 987-1985), 2002. [2] IEEE Guide for Application of Composite Line Post
Insulators, IEEE Std 1572-2004, 2004.
[3] K. O. Papailiou, F. Schmuck. Silicone Composite Insulators, Power Systems. Springer-Verlag Berlin Heidelberg, USA, 2013.
[4] M. Kumosa, Y. Han, L. Kumosa. Analyses of Composite Insulators with Crimped End-Fittings: Part I - Non Linear Finite Element Computation, Composites Science & Technology, Vol.62, No.9, 1191-1207, 2002.
[5] M. Kumosa, D. Armentrout, L. Kumosa, Y. Han, S. H. Carpenter. Analyses of Composite Insulators with Crimped End-Fittings: Part I - Suitable crimping conditions, Composites Science & Technology, Vol.62, No.9, 1209-1221, 2002.
[6] A. Vintilă. Monitoring and Control of Composite Insulators Crimping Process using the Acoustic Emissions Technique, Electrotehnică, Electronică, Automatică (EEA), Vol.6, No.3, 49-52, 2012.
[7] L. Zipin, L. Hongling, W. Youyin. External insulation strength assessment of contaminated insulator based on acoustic emission, Proceedings of the Power Engineering and Automation Conference, Wuhan, 1-4, 2012.
[8] B. Álvarez-Nasrallah, J. E. Candelo-Becerra, J. D. Soto-Ortiz, J. Pombo-Acevedo, O. Díaz-Aparicio. Correlation analysis between ceramic insulator pollution and acoustic emissions, Tecno Lógicas, Vol. 18, No. 34, 101-108, 2015.
[9] N. Feng, X. Zhang, Z. Zou, Y. Wang, S. Yi. Rail health monitoring using acoustic emission technique based on NMF and RVM, Proceedings of the IEEE International Instrumentation and Measurement Technology Conference (I2MTC), Pisa, 699-704, 2015.
[10] S. Patil, S. Goyal, B. Karkare. Performance evaluation of accelerated corrosion techniques using electrochemical measurements and acoustic emission parameters, Proceedings of the IEEE International Conference on Prognostics and Health Management (ICPHM), Ottawa, ON, 1-9, 2016.
[11] A. M. Madi, Y. He, L. Jiang. Design and testing of an improved profile for silicone rubber composite insulators, IEEE Transactions on Dielectrics and Electrical Insulation, Vol.24, No.5, 2930-2936, 2017.
[12] J. Dai, X. Liang, Y. Zhou, X. Ya. Stress concentration testing of composite insulators with crimped end-fittings, The 17th Annual Meeting of the IEEE Lasers and Electro-Optics Society, 619-622, 2004.
[13] F. Ju, L. Xidong, Y. Yu, W. Chengsheng, C. Ling. Application of acoustic emission technology on structure design and quality control of composite insulators, Proceedings of the 6th International Conference on Properties and Applications of Dielectric Materials, 358-361, 2000.
[14] G. S. Mothe, Y. H. Dandawate, V. Achwal. Signal processing system design for acoustic emission signatures detetction and analysis, Proceedings of the 2nd IEEE International Conference on Recent Trends in Electronics, Information & Communication Technology (RTEICT), Bangalore, 1373-1378, 2017.
[15] T. You, P. Li, G. Tong, J. Shen, Development of Acoustic Emission High-Speed Data Acquisition System, Advanced Materials Research, Vol. 433-440, pp. 5666-5671, 2012 [16] G. Mothe, Y. Dandawate, V. Achwal. Signal processing
system design for acoustic emission signatures detetction and analysis, Proceedings of the 2nd IEEE International Conference on Recent Trends in Electronics, Information & Communication Technology (RTEICT), 1373, 2017. [17] A. El-Hag, S. Mukhopadhyay, K. Al-Ali, A. Al-Saleh. An
intelligent system for acoustic inspection of outdoor insulators, Proceedings of the 3rd the International Conference on Condition Assessment Techniques in Electrical Systems (CATCON), Rupnagar, 122-125, 2017. [18] M. V. Autieri. Acoustic emission characterisation of
damage in CFRP composites: Use of a commercially available A.E. kit to discern damage signatures. VDM Verlag Dr. Müller, Germany, 2011.
[19] User Manual for the Family of Acoustic Emission Signal Conditioners ASCO-PXx, Online available from http://www.vallen.de/zdownload/pdf/ASCOmanE1512.pdf [20] J. Jovitha. Virtual Instrumentation using LabVIEW. PHI
Learning, India, 2010.