Journal of Chemical and Pharmaceutical Research, 2017, 9(6):37-44
Research Article
CODEN(USA) : JCPRC5
ISSN : 0975-7384
37
Development and Evaluation of Pregabalin Capsules Using QbD Approach
Vasantakumar Pai K
1, Harsha J
1, Gowda DV
2*, Praveen Sivadasu
2and Meenakshi S
31Department of Industrial Chemistry, Kuvempu University Shankaraghatta, B. R. Project, Shimoga, Karnataka,
India
2Department of Pharmaceutics, JSS University, JSS College of Pharmacy, SS Nagara, Mysore, Karnataka, India 3
Department of Prosthodontics, JSS University, JSS Dental College, SS Nagara, Mysore, Karnataka, India _____________________________________________________________________________
ABSTRACT
Quality by Design (QbD) approach was employed to formulate Pregabalin Capsules, with the objective of making thee formulation cost effective. The formulated capsules consist of Lactose monohydrate as Diluent, Maize starch as Disintegrant and Talc as Glidant. Capsules were prepared by manual filling. Design of Experimentation (DoE) was employed to evaluate the effect of excipient concentrations in the blend on the various parameters like tapped density, Carr’s index and Disintegration time. Results obtained from DoE suggested that increase in the concentrations of the blend, there is an increase in the responses which are in prescribed limit. In-vitro dissolution study of the optimized formulation had shown 100% release at 45th min whereas marketed formulation had shown 80% release. From this result it can be concluded that formulation of Pregabalin capsules using QbD approach has leaded to a cost effective and stable formulation.
Keywords: QbD approach; Pregabalin; Capsules; Design of experimentation; In-vitro release
_____________________________________________________________________________
INTRODUCTION
The pharmaceutical Quality by Design (QbD) is a systematic approach of development that begins with predefined objectives and emphasizes product and process understanding and process control, based on sound science and quality risk management [1]. Quality by Design (QbD) is an emerging approach to enhance the safety and efficacy of the drug supplied to the consumer, and also improves manufacturing quality performance.
QbD development process begins with a target product profile that describes the use, safety and efficacy of the product. It includes defining a target product quality profile that will be used by formulators and process engineers as a quantitative surrogate for aspects of clinical safety and efficacy during product development, gathering relevant prior knowledge about the drug substance, potential excipients and process operation and use risk assessment to prioritize knowledge gaps for further investigation [2,3].
38
The Pregabalin is a highly soluble and bioavailable drug and as per BCS classification this has been categorized as BCS class 1. Its solubility is pH independent and is freely soluble in all pH solutions ranging from pH 1.2 to 6.8. Tmax for Pregabalin is around 1.5-3 hours. It has more than 90% bioavailability and the absorption window is mainly stomach. The absorption is found to be independent of dose. It is primarily excreted in urine. It does not bind directly to GABAa or GABAb receptors but in turn enhances the density of GABA transporter proteins.
Pregabalin is an anticonvulsant and analgesic medication that was recently approved for adjunctive treatment of partial seizures in adults in both the United States and Europe and for the treatment of neuropathic pain from postherpetic neuralgia and diabetic neuropathy. It is both structurally and pharmacologically related to the anticonvulsant and analgesic medication gabapentin [6].
QbD approach will help in developing a robust, reproducible product with a manufacturing friendly process and desirable quality attributes built into it.
MATERIALS AND METHODS
Materials
Pregabalin was obtained from Biocon, Bangalore, India. The other chemicals and excipients used in the study were of analytical grade.
Methods
Defining the quality target product profile (QTPP) for Pregabalin capsules:
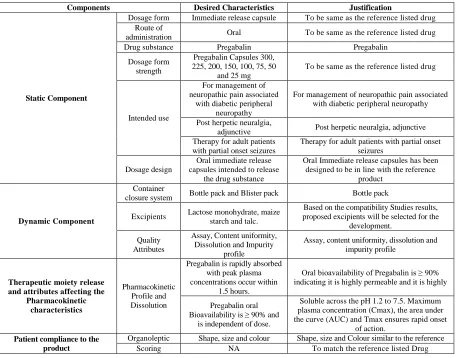
[image:2.612.81.538.345.703.2]Following is a prospective summary of the quality characteristics of Pregabalin capsules that are desired to be achieved, taking into account the safety and efficacy of Pregabalin capsules which is shown in Table 1.
Table 1: Quality target product profile (QTPP) for Pregabalin capsules
Components Desired Characteristics Justification
Static Component
Dosage form Immediate release capsule To be same as the reference listed drug
Route of
administration Oral To be same as the reference listed drug
Drug substance Pregabalin Pregabalin
Dosage form strength
Pregabalin Capsules 300, 225, 200, 150, 100, 75, 50
and 25 mg
To be same as the reference listed drug
Intended use
For management of neuropathic pain associated
with diabetic peripheral neuropathy
For management of neuropathic pain associated with diabetic peripheral neuropathy
Post herpetic neuralgia,
adjunctive Post herpetic neuralgia, adjunctive
Therapy for adult patients with partial onset seizures
Therapy for adult patients with partial onset seizures
Dosage design
Oral immediate release capsules intended to release
the drug substance
Oral Immediate release capsules has been designed to be in line with the reference
product
Dynamic Component
Container
closure system Bottle pack and Blister pack Bottle pack
Excipients Lactose monohydrate, maize
starch and talc.
Based on the compatibility Studies results, proposed excipients will be selected for the
development.
Quality Attributes
Assay, Content uniformity, Dissolution and Impurity
profile
Assay, content uniformity, dissolution and impurity profile
Therapeutic moiety release and attributes affecting the
Pharmacokinetic characteristics
Pharmacokinetic Profile and Dissolution
Pregabalin is rapidly absorbed with peak plasma concentrations occur within
1.5 hours.
Oral bioavailability of Pregabalin is ≥ 90% indicating it is highly permeable and it is highly
Pregabalin oral Bioavailability is ≥ 90% and
is independent of dose.
Soluble across the pH 1.2 to 7.5. Maximum plasma concentration (Cmax), the area under the curve (AUC) and Tmax ensures rapid onset
of action.
Patient compliance to the product
Organoleptic properties
Shape, size and colour Shape, size and Colour similar to the reference
product will be used for patient acceptability
39
Identification of Critical Quality Attributes (CQA’s) for Pregabalin capsules:
[image:3.612.89.523.149.244.2]Based on the above mentioned QTPP the following CQA’s were established for the development of Pregabalin Capsules. CQA include the product attributes that have the potential to be altered by changes to process parameters or formulation variables during pharmaceutical development. These are directly related to the safety and efficacy of Pregabalin Capsules which are shown in Table 2.
Table 2: Critical Quality Attributes (CQA’s) for Pregabalin capsules
Critical Quality Attribute Range or Value Reference / Discussion or development activities conducted to achieve the CQA
Assay 90-110% As recommended By USP
Content uniformity L1=15.0 or L2=25.0 As recommended By USP
Dissolution 5, 10, 15, 20, 30 and 45 Minutes In-house
Impurity profile
a) PRB II : NMT 0.2% b) PRB III : NMT 0.2% c) Unidentified impurity: NMT 0.20% each
d) Total Impurities: NMT 1.0%
As per ICH guidelines Impurities in New Drug Products Q3BR2
Identification of the Critical Material Attributes (CMA) for the drug substance and excipients that have an impact on the CQA of the drug product:
The critical material attributes of the excipients are discussed below in Table 3. The CMA’s of excipient that have an impact on the CQA of the drug product were also summarized below.
Table 3: Critical material attributes (CMA) for the drug substance
Material Attribute Reference/Discussion or development activities conducted to confirm the CMA
Lactose monohydrate Maize starch Talc
Functional use Diluent Disintegrant Glidant
Compendial Requirements Complies
Interaction with drug substance Compatibility studies were performed and the above excipients were found to be
compatible with drug substance. There was no significant degradation
Impact of excipient concentration and characteristics on
drug product performance or manufacturability Impact of the excipient concentration was evaluated by Design of experiments
Manufacturing process of Pregabalin capsules:
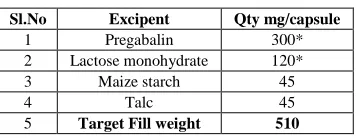
Pregabalin capsules were prepared by employing various excipients as shown in the formulation chart i.e. Table 4. Weighed quantity of Pregabalin, Lactose mono and Maize starch were shifted through sieve no.40 and blended for 10 minutes in a blender. After blending the blend was discharged from the blender, again passed through sieve no.40 and blended for 10 minutes. Talc shifted through sieve no.40 along with the other shifted materials and blended for 5 minutes. Encapsulation was done using a MF30 (Manual filling) machine with a target fill weight of 510 mg in size 0 empty capsules.
Table 4: Composition for an individual capsule
Sl.No Excipent Qty mg/capsule
1 Pregabalin 300*
2 Lactose monohydrate 120*
3 Maize starch 45
4 Talc 45
5 Target Fill weight 510 Characterization of blend:
The obtained blend was evaluated for their characteristics parameters like Bulk density, Tapped density, Carr’s index, Hausner’s ratio and Angle of repose.
Bulk density: Bulk density is determined by pouring the blend into a graduated cylinder via a large funnel and measuring the weight and volume obtained by the blend without tapping and calculated [7].
Tapped density: Tapped density is determined by placing a graduated cylinder containing known mass of blends on
[image:3.612.218.398.537.606.2]40
Carr’s index: Carr’s index was measured using the values of the bulk density and tapped density [8].
Angle of repose: Weighed quantity of granules was passed through a funnel kept at a height of 2 cm from the base. The powder is passed till it forms heap and touches the tip of funnel. The radius was measured and angle of repose was calculated [9].
Hausner’s ratio: Hausner’s ratio was determined by the ratio between the tapped density to that of the bulk density [9].
Evaluation of capsules:
Lock length: Ten individual capsules were taken from formulation trial batch and lock length was measured manually by using vernier callipers and average of ten capsules was noted [10].
Disintegration time: The capsules were placed in the basket rack assembly, which is 15 repeatedly immersed 30 times per minute into a thermostatically controlled fluid at 37ºC. To fully satisfy the test, the capsules should disintegrate completely into a soft mass having no palpably firm core without any fragments of the gelatin shell. If one or two capsules fail, the test should be repeated on additional of 12 capsules. Then, not fewer than 16 of the total 18 capsules tested should disintegrate completely [11].
Dissolution studies: The release of Pregabalin was determined using a dissolution apparatus of USP Type II (paddle) at 50 rpm. 900 ml of 0.06 N hydrochloric solution acid was used as the dissolution medium and were maintained at the temperature of 37.5 ± 0.5°C. A sinker was used to avoid capsule flotation. The samples were drawn at 5, 10, 15 30 and 45 min and equal amount of fresh medium were replaced to maintain the sink conditions. Samples withdrawn were analyzed to determine the percentage of drug released [12].
Optimization of formulation using DoE:
A Design of Experiment (DoE) with Simplex centroid design having three replicates at the center was used for the optimization study. The effect of formulation variables on response variables was evaluated by one way ANOVA [13].
RESULTS AND DISCUSSION
Characterization of Blend
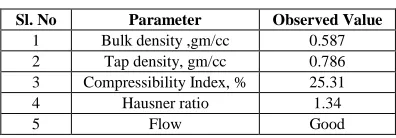
From the results obtained it was evident that all the parameters were found to be in acceptable range including the flow which was confirmed by the Hausner ratio which is shown in Table 5.
Table 5:Characterization of blend
Sl. No Parameter Observed Value
1 Bulk density ,gm/cc 0.587
2 Tap density, gm/cc 0.786
3 Compressibility Index, % 25.31
4 Hausner ratio 1.34
5 Flow Good
Evaluation of Capsules
[image:4.612.207.405.504.573.2]From the results obtained it was evident that all the evaluation parameters are in prescribed range and are shown in Table 6.
Table 6: Evaluation of Pregabalin capsules
Sl. No Parameter Observed Value
1 Filled Capsule weight (mg) 591-603
2 Fill weight (mg) 492-512
3 Disintegration Time (Minutes and Seconds) 2’ 02” -2’19”
41
Dissolution Studies
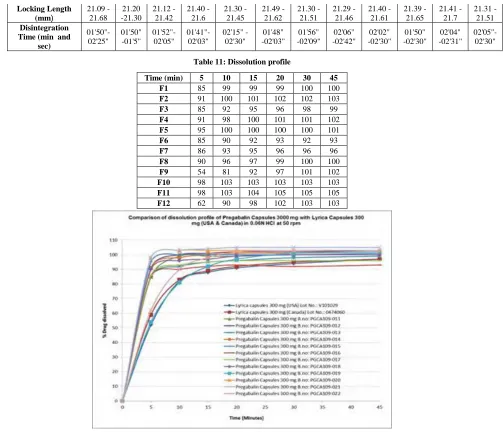
[image:5.612.159.456.144.299.2]Dissolution studies of the formulated Pregabalin capsules were compared with two market products i.e. Lyrica capsules 300 mg both USA and Canada. From the results obtained it was evident that formulated Pregabalin capsules showed 106% drug release at 45 min, while the marketed capsules had shown a release of 97% at 45 min. These results suggests that formulated Pregabalin capsules had shown better dissolution profile than of the marketed formulations and the results are shown in the form of a graph in Figures 1 and 2.
Figure 1: Comparison of the dissolution profile with marketed formulations
Optimization of Formulation using DoE
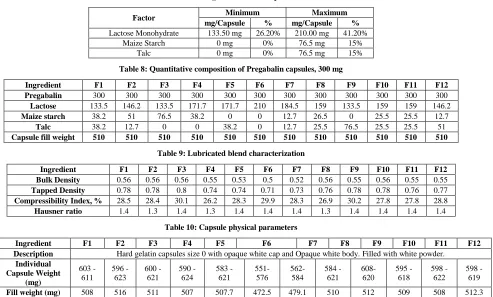
[image:5.612.75.568.412.709.2]In the preliminary trails it was observed that density of the blend has significant influence on the fill weight of capsule and on en-capsulation process. Hence further trials were planned by design of experiments to evaluate the effect of density on the encapsulation process and to determine the fill weight for the each strength. A Design of Experiment (DOE) with Simplex centroid design having three replicates at the center was used for the optimization study. The following ranges around the target formulation were investigated using design of experiments (Tables 7-11).
Table 7: Ranges of various excipients
Factor Minimum Maximum
mg/Capsule % mg/Capsule %
Lactose Monohydrate 133.50 mg 26.20% 210.00 mg 41.20%
Maize Starch 0 mg 0% 76.5 mg 15%
Talc 0 mg 0% 76.5 mg 15%
Table 8: Quantitative composition of Pregabalin capsules, 300 mg
Ingredient F1 F2 F3 F4 F5 F6 F7 F8 F9 F10 F11 F12
Pregabalin 300 300 300 300 300 300 300 300 300 300 300 300
Lactose 133.5 146.2 133.5 171.7 171.7 210 184.5 159 133.5 159 159 146.2
Maize starch 38.2 51 76.5 38.2 0 0 12.7 26.5 0 25.5 25.5 12.7
Talc 38.2 12.7 0 0 38.2 0 12.7 25.5 76.5 25.5 25.5 51
Capsule fill weight 510 510 510 510 510 510 510 510 510 510 510 510
Table 9: Lubricated blend characterization
Ingredient F1 F2 F3 F4 F5 F6 F7 F8 F9 F10 F11 F12
Bulk Density 0.56 0.56 0.56 0.55 0.53 0.5 0.52 0.56 0.55 0.56 0.55 0.55
Tapped Density 0.78 0.78 0.8 0.74 0.74 0.71 0.73 0.76 0.78 0.78 0.76 0.77
Compressibility Index, % 28.5 28.4 30.1 26.2 28.3 29.9 28.3 26.9 30.2 27.8 27.8 28.8
Hausner ratio 1.4 1.3 1.4 1.3 1.4 1.4 1.4 1.3 1.4 1.4 1.4 1.4
Table 10: Capsule physical parameters
Ingredient F1 F2 F3 F4 F5 F6 F7 F8 F9 F10 F11 F12
Description Hard gelatin capsules size 0 with opaque white cap and Opaque white body. Filled with white powder.
Individual Capsule Weight
(mg)
603 - 611
596 - 623
600 - 621
590 - 624
583 - 621
551-576
562-584
584 - 621
608-620
595 - 618
598 - 622
598 - 619
42
Locking Length (mm) 21.09 -21.68 21.20 -21.30 21.12 -21.42 21.40 - 21.6 21.30 -21.45 21.49 -21.62 21.30 -21.51 21.29 -21.46 21.40 -21.61 21.39 -21.65 21.41 -21.7 21.31 -21.51 Disintegration Time (min and [image:6.612.64.567.68.500.2]sec) 01'50"-02'25" 01'50" -01'5" 01'52"-02'05" 01'41"-02'03" 02'15" -02'30" 01'48" -02'03" 01'56" -02'09" 02'06" -02'42" 02'02" -02'30" 01'50" -02'30" 02'04" -02'31" 02'05"-02'30"
Table 11: Dissolution profile
Time (min) 5 10 15 20 30 45
F1 85 99 99 99 100 100
F2 91 100 101 102 102 103
F3 85 92 95 96 98 99
F4 91 98 100 101 101 102
F5 95 100 100 100 100 101
F6 85 90 92 93 92 93
F7 86 93 95 96 96 96
F8 90 96 97 99 100 100
F9 54 81 92 97 101 102
F10 98 103 103 103 103 103
F11 98 103 104 105 105 105
F12 62 90 98 102 103 103
Figure 2: Comparison of dissolution profile of Pregabalin capsules with marketed formulations
The data was analysed and the relationship between the formulation factors and the resultant responses were constructed.
Effect of formulation variables on responses:
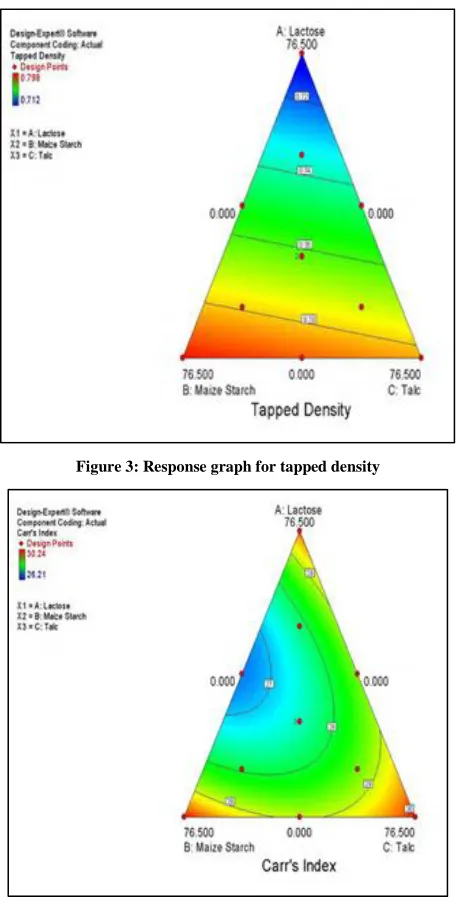
Tapped density: Change in the concentration of Lactose monohydrate, Maize starch and talc has a significant influence on the Tapped density of the Blend. Increase in the Lactose monohydrate concentration is decreasing the Tapped density of the blend. Increase in the Maize starch concentration is increasing the Tapped density of the Blend. Increase in the Talc concentration doesn’t increase the Tapped density of the Blend significantly (Figure 3). The relationship between the factors and the Tapped density is as follows:
Tapped density = +9.24401E-003 * Lactose-+0.010407 * Maize Starch-+0.010237 *Talc \
Carr’s index: Change in the concentration of Lactose monohydrate, Maize starch and Talc has no significant influence on the Carr’s index of the Blend. Whereas the Lactose monohydrate and Maize starch mixture (AB) has a significant influence on the Carr’s index of the Blend. Increase in the Lactose monohydrate and Maize starch mixture (AB) concentration is increasing the Carr’s index of the Blend. The effect is not significant in the case of Lactose monohydrate and Talc mixture (AC) and Maize starch and talc mixture (BC) (Figure 4).
43
[image:7.612.192.420.106.558.2]Carr’s index = +0.39134 * Lactose+0.39360 * Maize Starch+0.39425 * Talc-2.26838E-003 * Lactose * Maize Starch (AB)-8.84301E-004 * Lactose * Talc (AC)-8.11602E-004 * Maize Starch * Talc (BC)
Figure 3: Response graph for tapped density
Figure 4: Response graph for Carr’s index
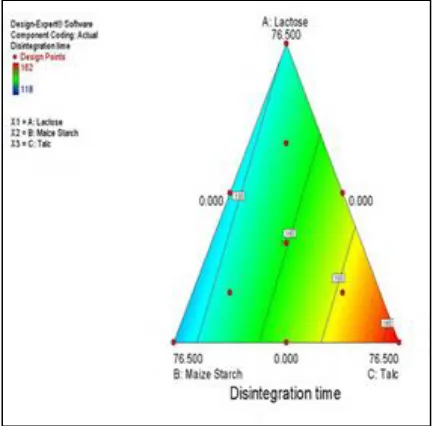
Disintegration time: Change in the concentration of talc has a significant influence on the Disintegration time of the capsules. Increase in Talc concentration is increasing the Disintegration time of the capsules. Lactose monohydrate and Maize starch has no significant effect on the disintegration time of the capsules (Figure 5).
The relationship between the factors and the disintegration time is as follows:
44
Figure 5: Response graph for disintegration time
CONCLUSION
Pregabalin capsules were formulated using manual filling machine. It was observed that no significant difference in the dissolution profile of Pregabalin capsules with RLD, hence direct filling approach was proposed for further trials. In addition the further trials were planned by DoE to evaluate the effect of density on encapsulation and fill weight for each strength. Results obtained from DoE suggest that the excipients have a phenomenal effect on capsules, as the concentration of the excipient increases there is an increase in the blend characteristics. Hence it can be concluded that employing QbD approach in the formulation of Pregabalin capsules has leaded to a pharmaceutically equivalent, low cost, quality improved and stable formulation.
ACKNOWLEDGEMENTS
The authors express their gratitude to the JSS University and JSS College of Pharmacy for providing necessary support in due course of the work.
Conflict of Interest
The author confirms that this article content has no conflict of interest.
REFERENCES
[1] A Ghosh; KS Gupta. Asian J Pharm Res Health Care. 2010, 2(3), 222-227. [2] A Sharma; S Sharma; KK Jha. Pharm Res. 2009, 1(1), 15-22.
[3] RS Gujral; SM Haque; S Kumar. Afr J Pharm Pharmacol. 2009, 3(6), 327-334. [4] H Salem. J Chem. 2009, 6(2), 332-340.
[5] CP Taylor; T Angelotti; E Fauman. Epilepsy Res. 2007, 73(2), 137-150.
[6] K Fink; W Meder; DJ Dooley; M Göthert. Br J Pharmacol. 2000, 130(4), 900-906. [7] P Pate; A Roy; SM Vinod Kumar; M Kulkarni.Int J Drug Dev Res. 2011, 3(1), 52-61.
[8] M Manikandan; K Kannan; S Thirumurugu; R Manavalan. Res J Pharm Biol Chem Sci. 2012, 3(1), 425-434.
[9] SK Singh; V Sharma; K Pathak. Int J Pharm Pharm Sci. 2012, 4, 168-174.
[10] MA Kumar; PK Lakshmi; J Balasubramanium. Int J Pharm Tech Res. 2011, 3(2), 968-979. [11] SR Vachhani; JJ Patel; D Patel; ST Prajapati; CN Patel. J Chem Pharm Res. 2010, 2(2), 57-64.
[12] GS Banker, NR Anderson. Tablets. In: Lachman L, Lieberman HA, Kanig JL. The theory and practice of industrial pharmacy. 3rd edition. CBS publishers and distributors. New Delhi. 2009, 316.