International Journal of Emerging Technology and Advanced Engineering
Website: www.ijetae.com (ISSN 2250-2459, Volume 2, Issue 6, June 2012)36
A Unique Method of Study on Power & Loss Allocation
of a Multibus Power System Employing Facts Controllers
Priyanath Das
1, Sunita Halder nee Dey
2, Abhijit Chakrabarti,
3Madhumita Mandal
41Associate Prof., NIT Agartala,India, 2Assistant Prof., Jadavpur University,India
3Vice Chancellor,Jadavpur University, India
,
4PG Scholar,BESU,India1[email protected] 2[email protected] 3[email protected]
Abstract— This paper deals with the loss allocation problem of any interconnected power system. In this paper, an attempt is made to minimize the transmission line loss using FACTS controllers. Two most commonly used FACTS controllers; TCSC and STATCOM are utilized here to reduce the loss. The contribution of system generators at a particular operating load has been calculated using power tracing algorithm and STATCOM is found to be most effective to reduce required system generation as well as line loss. At the same time voltage stability of the system has also been analyzed using network equivalencing technique. The analysis has been presented here using a robust practical 203-bus (Indian Eastern Grid) system,
Keywords— Power tracing, loss allocation TCSC, STATCOM,
Weak bus, FACTS Controllers
I. INTRODUCTION
In modern deregulated power industry different generating agencies use the same transmission lines and therefore it has become very much necessary to know the exact contribution of each generation to cater a particular load along with loss. Tracing the flow of electricity is very important to the power system engineers and designers for designing an efficient power system network. The knowledge of composition of power flow is also very useful to cost assignment [6, 8], congestion management, ancillary services and decision on scheduling of generators. The power from central sector generators is transmitted to the constitute state via transmission network erected by CTU. The constitutes are billed monthly for wheeling charges called transmission service charge, which are proportional to their total allocated share in the central sector power pool for the month. This makes the wheeling charge method approximate, in which the actual use of transmission lines are not taken into account. Therefore a proper pricing scheme is required including transmission line loss to cater a particular load by a particular generator [6].
J. Bialek (1996) proposed a “Distribution Factor” based algorithm [1, 3]. The method is useful to decide the charges for transmission loss, reactive power and transmission services for any particular generating company [2]. Wu et al (2000) proposed a “Graph Theory” based algorithm [5] for trace out the total network power. Both of these algorithms are based on proportional share technique and very much effective to solve the power tracing problems. These methods are very useful to decompose the generated power into transmission losses and loads [2, 7, 11, 12].
Gradually advanced power tracing methodologies have come up with several operational and geographical criteria [3]. Researchers have developed a number method to trace the electric power in deregulated power market and among them proportional sharing algorithm is the most popular one for its simplicity [5, 7, 8, 11, 12].
FACTS controllers are an integrated part of modern power system. Facts controllers are highly capable to erase out the major problems of EHV AC transmission. Researchers have developed several models of FACTS controllers to include them in the mathematical model of power system analysis [4, 9, 10].
In this paper power tracing algorithm using proportional sharing method has been adopted to allocate load and loss among system generators. FACTS controllers have been modeled and incorporated in load flow analysis and then their effects on transmission line loss have been investigated using the power tracing algorithm.
II. THEORY : THE POWER TRACING
International Journal of Emerging Technology and Advanced Engineering
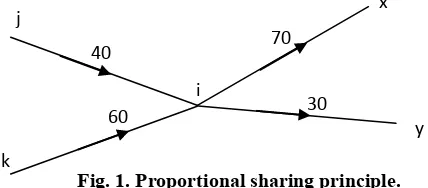
Website: www.ijetae.com (ISSN 2250-2459, Volume 2, Issue 6, June 2012)37 In this method power supplied to a particular load will be shared by the system generators in proportion to the line flow. It is shown in Fig.1 that power comes at node i from generating node j and k the transmission lines j-i and k-i. Node i supplies to the load nodes x and y. The total active power inflow in node-i is,
P
i
40 60 100
MW. According to proportional sharing principle each MW leaving the node-i will be in the same proportion of the inflows in node-i. Therefore 70MW load supplied to node-x through theline i-x consists of
70
40
28
100
MW supplied by line j-i,i.e., the generator in bus-j and
70
60
42
100
MW suppliedby line k-i, i.e., the generator in bus-k. Similarly 30MW load supplied to node-y through the line i-y consists of
40
30
12
100
MW supplied by line j-i, i.e., the generator inbus-j and
30
60
18
100
MW supplied by line k-i, i.e., thegenerator in bus-k.
So proportional sharing method is actually based the Kirchhoff‟s current law. It assumes that the network node is the perfect mixture of incoming flows. In the Fig.1 four lines are connected to bus-i. Two lines j→i and k→i are inflows and two lines i→x and i→y are outflow. According to proportional sharing principle the outflow power can be represented in terms inflow power as –
i x i x
i x j i k i
j i k i j i k i
P P
P P P
P P P P
(1a)
(1a)
i y i y
i y j i k i
j i k i j i k i
P P
P P P
P P P P
(1b)
(1b)
This method use a topological approach to determine the contribution of individual generator to every line flow based on the calculation of distribution factor. This method is applicable both DC power flows and AC power flows (both active and reactive). This method follows both the upstream looking (load to generators) and downstream looking (generators to loads) algorithms. In upstream looking algorithm transmission usage is allocated to individual generators and losses are assigned to loads. In downstream looking algorithm transmission usage is allocated to individual loads and losses are assigned to generators. In this thesis upstream looking algorithm has been adopted.
III.
U
PSTREAML
OOKINGA
LGORITHMN
EGLECTINGT
RANSMISSIONL
INEL
OSSAssuming the transmission lines to be lossless, total active power inflow at bus-i of a n-bus power system can be represented as
1
n
i j i Gi
j j i
P
P
P
(2) (2)where,
P
j i
line inflow from bus-j to bus-i,Gi
P
generated power at bus-i.It should be noted here that if losses are neglected then,
i j j i
P
P
andP
j i will then be considered in equitation (2) only ifP
j i
0
; this means bus-j is supplying power to bus-i.Equation (2) can be expressed in terms of the contribution of power generation of bus-j as follows
1
n j i
i j Gi
j j
j i
P
P
P
P
P
or,
1
n
i ji j Gi
j j i
P
c P
P
where ji j ij
P
c
P
iy x j
k
30 70
[image:2.612.55.269.130.224.2]60 40
International Journal of Emerging Technology and Advanced Engineering
Website: www.ijetae.com (ISSN 2250-2459, Volume 2, Issue 6, June 2012)38 or,
1
n
i ji j Gi
j j i
P
c P
P
We can write in matrix form,
A P P
u
G (3) (3)Where
A
u in an n
upstream distribution matrix, P is a vector of bus flows andP
G is a vector of bus generation.The elements of
A
umatrix is given by1
for
for
,
0
0
otherwise
ij
u ji j i j j i
i
j
A
c
P
P
i
j P
(4) (4)
It should be noted here that
P
j i will be greater than zero only if bus-j actually supplied power to bus-i. From equation (3)1
u G
P A P
(5) (5)Therefore load demand at i-th load bus may be calculated as
1
1 ij
n
Li Li
Li i u Gj
j
i i
P
P
P
P
A P
P
P
(6) (6)Therefore contribution of j-th generator to the load of i-th bus may be calculated as follows
1 ij j Li Gj Li u i
P
P
A
P
P
(7) (7)It should be noted here that any practical power system may be converted to loss less system to apply the above method by using average line flows.
IV. UPSTREAM LOOKING ALGORITHM CONSIDERING
TRANSMISSION LINE LOSS
The transmission line losses can be included to power tracing method [1] by calculating gross bus powers. A generator bus of a power system may get power from the generator connected to it and also from the transmission lines connected to it. Therefore for generator buses,
power inflows
grossGi i
P
P
i.e.,
1
n gross
Gi j i
i
j j i
P
P
P
(8a) (8a)Similarly a load bus of a power system may supply power to the load connected to it and also to the other buses through the transmission lines connected to it. Therefore for load buses,
power outflows
grossLi i
P
P
i.e.,
1
n gross
Li i j
i
j j i
P
P
P
(8b) (8b)Equation (8a) can be expressed in terms of the contribution of power generation of bus-j as follows
1
n j i
gross gross
Gi
i gross j
j j
j i
P
P
P
P
P
or, 1 ngross gross gross Gi
i ij j
j j i
P
c
P
P
where ijgross j i gross j
P
c
P
or, 1 ngross gross gross Gi
i ij j
j j i
P
c
P
P
We can write in matrix form,
A P
u gross
P
G (9) (9)International Journal of Emerging Technology and Advanced Engineering
Website: www.ijetae.com (ISSN 2250-2459, Volume 2, Issue 6, June 2012)39 In this case the elements of
A
umatrix is given by1 for
for , 0
0 otherwise
ij
gross gross
u ij j i j j i
i j
A c P P i j P
(10)
It should be noted here that
P
j i will be greater than zero only if bus-j actually supplied power to bus-i.From equation (9)
1 gross
u G
P
A P
(11) (11)Therefore gross power at i-th load bus may be calculated as
gross
gross Li gross
i Li gross i
P
P
P
P
or, 1
1 ij
n gross Li
Gj
Li gross j u
i
P
P
A P
P
(12) (12)Therefore contribution of j-th generator to the gross power of i-th load bus may be calculated as follows
1
j
ij
gross Li
Gj
Li gross u
i
P
P
A P
P
(13) (13)The contribution to loss of any j-th generator to cater a particular load at i-th bus may be calculated from equations (7) and (13) as follows
j i
j gross j
Li Li
loss
P
P
P
(14) (14)V. MODELING OF FACTSCONTROLLERS TCSC
Steady state power flow model of TCSC
Fig.2 shows a schematic representation of a TCSC, which consists of a series capacitor in parallel with a Thyristor Controlled Reactor (TCR) and connected in a transmission line between bus n and m of a power system.
The TCSC modifies the line reactance in order to control the power flow through the line. The equivalent reactance of TCSC being the combination of reactance of fixed capacitor and thyristor controlled reactor. It is a function of the firing angle α of the TCR and can represented by the following equation [7],
1 2 22 sin 2
cos tan tan
TCSC C
X X C
C (15) where 2 0
1 C LC; 2 4 LC; ; 0 1 ; L
X X X
C C X LC
and LC C L ; 2 and 900 1800
C L X X
X f
X X
The impedance of the transmission line between buses n and m with TCSC thus is modified as,
nm LINE LINE TCSC
Z R j X X
The corresponding elements of [YBus] matrix between
buses n and m are modified to include new values of Znm to include the effect of the TCSC.
The TCSC‟s firing angle α is considered as a system variable to implement it in Newton-Raphson load flow program and the linearized load flow equations for a N bus p system with TCSC at line n-m are given as:
XL INE
RLI NE
Bus-n X Bus-m
C
X
L XT CSC
ILO OP
International Journal of Emerging Technology and Advanced Engineering
Website: www.ijetae.com (ISSN 2250-2459, Volume 2, Issue 6, June 2012)40 (16) At the end of the ith iteration, the variable firing angle αis
updated as, αi+1 = αi + ∆αi. The elements of the admittance matrix are modified accordingly for the new value of XTCSC which depends upon the firing angle α. If α is withinlimits (900 ≤ α ≤ 1800), the specified active power flow is attained.
However, if α goes beyond limits, it is fixed at the violated limit and the active power flow through the line is uncontrolled and determined by the fixed reactance of the TCSC.
VI.
M
ODELLING OF STATCOMFig.3 shows a schematic representation of a STATCOM connected with i-th bus of a power system and it consists of a coupling transformer, a converter and a DC capacitor. STATCOM regulates the terminal voltage by changing the reactive power injected or absorbed by it. In order to implement the STATCOM in Newton Raphson power flow equation, a separate bus i.e., a controllable voltage source with controllable voltage magnitude and angle (Vsh δsh) is assumed to be connected to the bus of the power network via an impedance due to the coupling transformer Zsh=Rsh + jXsh, where Vsh is proportional to Vdc (capacitor voltage) of the STATCOM [11].
The bus of the power network to which the STATCOM is connected is modelled as a specially controlled PV bus where the active and reactive power injections and the voltage magnitude are specified, while the voltage phase angle of ac system bus, control angle and ac voltage of STATCOM are treated as state variables and the linerised power flow equation can be written as
(16)
(17)
The performance of STATCOM depends upon the ac current Isinjection from STACOM to system bus-i. If the ac current Isis not within the specified limits, then Iswill be kept fixed at the respective limits and the modified power flow equation will be
Is
Ysh = Gsh + jBsh
Is
Bus-i
Vsh δsh
Vdc
Fig.3. STATCOM connected to the power system bus via a step down transformer.
Bus-i
Bus-sh
International Journal of Emerging Technology and Advanced Engineering
Website: www.ijetae.com (ISSN 2250-2459, Volume 2, Issue 6, June 2012)41 (18)
Both of these models of STATCOM are used for representing STATCOM in load flow studies.
VII.
S
IMULATION,
R
ESULTSA
NDD
ISCUSSIONSThe power tracing method described above, has been applied to a practical 203 bus India Eastern Grid (WBSEB system) using a computer software developed in MATLAB including TCSC and STATCOM model in load flow computation. The WBSEB system has 24 generators, 35 three-winding transformers, 37 two winding transformers and 108 load buses which are interconnected by 267 transmission lines. TCSC parameters used here are: 1) Capacitive reactance, XC = 0.185 p.u. and 2) Inductive reactance, XL=
0.05 p.u. It is to be mentioned here that 1350 corresponds
to resonance in case of TCSC and therefore this firing angle should be avoided during system simulation. The STATCOM rating is chosen such that the maximum capacitive current is equal 0.3431 p.u. and the maximum reactive power injected is 34.31 MVar at 1.00 pu terminal voltage. The transformer reactance connecting the STATCOM to the system bus is chosen as 0.1 p.u. The STATCOM has been assumed to be installed at the weakest bus of the system. TCSC is assumed to be connected in any one of the transmission lines connected with the weakest bus and it regulates 10% more power flow through the line. It should be noted here that only one FACTS controller has been considered at a time for simulation.
Reactive power sensitivity analysis [13] reveals that and bus no. 172 is the weakest bus of the WBSEB system. To simulate the change in system load status, the complex load at the weakest has been changed in steps keeping power factor constant until load flow program fails to converge. It should
be clear that the load increase is possible with any one or more bus in the system. The weakest bus of system is considered here only to describe the methodology; any other system bus may also be selected. It is found that there is only one transmission line connected to the weakest bus (bus no. 172) of system. Therefore two other lines i.e., line 12 and 13 have been selected to observe the effectiveness of FACTS controllers.
Proportional sharing principle is used in this paper for tracing the power. Contribution of each generator has been calculated to cater a particular load including transmission line losses. In this paper only the sharing the load of the weakest bus of the system among system generator has been reported to accommodate the result and to avoid repetition.
0.5 1 1.5 2 2.5 3 3.5 4 4.5 5
0.15 0.25 0.35 0.45
C
han
ge
i
n
co
nt
ri
bu
tio
n
of
G
en
-20
(i
n
%
)
Active load for bus-172 in p.u.
Fig.4. Perncentage change in active power contribution of Gen-20 to cater the load of bus-172 under different loading condittions.
STATCOM at bus 172 TCSC at line 13 TCSCat line 12
Fig.4 shows the percentage change in contribution of active generation of generator 20 to cater the load of the weakest bus under different operating conditions. The contribution of the generator 20 has been monitored here to observe the effect of FACTS controllers. It is clear from Fig.4 that introduction of TCSC is not so effective to reduce the contribution as that of the STATCOM. The percentage change in contribution with a particular FACTS device has been computed with respect to the contribution of the generator without any FACTS controller in the system.
International Journal of Emerging Technology and Advanced Engineering
Website: www.ijetae.com (ISSN 2250-2459, Volume 2, Issue 6, June 2012)42
0 0.002 0.004 0.006 0.008 0.01 0.012 0.014 0.016 0.018 0.02
0 0.1 0.2 0.3 0.4
C
on
tr
ib
utio
n
o
f Ge
n-20
[image:7.612.58.287.134.509.2]Reactive load for bus-172 in p.u. Fig.5. Reactive power contribution of Gen-20 to cater the reactive load at bus-172
without any FACTS controller TCSC at line 12
TCSC at line 13 STATCOM at bus 172
0 5 10 15 20 25 30 35 40 45
0.15 0.25 0.35 0.45
Ch
ang
e
in
a
ct
ive
l
os
s
al
loc
at
ed
to
G
en
-20
(i
n
%)
[image:7.612.60.287.138.323.2]Active load for bus-172 in p.u.
Fig.6. Perncentage change in active power loss allocated to Gen-20 to cater the load of bus -172 under different loading condittions.
STATCOM at bus 172 TCSC in line 13 TCSC in line 12
The percentage change in active power loss allocated to gen-20 to cater load-172 is shown in Fig.6. It has been observed that FACTS controllers are capable to reduce active power loss considerably. So from Figs. 4, 5 and 6, it is clear that with introduction of FACTS controller generator share higher contribution to load along with lesser transmission line loss.
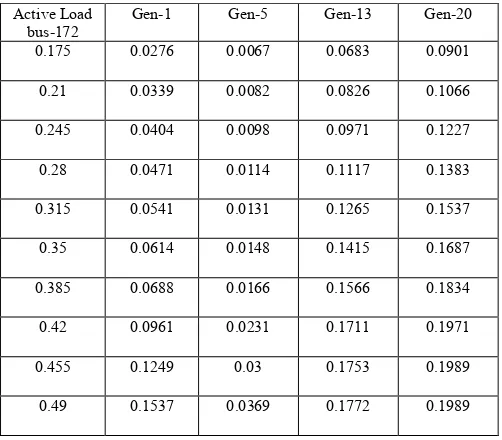
From the simulation results it has been observed that generators 1, 5, 13 and 20 share the load of bus 172 during power transmission. Table 1- 4 show the sharing of the generators for different operating conditions. It should be clear here that the generator contributions are tabulated including transmission line losses. It has been clearly observed that introduction of FACTS controllers strongly affect the active power sharing of the generators to cater a
[image:7.612.319.570.223.443.2]load at a load bus (here load of bus 172). Here contributions of generators 1, 5, 13 have increased while that has been decreased for generator 20 for TCSC applications in line 12 and 13. It has been observed that STATCOM is more capable to reduce the generator contributions to cater a particular load.
TABLE 1: SHARING OF ACTIVE POWER GENERATION TO CATER LOAD OF BUS-172 WITHOUT FACTS CONTROLLERS
Active Load
bus-172 Gen-1 Gen-5 Gen-13 Gen-20 0.175 0.0276 0.0067 0.0683 0.0901
0.21 0.0339 0.0082 0.0826 0.1066
0.245 0.0404 0.0098 0.0971 0.1227
0.28 0.0471 0.0114 0.1117 0.1383
0.315 0.0541 0.0131 0.1265 0.1537
0.35 0.0614 0.0148 0.1415 0.1687
0.385 0.0688 0.0166 0.1566 0.1834
0.42 0.0961 0.0231 0.1711 0.1971
0.455 0.1249 0.03 0.1753 0.1989
0.49 0.1537 0.0369 0.1772 0.1989
TABLE 2: SHARING OF ACTIVE POWER GENERATION TO CATER LOAD OF BUS-172 WITH TCSC IN LINE 12
Active Load bus-172
Gen-1 Gen-5 Gen-13 Gen-20
0.175 0.028 0.0068 0.0689 0.0883
0.21 0.0343 0.0083 0.0833 0.1045
0.245 0.0409 0.0099 0.0978 0.1203
0.28 0.0477 0.0115 0.1125 0.1357
0.315 0.0548 0.0132 0.1273 0.1508
0.35 0.0621 0.015 0.1423 0.1655
0.385 0.0696 0.0168 0.1574 0.1801
0.42 0.0877 0.0211 0.1689 0.1901
0.455 0.1196 0.0287 0.1793 0.1989
0.49 0.1483 0.0356 0.1814 0.1989
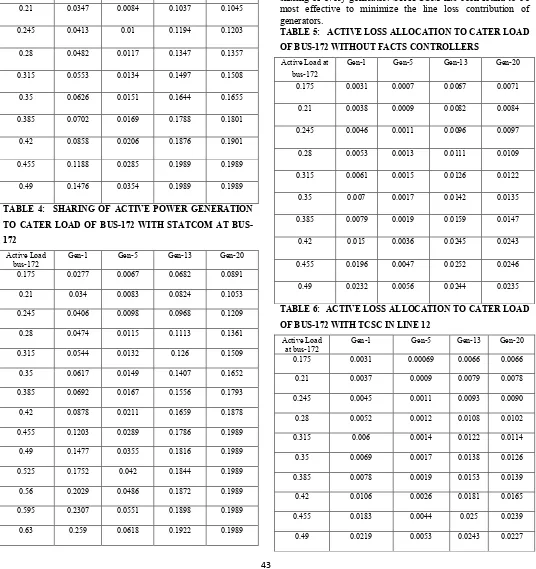
[image:7.612.63.286.333.509.2] [image:7.612.318.578.468.687.2]International Journal of Emerging Technology and Advanced Engineering
Website: www.ijetae.com (ISSN 2250-2459, Volume 2, Issue 6, June 2012)43
Active Load bus-172
Gen-1 Gen-5 Gen-13 Gen-20
0.175 0.0283 0.0069 0.0876 0.0883
0.21 0.0347 0.0084 0.1037 0.1045
0.245 0.0413 0.01 0.1194 0.1203
0.28 0.0482 0.0117 0.1347 0.1357
0.315 0.0553 0.0134 0.1497 0.1508
0.35 0.0626 0.0151 0.1644 0.1655
0.385 0.0702 0.0169 0.1788 0.1801
0.42 0.0858 0.0206 0.1876 0.1901
0.455 0.1188 0.0285 0.1989 0.1989
0.49 0.1476 0.0354 0.1989 0.1989
TABLE 4: SHARING OF ACTIVE POWER GENERATION TO CATER LOAD OF 172 WITH STATCOM AT BUS-172
Active Load bus-172
Gen-1 Gen-5 Gen-13 Gen-20
0.175 0.0277 0.0067 0.0682 0.0891
0.21 0.034 0.0083 0.0824 0.1053
0.245 0.0406 0.0098 0.0968 0.1209
0.28 0.0474 0.0115 0.1113 0.1361
0.315 0.0544 0.0132 0.126 0.1509
0.35 0.0617 0.0149 0.1407 0.1652
0.385 0.0692 0.0167 0.1556 0.1793
0.42 0.0878 0.0211 0.1659 0.1878
0.455 0.1203 0.0289 0.1786 0.1989
0.49 0.1477 0.0355 0.1816 0.1989
0.525 0.1752 0.042 0.1844 0.1989
0.56 0.2029 0.0486 0.1872 0.1989
0.595 0.2307 0.0551 0.1898 0.1989
0.63 0.259 0.0618 0.1922 0.1989
Table 5-8 show the loss allocated to different system generators to cater the load-172. It has been observed that inclusion of FACTS controllers reduces the active loss sharing of every generator. STATCOM has been found to be most effective to minimize the line loss contribution of generators.
TABLE 5: ACTIVE LOSS ALLOCATION TO CATER LOAD OF BUS-172 WITHOUT FACTS CONTROLLERS
Active Load at bus-172
Gen-1 Gen-5 Gen-13 Gen-20
0.175 0.0031 0.0007 0.0067 0.0071
0.21 0.0038 0.0009 0.0082 0.0084
0.245 0.0046 0.0011 0.0096 0.0097
0.28 0.0053 0.0013 0.0111 0.0109
0.315 0.0061 0.0015 0.0126 0.0122
0.35 0.007 0.0017 0.0142 0.0135
0.385 0.0079 0.0019 0.0159 0.0147
0.42 0.015 0.0036 0.0245 0.0243
0.455 0.0196 0.0047 0.0252 0.0246
0.49 0.0232 0.0056 0.0244 0.0235
TABLE 6: ACTIVE LOSS ALLOCATION TO CATER LOAD OF BUS-172 WITH TCSC IN LINE 12
Active Load
at bus-172 Gen-1 Gen-5 Gen-13 Gen-20 0.175 0.0031 0.00069 0.0066 0.0066
0.21 0.0037 0.0009 0.0079 0.0078
0.245 0.0045 0.0011 0.0093 0.0090
0.28 0.0052 0.0012 0.0108 0.0102
0.315 0.006 0.0014 0.0122 0.0114
0.35 0.0069 0.0017 0.0138 0.0126
0.385 0.0078 0.0019 0.0153 0.0139
0.42 0.0106 0.0026 0.0181 0.0165
0.455 0.0183 0.0044 0.025 0.0239
[image:8.612.45.581.163.732.2]International Journal of Emerging Technology and Advanced Engineering
Website: www.ijetae.com (ISSN 2250-2459, Volume 2, Issue 6, June 2012) [image:9.612.41.313.150.368.2]44
TABLE 7: ACTIVE LOSS ALLOCATION TO CATER LOAD OF BUS-172 WITH TCSC IN LINE 13
Active Load at bus-172
Gen-1 Gen-5 Gen-13 Gen-20
0.175 0.0031 0.00079 0.00659 0.00659
0.21 0.0038 0.0009 0.0081 0.0078
0.245 0.0045 0.0011 0.00949 0.0090
0.28 0.0053 0.0013 0.0109 0.0102
0.315 0.0061 0.0015 0.0124 0.0114
0.35 0.0069 0.0017 0.0139 0.0126
0.385 0.0079 0.0019 0.0155 0.0139
0.42 0.0095 0.0023 0.0164 0.0144
0.455 0.0184 0.0044 0.0256 0.0242
0.49 0.022 0.0053 0.0249 0.0231
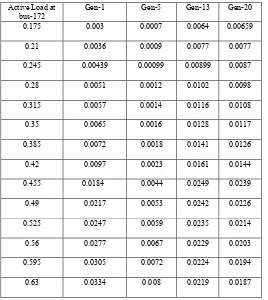
TABLE 8: ACTIVE LOSS ALLOCATION TO CATER LOAD OF BUS-172 WITH STATCOM AT BUS-172
Active Load at bus-172
Gen-1 Gen-5 Gen-13 Gen-20
0.175 0.003 0.0007 0.0064 0.00659
0.21 0.0036 0.0009 0.0077 0.0077
0.245 0.00439 0.00099 0.00899 0.0087
0.28 0.0051 0.0012 0.0102 0.0098
0.315 0.0057 0.0014 0.0116 0.0108
0.35 0.0065 0.0016 0.0128 0.0117
0.385 0.0072 0.0018 0.0141 0.0126
0.42 0.0097 0.0023 0.0161 0.0144
0.455 0.0184 0.0044 0.0249 0.0239
0.49 0.0217 0.0053 0.0242 0.0226
0.525 0.0247 0.0059 0.0235 0.0214
0.56 0.0277 0.0067 0.0229 0.0203
0.595 0.0305 0.0072 0.0224 0.0194
0.63 0.0334 0.008 0.0219 0.0187
VIII.
C
ONCLUSIONThis paper deals with the load and loss allocation problem of any interconnected power system. In this paper, an attempt has been made to minimize the transmission line loss using FACTS controllers. Two most commonly used FACTS controllers; TCSC and STATCOM are employed here to observe the effect of FACTS device in reducing the loss of the lines and to relieve the reactive burden in the generators. The contribution of system generators at a particular operating load has been calculated using power tracing algorithm and STATCOM is found to be most effective in order to reduce system generation as well as line loss. The analysis has been presented here using a robust practical 203-bus (Indian Eastern Grid) system.
REFERENCES
[1].J. Bailek, „Tracing the flow of electricity‟, IEE Proceeding Generation, Transmission and Distribution. Vol. 143, pp. 313-320, July-1996.
[2].D. Krischen. R. Allan, G. Stabac, „Contribution of individual generators to loads and flows‟, IEEE transaction on power system‟, Vol. 11, pp.52-60, February‟1997.
[3].J. Bailek, „Topological generation and load distribution factor for supplementary charge allocation in transmission open assess‟, IEEE Transaction on PWRS. Vol. 12, No. 13, August‟1997.
[4].C. R. Fuerte-Esquivel, E. Acha, and H. Ambriz-PBrez, „A Thyristor Controlled Series Compensator Model for the Power Flow Solution of Practical Power Networks‟, IEEE transactions on power systems. Vol. 15, No. 1, pp.58-64, February‟ 2000. [5].F. F. Wu, Y. Ni and P. Wei, „Power Transfer allocation for open
access using graph theory fundamental and applications in system without loop flow‟, IEEE transmission on power system. Vol. 15, No.3, pp.923-929, 2000.
[image:9.612.42.310.414.714.2]International Journal of Emerging Technology and Advanced Engineering
Website: www.ijetae.com (ISSN 2250-2459, Volume 2, Issue 6, June 2012)45
[7].L. Valerie, K. S. Tapan and T. Downs, „Preliminary findings on usages allocation and loss allocation of electricity deregulated market‟, Proc. AUPEC 2003 Australian University Power Engineering conf., Sep 2003
[8]. M.W. Mustafa and H. Shareef, „A comparison of electric power tracing method used in deregulated power systems”. IEEE transaction in power and Engineering conference, pp.156-160, 2006. .
[9].Zhang Y, Zhang Y, Wu B, Zhou J. Power Injection Model of Statcom With Control and Operating Limit for Power Flow and Voltage Stability Analysis, Electric Power Systems Research.
2006; 76: 1003–1010.
[10]. -Jun Cai and I. Erlich, „Power system static voltage stability analysis considering all active and reactive power controls-singular value approach‟, power Tech., 2007 IEEE Lausanne, pp.367-373, Publication Date: 1-5, July 2007. 1
[11]. Ansyari, C. S. Ozvern and D. King, „Allocation of transmission losses using three different proportional sharing method‟, IEEE Transaction on Universities Power Engg. Conference, pp.1234-1238, 2007.
Nallagownden, R. N.Mukerjee and S. Masri, „Power tracing and prediction of losses for deregulated transmission system‟, International journal of Electrical and computer science, IJECS-IJENS, Vol.10, no. 01, pp. 97-103.
[12]. C. K. Chanda, S. Dey, Dr. A. Chakrabarti and Dr. A. K. Mukhopadhyay, „Determination Of Bus Security Governed By Sensitivity Indicator In A Reactive Power Constraint Longitudinal Power Supply (LPS) System‟, Indian Journal of Engineering and Material Sciences, vol.9, pp 260-264, August‟2002. (ISSN 0971-4588).