International Journal of Emerging Technology and Advanced Engineering
Website: www.ijetae.com (ISSN 2250-2459, Volume 2, Issue 7, July 2012)105
ANALYSIS
OF POWER FACTOR BILLING METHODS FOR
LARGE POWER CONSUMERS: CASE STUDY OF POWER
UTILITY IN KENYA
C.Ndungu
1, J. Nderu
21,2
Electronic and Electronic Engineering, Jomo Kenyatta University of Agriculture and Technology, 62000, Nairobi, 00200, Kenya.
Abstract—The objective of this study is to analyse the most appropriate power factor billing methods for large power consumers. It compares average power factor (AVPF) viz- á – viz coincidental power factor (CPF), which is currently being used for billing large power consumers. The study involved downloading data from large power energy meters for both energy and demand registers recorded for the past sixteen months for the purpose of calculating average and coincidental power factors respectively. The data was analyzed by determining average power factor for the last sixteen months and standard deviation for each categories of power factor (coincidental, peak –to- peak and average power factor). From the analysis, it is observed that most of directly connected, and some of CT metered power users, are operating below 90% efficiency. The analysis concludes that it is preferable to adopt average power factor in metering. By so doing, the power utility will reduce technical losses, improve the stability of the power system and increase revenue as the system will be optimally utilized to distribute active power more efficiently.
This will be achieved by the end users through constant monitoring of power factor, hence ensuring that the VAR compensators are operating effectively on all loads. Otherwise the users could operate optimally on temporal basis, while most of the time they don’t meet the set requirement.
Keywords— Average power factor, CPF, Energy meter, Power factor, VAr compensator
I. INTRODUCTION
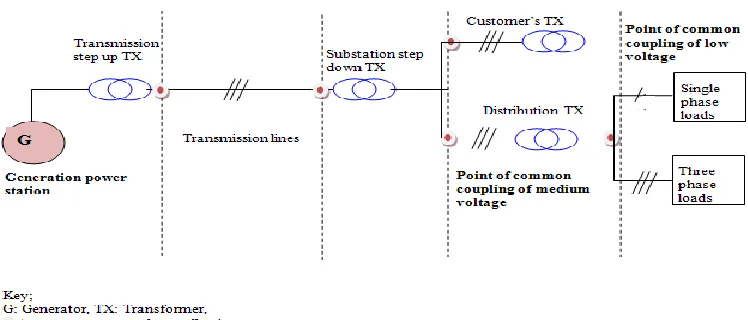
[image:1.612.126.500.470.630.2]An energy meter is a device or instrument used to measure electrical ac power consumed by power users for a given period of time (commonly one month). It is usually a power utility cash register as units and demand recorded by the energy meters are used for billing the consumers. Energy meters are installed at various points of the power system as shown in figure 1.
Figure 1. Illustration of metering points
Different categories of energy meters are installed at various metering points. These include single phase for metering single phase circuits and three phase for metering three phase circuits.
International Journal of Emerging Technology and Advanced Engineering
Website: www.ijetae.com (ISSN 2250-2459, Volume 2, Issue 7, July 2012)106 In recent times, the power utility has installed automatic meter reading (AMR) for the purpose of reducing the cost of reading the large power meters and for on-line monitoring of energy meter among other reasons.
A. Chronology of Power Factor Measurement.
Before introduction of electronic energy meters for the purpose of measuring energy and demand, the power utility measured the power factor using power factor meters, which were used to measure the customer‘s instantaneous power factor. This method was inherently associated with numerous challenges such as error in power factor measurement, high cost, fraud and time consumption. After the year 2000, the power utility adopted peak to peak demand power for calculating the power factor. This involved calculating power factor based on maximum active power and maximum apparent power. Due to different type of energy meters (with different code nomenclatures) there were numerous human errors during meter reading and consequently the power utility introduced the coincidental power factor (CPF), as the method of calculating the statutory power factor. This means that in CPF, the active power recorded by the meter during the maximum system constrain (apparent power) is used for calculating the power factor.
A. Power Factor Definition and Calculation of Associated Power.
1) Power factor definition: Power factor is the ratio of active power (kW) and apparent power (kVA). It is commonly referred to as cos Φ as it is same as cosine of the displacement angle between the voltage and current. Power factor provides an indication of how efficiently the power user is utilizing the ac system. Low power factor implies low efficiency (the system carries more reactive current, which is not used for real work) on active power transmission, poor voltage regulation, and poor system stability [1]. In this regard, the large power users are compelled to install VAR compensators at the vicinity of reactive power demand to ease the power system from carrying the reactive current. A penalty (power factor surcharge (PFS)) is usually imposed on those large power consumers with coincidental power factor below the statutory level of 0.9, which is calculated as in equation 1 [2].
PFS=( ) ( ) ( ) (1)
2) Apparent power calculation: A three phase apparent power (S) can be calculated either arithmetically or geometrically.
Arithmetically it constitutes addition of each individual phase apparent power as per equation 2.
S =V1rmsI1rms+V2rmsI2rms+V3rmsI3rms (2)
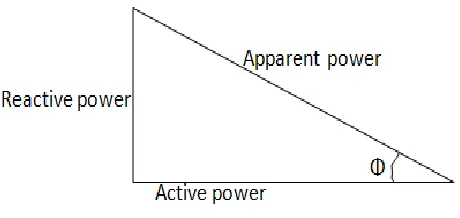
The correct measurement of the apparent power is bound by the accuracy of rms measurement of both voltage and current. On the other hand, the geometrical method of calculation of the apparent power is as shown by equation 3 which is derived from figure 2.
S =
√
(3) [image:2.612.333.563.296.405.2]
Where P is active power and Q is reactive power.
Figure 2: Power triangle
The two formulas give same results when the current and voltage waveforms are purely sinusoidal. However, when the waveforms are distorted because of harmonic distortions, noticeable errors appear due to presence of harmonic distortions which are caused by non–linear industrial loads such as saturable devices and rectifiers [1].
The energy meter records apparent power in a block. The large power meters of power utility are configured to record apparent power after a period of 20 minutes. This implies that each day, there are seventy two (72) blocks that translate to two thousand one hundred and sixty (2,160) blocks per month. The highest recorded apparent power value is stored with its time stamp in energy meter memory for billing and discards the other values.
3) Active power calculation: The average active power is defined as:
Active power (P) =
∑
(4) where Vn and In are, respectively, voltage and current
rms values of the nth harmonics of the line frequency, and φn is the phase difference between the voltage and the
International Journal of Emerging Technology and Advanced Engineering
Website: www.ijetae.com (ISSN 2250-2459, Volume 2, Issue 7, July 2012)107
4) Measurement of reactive power: There are mainly two methods for calculating the reactive power; time delay and low pass filter methods.
A time delay is introduced to shift one of the waveforms by 90° at the fundamental frequency and then multiply two waveforms. In an electronic digital signal process (DSP) system, this method can be implemented by delaying the samples of one input by the number of samples representing a quarter-cycle of the fundamental frequency. This method is negatively affected by the change of line frequency as the number of samples no longer represents a quarter-cycle of the fundamental frequency. Significant errors are then introduced to the results.
For the case of low-pass filter, a constant 90° phase shift over frequency with an attenuation of 20 dB/decade is introduced. If the cut-off frequency of the low-pass filter is much lower than the fundamental frequency, this solution provides a 90° phase shift at any frequency higher than the fundamental frequency. It also attenuates these frequencies by 20 dB/decade. This method is susceptible to variations of the line frequency. However, a dynamic compensation of the gain attenuation with the line frequency can be achieved by evaluating the line period of the signal [3].
II. RESULTS AND DISCUSSION
A.Data Collection.
Data was collected from three main types of large power energy meters; whole current direct connected (15No), low voltage current transformer (13No) and high voltage current transformer energy meters(10No). The power users were sampled according to their history of CPF recorded for the past one year, that is, good power factor or intermittent poor power factor. The data is displayed in graphical form. The meters were sampled in three regions; coast, Nairobi and Central Rift. For the purpose of analyzing the data, it was important to aggregate each power factor from the data recorded by the energy meters for the past sixteen months for each category of the energy meters and standard deviation to show the data dispersion. The aggregation was done as follows; the calculated monthly power factor are summed up and divided by the total number of the months. This was to provide true picture of the weakness/strength of CPF and average power factor method of measurement and billing. The results of the data downloaded are shown in the graphs below.
1) Whole current energy meters: The results of the data download on direct connected large power consumers are as shown in graph 1-a.
Graph 1-a. Whole current aggregated power factor
From line graph, it is seen that only one energy meter (5) the AVPF is above the CPF. Therefore, the AVPF is generally lower than CPF for direct connected power users. Moreover, it is observed that most of direct connected large power consumers are operating below the set power factor requirement of above 0.9 in most of their operations. Hence this shows that direct connected users are seldom correcting effectively the reactive power.
Bar graph 1-b shows the standard deviation for each power consumer evaluated for sixteen months.
Graph 1-b. Standard deviation for the whole current end users
From the graph it is observed that, the standard deviations for PPF and CPF are comparable and in most cases are above the AVPF. This shows poor maintenance of VAr compensator for direct connected power consumers.
2) Low voltage current transformer meters: The results of the data download from LVCT large power consumers are shown in graph 2-a.
International Journal of Emerging Technology and Advanced Engineering
Website: www.ijetae.com (ISSN 2250-2459, Volume 2, Issue 7, July 2012)108 From the graph it is observed that, AVPF is below the CPF and PPF in most of LVCT users. This shows that the power utilization is poor for most of the LVCT power consumers hence, there is need to improve on the reactive power compensation at the point of common coupling (PPC).
Graph 2-b shows the standard deviation for each power consumer evaluated for sixteen months.
Graph 2-b. Standard deviation for the LVCT end users
From the graph, standard deviation for AVPF is in most cases above the PPF and CPF. This shows poor compensation of reactive power and is likely that compensation is done mostly when there is high load. 3) High voltage current transformer meters: The results
of the data download on HT large power consumers are as shown in graph 2-a.
Graph 3-a. HT aggregated power factor
From the graph, it is observed that HT power users are compensating their reactive power effectively at almost on all loads. This is because the AVPF is well above 0.9. Hence they are utilizing the power system more efficiently, as compared with other large power users.
Graph 3-b shows the standard deviation for the HT power users.
Graph 3-b. Standard deviation for the HT end users
From the graph it is observed that standard deviation for CPF is in most cases above the PPF and CPF. This shows that the HT consumers are putting a lot of effort to sustain the power factor above the statutory limit to avoid heavy penalty imposed on low power factor has it has been observed the CPF is in most cases above the statutory level.
B. Data Analysis.
From the data, it is noted that CPF is mostly higher than average power factor for direct and LVCT power users, compared to HT large power users (as observed in graphs 1-a and 2-a). This, therefore, means that HT power users utilize the power system more efficiently. This may suggest that their VAR compensators are well maintained. On the other hand, standard deviation for HT meters is high compared to other large power users, which implies that the monthly power factor varies significantly from month to month, (as shown in graph 3-b), despite being above the statutory level.
It is worth noting that, there are cases where the CPF values are above the statutory level, but the average power factor is below 0.9. This shows that it is likely the power user compensates the reactive power during the peak demand (as seen in graph 4).
Graph 4: Case of good CPF but poor average power factor
0 0.2 0.4 0.6
1 3 5 7 9 11 13
P
F Va
lu
es
Total number of meters downloaded
CPF
PPF
AVPF
0 0.05 0.1
1 2 3 4 5 6 7 8 9 10
PF
val
u
e
s
Meters number
CPF
PPF
International Journal of Emerging Technology and Advanced Engineering
Website: www.ijetae.com (ISSN 2250-2459, Volume 2, Issue 7, July 2012)109 Another interesting case is where the customer maintains a good average power factor, but has low CPF. Ironically, the customer is surcharged but the truth is that the power consumer is utilizing the system more efficiently, contrary to the ‗information‘ perceived from CPF billing. This is unfavorable to the power user because the duration for poor utilization of the power system is less compared to the time average power factor is good as shown in graph 5.
Graph 5: Case of average power factor being better than CPF
From the above analysis it is clearly evident that the CPF method is inherently associated with myriad of the disadvantages such as the possibility of easily manipulated and only considering a small block of time (20 minutes). The advantages of the average power factor therefore cannot be overemphasized. Peak to peak power factor was observed to have high standard deviation values and in some cases the power factor calculated was above unity which should not be the case. Such results portray weak method of calculating the power factor for commercial use.
C. Discussion.
From the data collected and analyzed on the three methods for calculating the power factor, the following are noted.
1) Coincidental power factor (CPF): The CPF is calculated by considering the maximum recorded apparent power and the active power recorded over a period of one block. The energy meter only considers one block of 20 minutes, which is equivalent to 0.046% for the entire billing period (one month). The advantages of this method are; ability to calculate the PF during the time the power user is constraining the ac system to the maximum and minimizes human error as both demand time stamps are same.
The disadvantage is that it only considers power factor for only 20 minutes (0.046% for entire period) and ignores the rest of the month. Moreover, the user can opt to compensate the reactive power only during the peak operation as observed in some of the downloads.
2) Peak to peak power factor (PPF): The PPF is the ratio of maximum active power recorded to maximum apparent power that occurred during the month. The PPF gives an indication whether the power user is utilizing the ac system efficiently at the time of maximum active demand. As aforementioned, it is inherently associated with human error and in some cases gives a power factor that is more than unity. It is, currently, rarely used for billing the large power consumers by Power utility.
3) Average power factor (AVPF): The average power factor is the ratio of active energy consumed (kWh) and apparent energy (kVAh). It gives an indication of how the power user is utilizing the power system over the entire period of energy consumption. Average power factor has been widely adopted globally as the static energy meter can display these two registers on liquid crystal display (LCD). This method ensures that power user sustains a good power factor at all loads; low and high operation. This implies efficient utilization of the power system particularly direct and LVCT large power users, and consequently increases of revenue as customers who do not compensate for the reactive power effectively are surcharged more than the current mode–CPF. If this is done, the ac voltage profile will be improved and the numerous blackouts will be reduced.
III. CONCLUSIONS
The following can be concluded from this study;
a) There is need to review the current method for calculating the power factor since the surcharge formula presumes that the power factor is for the entire measurement period which is not normally the case. b) The CPF and PPF methods have numerous drawbacks
such as manipulation, being unfair to consumers with good average PF but poor CPF and sometimes giving more than unity power factor.
c) Direct connected and LVCT consumers operates on low AVPF as compared with HT consumers, which who were found to be operating at high AVPF, hence high power utilization efficiency.
d) Both the power utility and large power users are expected to gain positively by adopting this method of AVPF. The Power utility is expected to gain financially from power factor surcharge or from technical losses reduction. On the other hand, large power users are expected to experience improved voltage profile and reduced low tariffs cost.
0.75 0.80 0.85 0.90 0.95
1 3 5 7 9 11 13 15
PF
val
u
e
s
Months
CPF
MPF
International Journal of Emerging Technology and Advanced Engineering
Website: www.ijetae.com (ISSN 2250-2459, Volume 2, Issue 7, July 2012)110 IV. RECOMMENDATIONS
The following are the recommendations from this study. a) It is recommended that average power factor be
adopted in billing large power consumers due to its numerous advantages such as fairness to both parties, (power utility and large power consumers) and improvement of power usage efficiency on all loads. b) However, to achieve the above stated advantages, it is
recommended that large power users be inducted on the new method and their role in ensuring that they always operate above the statutory level of 0.9 on all the loads.
REFERENCES
[1 ] Etienne M. (2002). ―Measurement Reactive Power in Energy Meters‖, Issue 1 pp. 22.
[2 ] Juan D. et al. (2000). ―Reactive power compensation Technologies state of the art review‖, pp. 3.