Method of Pushunder Analysis (PUA) for Approximate
Seismic Analysis of Structures Using Various Patterns of
Stepwise Increasing Base Acceleration and Its
Comparison with Pushover Analysis (POA)
Hamidreza Baghaei1,*, Reza Razani2
1Faculty of Civil Engineering, Islamic Azad University of Tehran, South Branch, Tehran, Iran 2Faculty of Civil Engineering, Shiraz University, Shiraz, Iran
Copyright©2019 by authors, all rights reserved. Authors agree that this article remains permanently open access under the terms of the Creative Commons Attribution License 4.0 International License
Abstract
In this paper, a new simple semi-dynamic method is introduced for the approximate evaluation of the seismic behavior of steel structures which is called Pushunder Analysis (PUA). In this method incrementally increasing horizontal unidirectional and reciprocal base acceleration in saw-tooth patterns, which increases from zero to a specified maximum value is applied to the base of a model structure for analysis of its response using the method of Time History Analysis (THA). This method is compared with conventional Pushover Analysis (POA), where incrementally increasing code specified lateral load patterns are applied to the floors of a model structure. The main objective of this paper is to obtain which one of these two methods (POA and PUA) can better represent the seismic behavior of the structure more accurately. For this purpose, the results of the semi-dynamical PUA of a ten story steel structure model are obtained using various patterns of base acceleration. These results are: total displacement, relative drifts, shear story in linear range and P-Δ type curves in nonlinear range for each selected baseacceleration patterns which are shown and compared with POA results. To verify the degree of the accuracy and the peculiarities of this method, the linear and nonlinear responses of the model structure under: static UBC-97 standard seismic loading, dynamic El Centro 1979 acceleration records and FEMA-461 cyclic displacement (which was converted to analogous base accelerogram) are compared with the similar responses obtained by the POA and PUA methods. In general, the proposed PUA method needs further evaluation and case studies to ascertain its merits; however, it shows considerable potential and advantages due to its consideration of dynamical and torsional effects and hysteresis properties of structures. The sensitivities of this method to the length of dynamic time steps of calculation and the forms and durations of the
saw-tooth oscillations are discussed and it is found that by the proper choice of these parameters, better results can be obtained.
Keywords
Pushover Analysis, Pushunder Analysis, Nonlinear Dynamic Analysis, Earthquake Engineering1. Introduction
locations of the structure in nonlinear range. In these cases, the use of nonlinear dynamic analysis is recommended to rationally specify and distribute the seismic design forces within the structures [1-3].
A linear dynamic analysis can take a number of forms; however, it should account for the irregularities of the structure by modelling its “dynamic characteristic” including natural frequencies, mode shapes and damping in both directions. Nonlinear statical and dynamical analyses are commonly used in the seismic analysis of structures. Various methods of conventional statically nonlinear analysis (Pushover (POA)) are being used in the Performance Based Design (PBD) of structures and in obtaining: structural ductility and seismic load reduction coefficient (R). Nonlinear dynamic seismic analysis was developed by using methods such as Time History Analysis (THA) and Incremental Dynamic Analysis (IDA). These methods have found wide applications in dynamic analysis due to the recent increase in speed and storage capacity of computers. During recent years the method of IDA, which employs gradually increasing acceleration amplitude in sequential THA is being used in seismic analysis of important structures. It uses a large number of different time history accelerations (in some cases about 40 accelerograms) to obtain more reliable structural responses due to the increasing levels of severity of earthquakes [2-5].
Between the two methods of nonlinear statical analysis (POA) and dynamical analysis (THA or IDA) a wide difference exists, therefore, the development of a semi-dynamic analysis which has the simplicity and advantage of the nonlinear statical Pushover (POA) method and accuracy and reliability of dynamical methods seems to be necessary. This is important because most regular, even important, structures having a height less than 50 meters and the number of stories less than 15 are at present designed by using an equivalent statical method [4-6].
2. Review of Present Analysis Methods
2.1. Shortcomings of Nonlinear Pushover (POA) Methods
The traditional POA method has many shortcomings that have been discussed by various investigators and have led to the development of modified pushover methods. The earliest developments generally have used load patterns in the pushover analysis such as: uniform, various triangular loading patterns and modal shapes. In some cases, where they dealt with tall building having numerous long period modes, they had used a combination of modal shapes for applied loading with an amplitude proportional to the mass participation of the modes [1, 5]. A few of these developments were discussed by Krawinkler [7]. He
studied thoroughly the advantages and drawbacks and the application limits of the pushover methods. Yang and Wang [8] have studied the merits of various pushover methods, which have found wide popularity for assessment of the seismic performance of structures; however, due to the influence of higher modes, these methods under-estimate the maximum responses of the structures compared to dynamic methods and may lead to substantial errors especially in the seismic analysis of long period structures or when a local mechanism such as soft-story may form during earthquakes [8]. Antoniou and Pinho [9] and Pinho et al. [10] have compared the adaptive and non-adaptive POA methods and have concluded that the adaptive method has some advantages over non-adaptive; however, both methods, predict poorly the story displacements as compared to the dynamic THA method. In the adaptive method, the softening of structures under increasing loads, are taken into account. Shafei and Zareian [11] have developed a method to convert the time history records of acceleration to analogous records of oscillating displacement as stated in FEMA-461 and also organized and ranked the acceleration records on the bases of increasing amplitude which they called Rain-flow fashion. Nicknam et al. [12] have compared the traditional POA method with the IDA method and have concluded that the loading form is a function of a height-to-width ratio of the buildings, and the difference between the two methods for responses of the upper floors are significant. Causevic and Mitrovic [13] have also studied and compared those seismic procedures that have been implemented into the latest European and US codes which are: non-linear dynamic time-history analysis; non-linear static methods of Euro code 8 and FEMA 356 and 440. These presented methods differ with respect of accuracy, simplicity, transparency and clarity of theoretical background [13].
2.2. Comparison of Nonlinear Statical Analysis (POA) and Dynamical Analyses (THA, IDA)
Shahi et al. [16] have studied the shortcomings of the IDA method and concluded that changes in earthquake: frequency content, magnitude, and distant from its epicentre can affect the procedure of the IDA method, therefore, the responses of the structural systems with their fundamental period of less than 0.4 seconds are mostly controlled by the peak ground acceleration and are not sensitive to different acceleration maps in the IDA curves; however, in structural systems with a longer natural period, other parameters of the ground motion should be considered.
2.3. Pushunder Analysis (PUA) Method
In this paper a new approximate method for nonlinear dynamic analysis with incrementally increasing unidirectional and reciprocal base acceleration is proposed which is called Pushunder Analysis (PUA). This name is chosen because it is similar to the pushing or pulling of the ground from under the structure with increasing acceleration. The acceleration is applied to the base or foundation of the structures in two different forms: 1- saw-tooth patterns with reciprocal increasing amplitude of oscillation teeth (PUA-S-R) and 2- saw-tooth pattern with unidirectional increasing amplitude of oscillation teeth (PUA-S-U) as shown in section (4). The duration of application of saw-tooth accelerations is taken equal to 8 seconds, which is approximately the length of the duration of high intensity ground acceleration of many earthquake records used for engineering research. Incremental steps of 0.02 seconds are also used for dynamic response analysis of all accelerograms. The proposed method in this paper is to examine various forms of base acceleration that can replace the non-linear static analysis. By considering the above viewpoints, it was decided to use increasing base acceleration in the form of saw-toothed and FEMA-461 within the FEMA acceptable scaled range for each structure, hoping that the results will be of the similar or higher level of approximation for accuracy and precision in particular as compared with standard POA methods which are fulfilled. The acceptable scaled ranges of accelerograms for obtaining the response spectrum of structures are described in the recommendation 4-6-3-2-1 of UBC-97 which is used in this paper [17].
In the POA method the fictitious horizontal patterns of statical loading is used and assumed to act on various floors of the structure such as uniform, triangular and modal patterns etc... The magnitudes of these loads are incrementally increasing both in the linear and nonlinear regions. The results are shown as P-Δ curves. In contrast, in
the PUA method, fictitious simple incrementally increasing base acceleration patterns are applied to the base of the structure which induces dynamical vibration in that structure and produces loading and displacement in various floors which the maximum value of them also can be shown by P-Δ curves. Thus, both these methods are
approximate; one uses fictitious statical loading and the
other uses fictitious dynamical base acceleration. The main objective of this paper is to find which one of these two methods can more closely represent the real dynamic behaviour of the model structure as obtained by THA or IDA methods.
2.3.1. Justifications for Using the Proposed PUA Method The Pushunder method has the following advantages: 1. It uses dynamical analysis which is more similar to
earthquake effects and can directly model the dynamic behaviour of the building especially its: hysteresis, damping, stiffness and strengthen degradation and torsional behaviour better than conventional statical loads applications POA. Therefore, this method can be used for any structural system which has different hysteresis loop properties. 2. It is more similar to the action of the actual earthquake
effect on the structure because contrary to the Pushover method which uses an imaginary code-specified forces acting at various floors of the structure, here the acceleration is applied to the base of structure, which is similar to the actual earthquake effect that acts on the foundation of the buildings. 3. The response of the structure is obtained by similar
computational methods and allowable software used in the THA of structures.
The main disadvantage of this new method is that computationally it is more time consuming than the POA method because it uses incremental dynamic calculations similar to THA. There are some important reasons to justify using the PUA method as follows:
1. Investigations carried out using the IDA procedure has shown that there are significant differences in the structural response to various earthquakes using THA even for those earthquake time histories that have been chosen as reference earthquakes. The accelerograms from various earthquakes which have been used for dynamic analysis of structures also produces significant statistical variances with each other and with the median response obtained by IDA. Therefore, it can be concluded that the THA method gives good results for the particular earthquake accelerogram used, and using actual median or artificial earthquake accelerograms, which are proposed by IDA and its median accelerogram will not be suitable to represent every earthquake in all parts of the world or for comparative research studies for obtaining accurate and uniform structural response.
[21]. Thus, it seems not to be improper to use a similar method for the evaluation of the response of the entire structure in linear and nonlinear ranges. In addition, as in the case of vibration of the SDOF systems, this reciprocal displacement can be approximately replaced by an analogous shape reciprocal base acceleration with increasing amplitude acting on the foundation of the buildings. In this paper this concept is used and interesting results are obtained.
3. It is well-known that at the Nonlinear Statical Analysis using standard POA method. Many researchers and some codes have indicated that in modal POA, forces obtained from the first mode (or the combinationally scaled important modes) which are obtained from linear dynamic analysis of the structure are used as the approximate replacement for the code prescribed loading pattern such as UBC-97 seismic loading. Many investigators have found that the results of Modal Pushover Analysis in many cases are more accurate than using the code-specified arbitrary fictitious seismic forces applied to structural floors as in UBC-97. This shows that standard POA method needs improvement which the PUA is devised to fulfil this objective.
2.4. Contents of the Paper
In this paper, in Section (3), the structural and dynamic properties of a ten story steel structure model, which is
used in this study is shown. In section (4), the applied loading on the structure, various types of saw tooth accelerations, FEMA-461 analogous accelerogram and the El Centro 1979 (E-W) record have been introduced. In Section (5), the effects of the applied loads and various base accelerations on the model structure are investigated and the responses of the model in the linear and nonlinear ranges for different accelerations and loading levels are presented and compared by means of proper diagrams.
The effects of different parameters representing the shape of various base accelerations on the responses of the model structure are also investigated. In Section (6), the conclusion and recommendations are presented.
3. Introduction of a Two-Dimensional
Model Frame
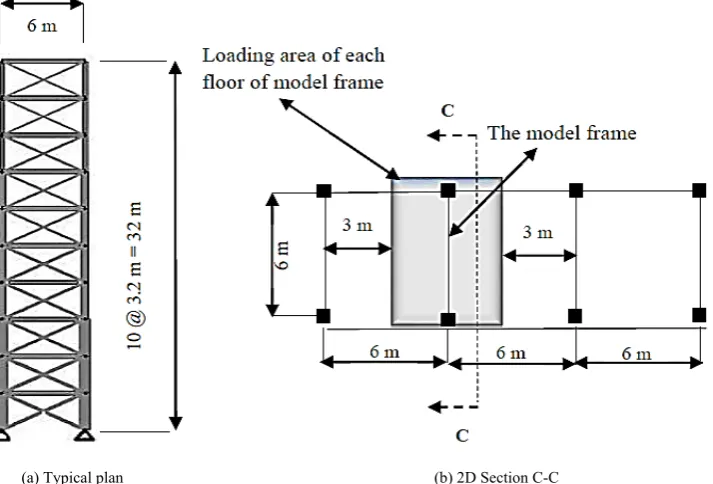
A ten story single bay two-dimensional braced frame, with fixed bases on the ground is used as the model for the comparative investigations. This frame is cut out from the middle of a sample building which is shown in Figure 1. The spacing between this frame from adjacent frames is 6 meters on each side. Therefore, it is assumed that the loading area of this frame in each story is 6 square meters for each one meter on beams of the frame. The seismic behaviours of this model structure are: the total and relative drift of each story and shear load on each story which are shown in the appropriate diagrams.
(a) Typical plan (b) 2D Section C-C
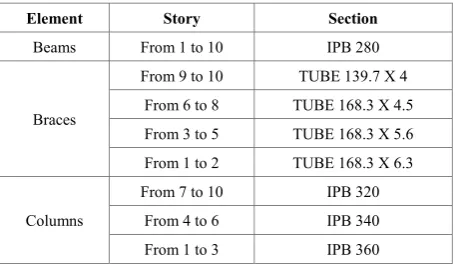
[image:4.595.122.479.443.685.2]In order to consider the effect of various vibration modes of the model structure in this analysis, the section properties of the structural members of the frame such as columns, beams and bracings for each floors are shown in Table 1, which has been obtained by the analysis of the model structure using SAP-2000 software [22], its auto select option and the design of members of the structure of this frame was obtained by designing this structure as a fixed base frame under UBC-97 loading for Allowable Strength Design (ASD). Also the linear dynamic modal analysis is used to obtain various modal periods, and their corresponding percentage of mass participation. These values are shown in Table 2. Detail of these analyses is given by Baghaei [23]. The type of steel is assumed to be ST-37 with yield value of 235359.6 KN/m2 and the nonlinear dynamic behaviour of steel members under reciprocating loads are based on the elastoplastic pattern of the simple two-line behaviour (kinematic) hysteresis loop shown in UBC-97-ASD [17].
Table 1. Steel profile used in construction of this frame
Element Story Section
Beams From 1 to 10 IPB 280
Braces
From 9 to 10 TUBE 139.7 X 4
From 6 to 8 TUBE 168.3 X 4.5
From 3 to 5 TUBE 168.3 X 5.6
From 1 to 2 TUBE 168.3 X 6.3
Columns
From 7 to 10 IPB 320
From 4 to 6 IPB 340
From 1 to 3 IPB 360
Table 2. Frequencies and their corresponding percentage of mass participation for the first five modes of vibration of the ten story model frame
Modes 1 2 3 4 5
Period T in
seconds 0.857 0.261 0.146 0.132 0.113
Percent mass
participation 80.4 % 12.1 % 3.5% 2.3 % 1.1 %
4. Applied Loadings and Accelerations
The following Static loading and dynamic base accelerations are applied to the model frame.
4.1. Gravity Loads
The Dead Load per meter on the beams of each story and roof of the frame are: 35.31 KN/m and 38.24 KN/m, respectively. Live load on the beams of each story and roof are: 11.76 KN/m and 8.82 KN/m, respectively. In the
calculation of seismic load, only 25% of floor live load is considered.
4.2. Applied Equivalent Static Loading Based in UBC-97
In this study the equivalent linear static loads UBC-97 code loading are given and used for estimating base shear and story shear loads.
The displacement of the model was checked according to code limitations. In this study, the equivalent linear static lateral loads, as represented by UBC-97 code loading [17] are used for estimating base shear, story shear loads and drifts and also for the determination of the distribution of lateral forces at the height of the frames. The total and relative drift of the model frame was checked against the code limitations. Distribution of the lateral force at the height of the structure is assumed to be triangular.
The total design base shear (V) in a given direction is determined from UBC-97 code loading by Equation (1) as follows:
V =Cv I
RTW =
0.3×1
5.6×0.64× 2499.02 = 209.17 KN (1)
Where Cv = 0.3 is the velocity seismic coefficient, Ca = 0.3 is the acceleration seismic coefficient related to S = SB. SB is the coefficient relating to the type of the soil profile, Z=0.3 is the seismic zone factor, I=1 is the building importance factor, R=5.6 is the code specified reduction factor, W=2499.02 KN is the total dead load plus 25% live load obtained using values given section (4).
The Fundamental period of the model frame building (T) is determined by using empirical formulas given by Equation (2) (UBC-97) which can be used for structural steel framing systems [17]:
T = Ct(hn)3�4= 0.048 × (3.2 × 10)3�4= 0.64 s (2)
Where Ct=0.048 for Steel Braced Frame and hn=32 meters is the total height of the structure.
4.3. Lateral Load and Base Acceleration
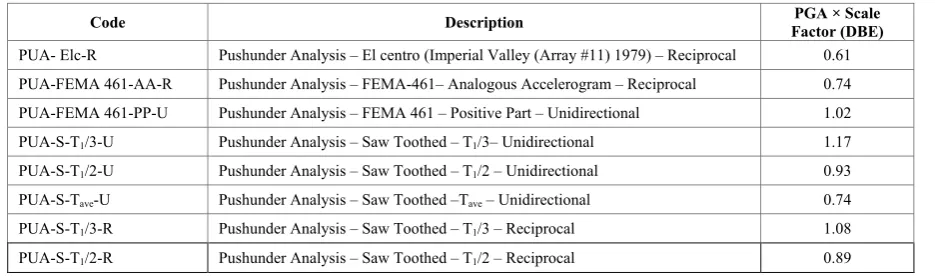
The applied base accelerations in the form of unidirectional and reciprocal saw-tooth, FEMA-461 and the El centro earthquake are presented below. The scale factors which are shown in Table 3 are obtained using the methodology described in section 1631.6 of UBC-97 code loading [17].
Table 3. Description and coding of various saw-tooth, El centro and FEMA 461analogous base acceleration used proper DBE scale
Code Description Factor (DBE) PGA × Scale
PUA- Elc-R Pushunder Analysis – El centro (Imperial Valley (Array #11) 1979) – Reciprocal 0.61
PUA-FEMA 461-AA-R Pushunder Analysis – FEMA-461– Analogous Accelerogram – Reciprocal 0.74
PUA-FEMA 461-PP-U Pushunder Analysis – FEMA 461 – Positive Part – Unidirectional 1.02
PUA-S-T1/3-U Pushunder Analysis – Saw Toothed – T1/3– Unidirectional 1.17
PUA-S-T1/2-U Pushunder Analysis – Saw Toothed – T1/2 – Unidirectional 0.93
PUA-S-Tave-U Pushunder Analysis – Saw Toothed –Tave – Unidirectional 0.74
PUA-S-T1/3-R Pushunder Analysis – Saw Toothed – T1/3 – Reciprocal 1.08
PUA-S-T1/2-R Pushunder Analysis – Saw Toothed – T1/2 – Reciprocal 0.89
* PUA is Pushunder Analysis, Elc is El Centro, U is Unidirectional, R is Reciprocal, PP is Positive Part and T1/2 and 3 is the fundamental period mode 1 by 2 and 3 and their detailed descriptions are given in section (4.3.1)
(a) Response spectra of UBC-97 and PUA-Elc- R
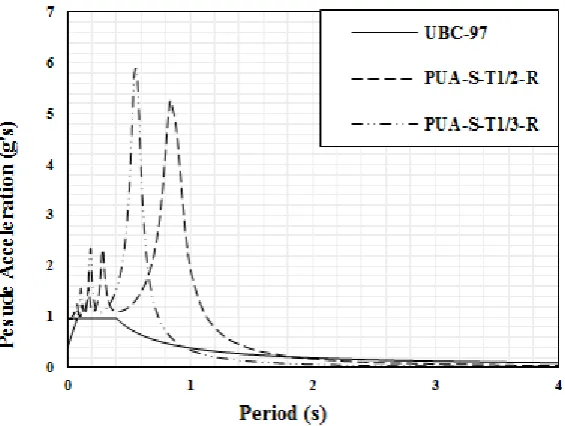
(c) Response spectra of UBC-97 and PUA-S-T1/ (2 and 3)-R
(d) Response spectra of UBC-97 and PUA-FEMA 461- (AA-R and PP-U)
Figure 2. Design response spectra comparison
4.3.1. Unidirectional and Reciprocal Increasing Acceleration Applied to the Base of a Model Structure
In this part of the paper various methods of increasing unidirectional and reciprocal base acceleration having saw-tooth forms are applied to the base of the model structure. The method of analysis is similar to Time History Analysis (THA), and eight patterns of base accelerations are investigated in this paper.
4.3.1.1. Increasing Base Acceleration with Saw-tooth Patterns
Five patterns of saw-tooth unidirectional Figure (3 (a) and (b)) and reciprocal Figure (4) base acceleration are
used as follows:
1- (PUA-S-Tave-U) saw-tooth acceleration is shown in Figure 3(a), Here the stepwise oscillation between two adjacent maximums or minimums of teeth is equivalent to the weighted average of the dominant modes of the structure (Tave) as in Equation (3).
The number of modes that is considered in this equation is such that the sum of the percentage of mass participation exceeds 90% of the total mass of the structure (MT) as
shown by Equation (4) [24]. Tave=∑ Ti Mi
n i=1 ∑ni=1Mi =
[image:7.595.159.442.79.292.2]∑ni=1Mi≥0.9 MT (4)
Where, in the above equation, Ti and Mi are the modal
period and the mass participation of the i-th mode, respectively, and MT is the total mass of the structure. In
each tooth, acceleration raises to the pick of that tooth in 0.9Tave and reduces to zero in 0.1Tave as shown in Figure 3(b) [24]. For the model structures described in Table 2 of Section (3), Tave is found to be 0.755 sec. Thus number of teeth (n) is: n =12 within 8 second.
2 and 3- (PUA-S-T1/2-U) and (PUA-S-T1/3-U)
saw-tooth accelerations are similar to Figure 3(a) with the difference that stepwise oscillation between two adjacent maximum or minimum teeth are equal to half and one-third of the duration of the fundamental period T1 =0.86, and are 0.43 sec and 0.28 sec, respectively and the number of teeth (n) are: 19 and 29 respectively.
4 and 5- (PUA-S-T1/2-R) and (PUA-S-T1/3-R) saw-tooth reciprocal accelerations are similar to pattern 2 and 3 in the stepwise oscillation between two adjacent maximum or minimum teeth as shown in Figure 4.
(a) Saw-tooth base acceleration (PUA-S-Tave-U)
(b) Detail A
Figure 3. (PUA-S-Tave-U) Increasing pattern of saw-tooth base acceleration with 12 equal oscillation steps of Tave
Figure 4. (PUA-S-T1/ (2 and 3)-R) Increasing pattern of cyclically saw-tooth base acceleration
[image:8.595.72.518.199.648.2] [image:8.595.93.507.523.675.2]4.3.1.2. Newly Proposed FEMA-461 Analogous Base Acceleration
One of the semi-dynamic nonlinear tools which is used for testing structural members under reciprocal loading is proposed by FEMA 461. It uses incrementally increasing cyclic displacement, as shown in Figure 5 [24]. This displacement control loading is often used for experimental verification of reciprocal strength and stress analysis of structural elements [24]. A similar experimental diagram for displacement control for a structural member was proposed by Razani [25] in the past which uses increasing multiples of yielding displacement in Fibonacci steps and reciprocal patterns for testing reinforced concrete members and for presentation of test results. In the FEMA 461 diagram the ordinate shows the ratio of di to Δm where di is the i-th amplitude of the displacement cycles and Δm is the maximum amplitude of the assumed objective displacement. The horizontal axis shows the number of cycles of various amplitudes. The number of steps N, (a
value of N ≥ 10 is recommended) shows the number of
reciprocal cycles. Two sequential cycles are executed having the same amplitude [21].
In this paper an innovative fictitious base acceleration pattern similar to the FEMA 461 displacement cyclic pattern shown in Figure 6 is presented which instead of applying cyclic displacement to the element being tested; it applies an analogous, similar shape cyclic acceleration with specific amplitude to the base of the frame [24]. The reason for choosing this pattern of base acceleration is the similarity of the oscillation amplitude of displacement of
Single Degree Freedom (SDF) mass-spring systems with acceleration of those systems during sinusoidal cyclic vibration. In this proposed method the amount of acceleration which is applied to the base of the structure is increasing from zero to a maximum amount specified for the Design Base Earthquake such as DBE or MCE levels [24].
This new acceleration pattern having many facets of dynamical loading such as hysteretic damping produced during reciprocal dynamic displacement makes possible the use of an analogous acceleration similar to accepted displacement pattern used by FEMA 461 for reciprocal testing of structural elements for the entire structure. Therefore, the existing software for THA can be used for nonlinear analysis of the entire structure using the proposed base acceleration patterns [24]. The comparative usefulness of this proposed simple pattern which shall be called FEMA 461-AA (Analogous Accelerogram) is evaluated in this paper.
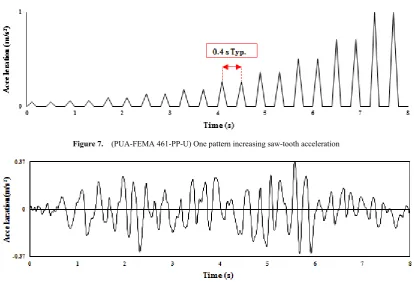
[image:9.595.90.505.451.736.2]For dynamic analysis of the model frames, the duration of testing is assumed 8 seconds which is the duration of 20 cycles of oscillation of the structure by the pattern shown in Figure 6. The maximum number of oscillation N is assumed 20. The comparative usefulness of this proposed pattern which shall be called FEMA-461Analogus Accelerogram (FEMA 461-AA) is evaluated in this paper where FEMA 461-AA is used in two following different patterns: (PUA-FEMA 461-AA-R) and (PUA-FEMA 461-PP-U), shown in Figures 7 and 8 where the time distance between two adjacent maximums or minimums of the saw-toothed acceleration is equal to 0.4 sec.
[image:9.595.92.505.460.593.2]Figure 5. Recommended step-wise increasing displacement cycles for testing structural elements by FEMA 461 [21]
Figure 7. (PUA-FEMA 461-PP-U) One pattern increasing saw-tooth acceleration
Figure 8. (PUA-Elc-R) Scaled record of El Centro 1979 (E-W) from Peer (2010) [26]
4.3.1.3. Time History Analysis (THA) and Incrementally Dynamic Analysis (IDA)
[image:10.595.95.506.96.227.2]Time history analysis (THA) is an important technique for dynamic structural seismic analysis in linear and nonlinear ranges and for verification of the degree of accuracy of other approximate methods such as PUA. THA is a step-by-step analysis of the dynamic response of a structure to a specified accelerogram and is used to determine the seismic response of a structure under dynamic loading of representative earthquakes. To perform such an analysis in this paper, a representative El Centro earthquake (THA-Elc). (PUA-Elc-R), El centro ground motion pattern with reciprocating oscillation in shown in Figure 8.
5. Analysis, Discussions and
Comparisons of Results
5.1. In Linear Range
In this section: maximum roof and floor displacements, relative story drift and story and base shears of the building model are obtained in the linear elastic range under
specified loading UBC-97 code loading and various unidirectional.
These results are reciprocal base acceleration described in Section (4) and compared with each other as shown below.
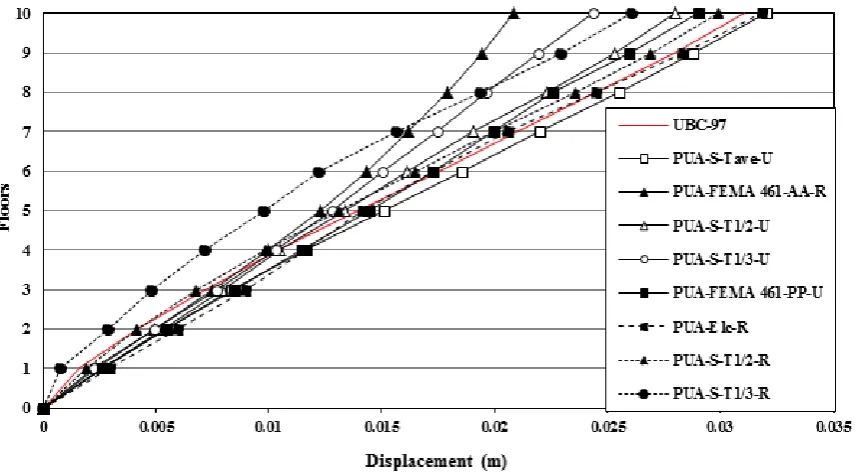
[image:10.595.92.504.251.372.2]5.1.1. Comparison of Maximum Displacement of Floors Figure 9 shows the maximum displacement responses of various floors of the model frame due to indicated base accelerations and UBC-97 code loading.
1. The response under UBC loading is lower than PUA-Elc-R.
2. The response under PUA-S-Tave-U and PUA-S-T1/2-R follow very close that under UBC 97 loading from third to tenth floor.
3. The response under PUA-S-T1/2-R, PUA-FEMA461-PP-U,PUA-S-T1/2-U,
PUA-S-T1/3-R, PUA-S-T1/3-U and PUA-FEMA 461-AA-R are close to UBC 97 code loading and PUA-Elc-R for under floors but up to third floor, they become respectively smaller than UBC 97 code loading and PUA-Elc-R.
Figure 9. Displacement of various floors of the model frame under specific base accelerations and UBC-97 code lateral loading
5.1.2. Comparison of Maximum Relative Drift of Floors
Figure 10 shows the relative drift responses of various floors of the model frame due to indicated base accelerations and UBC-97 code loading.
1. The responses under UBC-97 code loading and PUA-Elc-R are very close together in all floors. 2. The response under PUA-S-Tave-U is also very close to PUA-Elc-R and UBC-97 code loading.
3. The responses under PUA-FEMA 461-PP-U, PUA-S-T1/2-U, PUA-S-T1/2-R, PUA-S-T1/3-R, PUA-S-T1/3-U and PUA-FEMA 461-AA-R are respectively less than PUA-Elc-R and UBC 97 code loading.
[image:11.595.71.516.454.683.2]4. The response under PUA-S-T1/3-R is significantly less than the other responses which may be due to higher the number of cycling.
Figure 11. Max floor shears of various floors of model frame under specific base accelerations and UBC-97 code lateral loading
5.1.3. Comparison of Story Shear and Maximum Base Shears
Figure 11 shows the maximum shear responses of various floors of the model frame due to indicated base accelerations and UBC-97 code loading.
1. The responses under UBC-97 code loading and PUA-Elc-R are very close together from fifth to sixth floor but in other floors, they are distant.
2. The responses under PUA-S-Tave-U and PUA-FEMA 461-PP-U are also very close to UBC-97 code loading up to fourth floors. Also they very close to PUA-Elc-R from fifth to sixth floors.
3. The responses under PUA-S-T1/ (2 and 3)-U are less than UBC-97 code loading up to second floor and PUA-Elc-R in all floors.
4. The responses under PUA-FEMA 461-AA-R and PUA-S-T1/ (2 and 3)-R are respectively less than PUA-Elc-R and UBC-97 code loading.
5. The response under PUA-S-T1/3-R is significantly less than the other responses.
5.2. In Non-linear Range
For nonlinear analysis of the model frame, the conventional statical code POA method by using the stepwise increasing lateral load given by the UBC-97 code and Dynamical PUA method by using Nonlinear Time History Analysis (NTHA) with the stepwise increasing amplitude to the various base acceleration were used. The conventional P-Δ curves were obtained and transformed to
Sa vs. Sd. In these curves, Sa is obtained by dividing base shear by total mass of the frame and Sd is the roof displacement.
5.2.1. Responses under Unidirectional Base Acceleration In Figure (12), the nonlinear responses of the model structure in the form of saw-tooth are shown for three unidirectional base accelerations namely: PUA-S-T1/ (2 and 3)-U and PUA-FEMA 461-PP-U. These responses are compared with POA standard and PUA-Elc-R. It is shown that:
1. The P-Δ curves for PUA-FEMA461-PP-U shows a larger displacement to reach the collapse condition than that of PUA-Elc-R.
2. The P-Δ curves for PUA-Elc-R has larger displacement than that of POA, however the maximum nonlinear resistance under both loadings are very close together.
3. Also, these diagrams show that the PUA-S- T1/ (2 and 3)-U and PUA-FEMA 461-PP-U produce higher Sa response in the model frame which shows 5% ,7% and 12 % more than the POA, respectively.
4. PUA-FEMA 461-PP-U and PUA-S-T1/3-U follow a similar pattern to reach maximum Sa. PUA-FEMA 461-PP-U and PUA-S- T1/ (2 and 3)-U show slightly higher resistant in nonlinear range than POA and PUA-Elc-R.
Figure 12. Comparison of P-Δ (Sa vs Sd) unidirectional nonlinear curves of the model frame to various specific increasing amplitude base accelerations and POA curve
5.2.2. Responses under Reciprocal Base Acceleration
In Figure 13, the nonlinear responses of the model structure are shown for three reciprocal base accelerations namely: PUA-S-T1/ 2 and 3-R and PUA-FEMA 461-AA-R. These responses are compared with responses due to POA standard and PUA-Elc-R. It is shown that:
1. PUA-FEMA 461-AA-R are generally close to PUA-Elc-R and POA, it shows that its collapse displacement and maximum strengths curve between POA and PUA-Elc-R.
2. It should be emphasized that PUA-S-T1/2 and 3-R are slightly less than POA and PUA-Elc-R, respectively. Nevertheless, PUA-S-T1/ (3 and 2)-R sooner reach collapse.
3. The P-Δ curves obtained due to PUA-S-T1/2 and 3-R are produced lower collapse points and maximum strengths than the standard POA and PUA-Elc-R.
It can be concluded that unidirectional saw-tooth responses including PUA-S-T1/ (2 and 3)-U and PUA-FEMA 461-PP-U are overestimated both the standard POA and PUA-Elc-R respectively. However, these reciprocal saw-tooth responses underestimate the POA and PUA-Elc-R except for PUA-FEMA 461-AA-R which as stated above is very close to both the standard POA and PUA-Elc-R.
[image:13.595.115.479.498.709.2]6. Conclusions
From the above studies, it is concluded:
1. POA is a very simple method because it does not consider the softening of the structure, changes in frequencies during in nonlinear behaviour and the effect of various modes of vibration and their changes in the nonlinear range. Also the pattern of the applied code specified loads acting on the structural floors are empirically fictitious and derived based on the simplified assumption such as the (SDOF) behaviour; therefore, it may have a significant difference with the changing real dynamic forces acting on the structure during the earthquake, especially in the nonlinear range.
2. As far as the degree of approximation between POA and PUA, it is concluded that the loading patterns used in POA is fictitious and differs from the real loads as described above and also different patterns of loading such as triangular, uniform, and first mode have been used by various seismic codes all over the world, which results in significant differences on apparent structural responses obtained. In contrast using the PUA method similarly uses fictitious unidirectional and reciprocal base accelerations acting on the foundation of the structures; however, PUA also considers the hysteric behaviour of the structures, their damping and dynamic behaviour; therefore, it represents the earthquake effects on structures more realistically.
3. The base acceleration which causes inertial forces in various floors does not exclusively depend on the form and amount of base acceleration and mostly depends upon the pattern of formation of plastic hinges and the location and order of the soft region in the various points of the structure, and thus, it can be concluded that using artificial base acceleration dynamic analysis in linear and nonlinear zones in lieu of fictitious loading in POA leads to more accurate results.
4. It is concluded that PUA diagrams can better than POA diagrams represent the nonlinear behaviour of the model structure, especially when suitable fictitious base accelerograms are used in the analysis. Furthermore, this leads to less computational difficulty than for numerous earthquake accelerograms using actual THA and more uniformly in comparing results.
5. In the proposed PUA method, dynamic analysis and base acceleration analogous to the method of THA are used. Therefore, there is no need to consider a different fictitious pattern of loading for each of the floors of the structure. The dynamic method of analysis by itself finds inertial forces generated in each story both in linear and nonlinear analysis. In the FEMA 461 method, the reciprocal displacement
pattern is used in testing the structural element in lieu of reciprocal seismic forces acting on those elements. Similarly, in the PUA method, analogous base acceleration similar to FEMA 461 displacements are substituted as a suitable pattern for seismic analysis of the entire structure. The obtained results both in linear and nonlinear ranges show that the responses obtained by the PUA reciprocal method PUA-FEMA 461-AA-R are closer to THA of El Centro than POA results and the PUA unidirectional method.
6. In the linear range, the strength of unidirectional saw-tooth base acceleration is higher than the pushover and El-Centro responses. The strength of the reciprocal saw-tooth acceleration is less than the POA and El-Centro responses. Also, the apparent stiffness of the unidirectional and reciprocal saw-tooth acceleration is less than the POA and El-Centro responses. In the nonlinear range, only FEMA 461 reciprocal responses follow a similar shape to that of POA and is close to the responses due to the El-Centro base acceleration.
7. The final conclusion is that using PUA-FEMA 461-AA-R gives better resulted than POA for the model frame and can be replaced the POA method, however, this conclusion is only applicable to the model frame used and for different types of frame and having differ configuration and height further studies must be carried out to validity the concept.
REFERENCES
[1] ATC. Guidelines for the Seismic Rehabilitation of Buildings, prepared by the Applied Technology Council for the Building Seismic Safety Council, Published by the Federal Emergency Management Agency (Report Nos. FEMA 273 & 274), Washington, D.C., Vol.1 and 2, 1997.
[2] M.A. Khorami, M.S. Khorami, H. Motahar, M.F. Alvansazyazdi, M. Shariati, A. Jalali and M.M. Tahir. Evaluation of the Seismic Performance of Special Moment Frames Using Incremental Nonlinear Dynamic Analysis, Structural Engineering and Mechanics, Vol.63, No.2, 259-268, 2017.
[3] F. M. Nazri, C. K. Yerna, M. M. Kassema, E. N. Farsangib. Assessment of Structure-Specific Fragility Curves for Soft Storey Buildings Implementing IDA and SPO Approaches, International Journal of Engineering, Vol.31, No.12, 2016-2021, 2018.
[4] H. Kayhani, A. Golara and R. A. Jazany. Comparison of Modal Pushover Analysis and Nonlinear Time History Analysis Using Precedence List Record Selection Method, Proceedings of the First Makassar International Conference on Civil Engineering, 2010.
[6] A. S. Elnashai. Advanced Inelastic Static (Pushover) Analysis for Earthquake Applications, Structural Engineering and Mechanics, Vol.12, No.1, 51-69, 2001. [7] H. Krawinkler. Pushover Analysis: Why, How, When, and
When not to Use it, The 65th International Conference of
Structural Engineers Association of California Convention, Maui, Hawaii, 17-36, 1996.
[8] P. Yang, A. Wang. Study on Improvement of Pushover Analysis, The 12th International Conference on Earthquake
Engineering, New Zealand, Auckland, 2000.
[9] S. Antoniou, R. Pinho. Advantages and Limitation of Adaptive and Non-Adaptive Force-Based Pushover Procedures, Journal of Earthquake Engineering, Vol.8, No.4, 497-522, 2004.
[10]R. Pinho, C. Casarotti, S. Antoniou. A Comparison of Single-Run Pushover Analysis Techniques for Seismic Assessment of Bridges, Earthquake Engineering and Structural Dynamics, Vol.36, No.10, 1347-1362, 2007. [11]B. Shafei, F. Zareian. Development of a Quasi-Static
Loading Protocol for Displacement-Sensitive Non-Structural Building Components, The 14th International
Conference on Earthquake Engineering, Beijing, China, 2008.
[12]A. Nicknam, H. R. Ahmadi, N. Mahdavi. A Comparative Study of the Traditional Performance and the Incremental Dynamic Analysis Approaches (IDA), The 14th
International Conference on Earthquake Engineering, China, Beijing, 2008.
[13]M. Causevic, S. Mitrovic. Comparison Between Non-Linear Dynamic and Static Seismic Analysis Of Structures According to European and US Provisions, Bulletin of Earthquake Engineering, Vol.9, No. 2, 467-489, 2010. [14]M. Fragiadakis, D. Vamvatsikos. Static Versus Dynamic
Methods of Analysis for Estimating Seismic Performance, Protection of Built Environment Against Earthquakes, Vol. 6, No.1, 99-133, 2011.
[15]J. Marasingha, K. K. Wijesundara, U. I. Dissanayake. Comparison of Incremental Dynamic Analysis Curve with Pushover Curve, SAITM Research Symposium on Engineering Advancements, Malabe, Sri Lanka, 155-158. 2013.
[16]R, Shahi, N. T. Lam, F. E. Gad, I. Saifullah, J. L. Wilson, K. Watson. Choice of Intensity Measure in Incremental Dynamic Analysis, The 6th International Conference
Australian Earthquake Engineering Society, Lorne, Victoria, Australia, 31-53, 2014.
[17]UBC. International Conference of Building Officials, Whittier, California, 1997.
[18]FEMA-273. NEHRP Guidelines for the Seismic
Rehabilitation of Buildings, Building Seismic Safety Council, Washington, D.C., 1997.
[19]FEMA-356. Pre-standard and Commentary for the Seismic Rehabilitation of Buildings, Federal Emergency Management Agency, Washington, D.C., 2000.
[20]FEMA-440. Improvement of Nonlinear Static Seismic Analysis Procedures, Federal Emergency Management
Agency, Washington, D.C., 2005.
[21]FEMA-461. Interim Protocols for Determining Seismic Performance Characteristics of Structural and Non-structural Components Through Laboratory Testing, Federal Emergency Management Agency, Washington, D.C., 2007.
[22]CSI. SAP2000 Integrated Software for Structural Analysis and Design, Computers and Structures Inc., Berkeley, California, 2000.
[23]H. Baghaei. Investigation of Seismic Behavior of Top Floor (Floors) Isolation of Structures to be Used as Tuned Mass Damper (TMD) and Comparison of Their Merits, M.S Thesis, Islamic Azad University of Tehran- South Branch, Tehran, Iran, 2015.
[24]H. Baghaei, R. Razani. Comparative Study of Linear and Nonlinear Seismic Behavior of Non-Isolated, Base-Isolated and Top Floor (TMD-Type) Isolated Structural Frames, Civil Engineering and Architecture, Vol.7, No.1, 5-16, 2019.
[25]R. Razani. Proposed Standard Method for Dynamic Testing of Reinforced Concert Members and for a Presentation of Test Result, The 6th International Conference on Frontiers of Earthquake Engineering, India, New Delhi, 2919-2921, 1977.