Munich Personal RePEc Archive
Implementation of NREGA in
Maharashtra: Experiences, Challenges
and Ways Forward
Deepak, Shah
Gokhale Institute of Politics and Economics
5 June 2012
Implementation of NREGA in Maharashtra: Experiences, Challenges
and Ways Forward
Deepak Shah
*Introduction
One of the major planks of rapid poverty reduction in the Eleventh Five Year Plan is the
successful implementation of National Rural Employment Guarantee Act (NREGA) in majority
of the states of India. The Act, passed by the Parliament in August 2005, is a path-breaking
legislation as it guarantees wage employment on public works to any adult who is willing to do
unskilled manual work for 100 days in a year at minimum wages as prescribed in the Minimum
Wages Act, 1948. The NREGA is different from other wage employment guarantee programmes
as it makes employment a right for the people and in the case of failure to provide employment,
the state government is liable to pay an unemployment allowance, equivalent to one third or half
of the minimum wage. Although NREGA is an innovative piece of legislation that has no parallel
anywhere in the world, one of the major concerns relates to whether guaranteering employment is
a way to alleviate poverty. The experience of Employment Guarantee Scheme (EGS) in
Maharashtra, which came into being in 1965 as a pilot project in Tasgaon village in Sangli
district, reveals that though poverty rates may not have fallen, the scheme does provide some
security to poor households. In fact, Maharashtra seems to be the only state that was successful in
preventing an increase in any of the poverty measures during the 1987-88 draught. Further,
studies have shown that while head-count ratio (HCR) of poverty may not have gone down
significantly, there is a considerable effect on the severity of poverty since EGS wages augment
the income of the poor1 (Khera, 2005).
The significance of NREGA lies in the fact that it creates a right based framework for
wage employment programme and makes the government legally bound to extend employment to
those who demand it. While the Act provides a legal framework, the state governments have the
legal liability and the central government provides the fiscal guarantee. The Act ensures that there
is decentralized planning, which means a perspective plan needs to be prepared for whole district
with a list of permissible works.2 In this way the legislation goes beyond providing a social safety
net, and towards guranteering the right to employment. There has been a spate of studies designed
to assess the performance of National Rural Employment Guarantee Scheme (NREGS) ever since
the Act relating to it came into being (Dreze and Khera, 2009, Mehrotra, 2008, Ambastha et al.
2008, Gopal, 2009, Jha et al. 2008, Jha, Bhattacharya, Gaiha, Shankar, 2009, Jha, et al., 2009a,
and Scandizzo et al. 2009). While some studies have drawn attention to huge leakage and fudging
of muster rolls, others are not that critical and have been ecstatic over the number of jobs created,
*
and number of beneficiaries from disadvantaged groups such as the Scheduled Tribes (ST),
Scheduled Castes (SC) and women (Gaiha et.al. 2009). This is symptomatic of the fact that while
some studies have debunked this nation-wide programme, others are seen to endorse it on the
grounds that it will transform the lives of poor and make them aware of their entitlement. In the
light of this backdrop, this study attempts to investigate the implementation of NREGA in the
state of Maharashtra with emphasis on coverage of households, employment guaranteed, works
undertaken, strengths, bottlenecks and strategies for further strengthening the programme.
Potential Benefits of NREGA
Workfare programmes not only typically provide unskilled workers with short-term
employment on public works but also income transfers to poor households during periods when
they suffer on account of absence of opportunities of employment. In areas with high
unemployment rates and under employment, transfer benefits from workfare programmes can
prevent poverty from worsening, especially during lean periods. As requisite infrastructure is
created, the durable assets created by these programmes have the potential to generate
second-round employment benefits. In broader sense, the NREGA will help the government in: (a)
overcoming growing stockpiles of foodgrains, (b) ensuring water security and market
connectivity, (c) preventing rural-urban migration, and (d) development of human capital.
Since the Government of India holds foodgrains far in excess of the quantity required to
achieve food security, the NREGA offers the Government the opportunity to use this excess of
grains to finance labour for the development of rural infrastructure. Utilisation of excess grains to
finance the scheme will serve two purposes: (i) paying a part of the wages in term of grain will
avoid the inflationary tendency in other wage goods that may arise due a sudden transfer of
purchasing power, and (ii) it will reduce the outlay on food subsidy by significantly reducing the
carrying cost of grain. The NREGA will provide the Government with a means to reduce
expenditure on the current account and improve the fiscal health of the Government.
The rural India is facing an increasing problem of water security due to lack of irrigation
infrastructure. Water tables all over the country have been falling due to over-exploitation of
ground water resources. It is believed that the NREGA offers a ‘historic opportunity’ to address
this problem (Shah, 2007). The expenditure on public works under the NREGA can be directed
towards construction of irrigation apparatus, which would alleviate the problem of water security
to some extent. The funds allocated under the NREGA may be used for development of roads
thereby connecting villages to national highways and thus facilitating connectivity with markets.
The NREGA will have significant positive impact on seasonal rural-urban migrations by
providing employment to rural workers during the lean season. This will reduce the problems of
excessive population pressures in Indian cities as surplus rural labour will find employment in
their own districts. The NREGA may also have an impact on permanent migrations trends.
the increased activity in the rural economy due to increased purchasing power will lead to higher
rates of permanent job creation, thereby mitigating the urgency to migrate. Further, the public
works have the potential to develop human capital by promoting skills in rural India. This may be
through ‘learning-by-doing’ kind of processes or through formal training of the workers by
trained personnel. This shall reduce the dependence of the rural population on agriculture by
enabling them to move on to other activities. Thus, NREGA has several potential benefits of
reviving the economy as it is self targeting, self adjusting and self liquidating.
NREGA Implementation in Maharashtra
Government intervention is necessary in the form of public work programmes to mitigate
poverty, unemployment and hunger. Those working under NREGA, spend the additional money
to create demand for other commodities. The extra income so generated creates further demand
and this process is called the multiplier. The value of the multiplier depends on the marginal
propensity to consume (MPC). The higher the MPC, greater is the propensity to consume and
NREGA provides money in the hands of the people who have the highest MPC. NREGA workers
not only stimulate demand, they also produce. They also include many small and marginal
farmers who work under NREGA because the productivity of their own farms is no longer
enough to make ends meet. NREGA will become really powerful when it helps rebuild this
decimated productivity of small farms. Public investment incentivises private investment through
small farmers and gives them a chance to return to farming. Since EGS in Maharashtra was a role
model based on which NREGA came into being, it would be interesting to know how well
NREGA has done in the state from where it has originated.
Though the Act came into force in February 2006 in 200 most backward districts of the
country, it was subsequently extended to cover all the 615 districts of India. In the state of
Maharashtra, various districts came under the purview of NREGA in three different phases,
which were decided after conducting a backwardness index.3 The index took into account low
productivity, low wages and proportion of SC and ST.
Job Card Issued
The job card is free of cost and need to be issued by the Gram Panchayat within 15 days
after receiving an application, and employment is given within 15 days of issuance of job card,
failing which unemployment allowance has to be paid as per the norms prescribed in NREGA.
The job card ensures that labourers are in possession of a written record of the number of days
they have worked, wages paid, unemployment allowances received, etc. Details regarding
percentage of job card issued to total number of persons registered under NREGA in Maharashtra
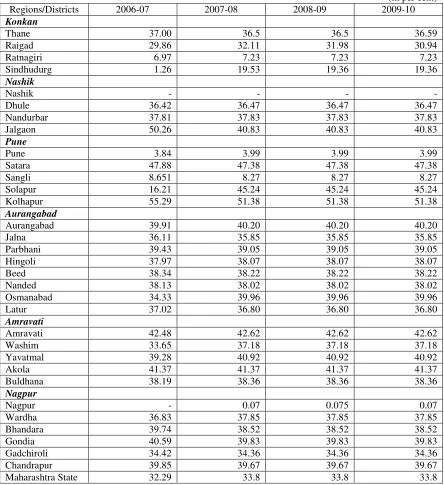
are given in Table 1. The figures provided in Table 1 clearly underscore the fact that there has
been wide variation in the proportion of job cards issued to number of households registered
Table 1: Job Cards Issued to Total Number of Persons Registered Under NREGA in Maharashtra (in per cent) Regions/Districts 2006-07 2007-08 2008-09 2009-10
Konkan
Thane 37.00 36.5 36.5 36.59
Raigad 29.86 32.11 31.98 30.94
Ratnagiri 6.97 7.23 7.23 7.23
Sindhudurg 1.26 19.53 19.36 19.36
Nashik
Nashik - - - -
Dhule 36.42 36.47 36.47 36.47
Nandurbar 37.81 37.83 37.83 37.83 Jalgaon 50.26 40.83 40.83 40.83
Pune
Pune 3.84 3.99 3.99 3.99
Satara 47.88 47.38 47.38 47.38
Sangli 8.651 8.27 8.27 8.27
Solapur 16.21 45.24 45.24 45.24 Kolhapur 55.29 51.38 51.38 51.38
Aurangabad
Aurangabad 39.91 40.20 40.20 40.20
Jalna 36.11 35.85 35.85 35.85
Parbhani 39.43 39.05 39.05 39.05 Hingoli 37.97 38.07 38.07 38.07
Beed 38.34 38.22 38.22 38.22
Nanded 38.13 38.02 38.02 38.02
Osmanabad 34.33 39.96 39.96 39.96
Latur 37.02 36.80 36.80 36.80
Amravati
Amravati 42.48 42.62 42.62 42.62
Washim 33.65 37.18 37.18 37.18
Yavatmal 39.28 40.92 40.92 40.92
Akola 41.37 41.37 41.37 41.37
Buldhana 38.19 38.36 38.36 38.36
Nagpur
Nagpur - 0.07 0.075 0.07
Wardha 36.83 37.85 37.85 37.85
Bhandara 39.74 38.52 38.52 38.52
Gondia 40.59 39.83 39.83 39.83
Gadchiroli 34.42 34.36 34.36 34.36 Chandrapur 39.85 39.67 39.67 39.67 Maharashtra State 32.29 33.8 33.8 33.8
The general scenario shows that only 34 per cent households registered under NREGA
received job cards in Maharashtra, which is quite a low proportion. It was only in the case of
Kolhapur that this proportion was 50-55 per cent during the period between 2006-07 and
2009-10. The proportion of job cards issued to number of households registered under NREGA was
relatively high in districts belonging to Aurangabad, Amravati and Nagpur regions where this
proportion stood at 35-50 per cent. The districts like Ratnagiri, Pune, Sangli and Nagpur showed
very low proportion in this respect. The plausible reasons for the low percentage of issue of job
cards could be: (a) lack of awareness among people about the programme and registration
community, and also proximity to Sarpanch, (d) job cards taken back by the Sarpanch on the
grounds of non-attachment of photograph, (e) lack of maintenance of records of the people who
have migrated to other places, (f) undue charges for the photograph despite free delivery of job
cards, etc. Other problems relate to delay in issue of job cards, improper entries in job cards,
inflation of number of working days, illiteracy of people, etc., which ultimately defeat the
implementation of NREGA in the right perspective.
Distribution of Job Cards to Weaker Sections
Though the programme does not confine to any particular group, it is ensured that the
most of the SC and ST families willing to do unskilled manual work get preference. However,
observations show that only 10-11 percent of households belonging to SC and ST category
received job cards as against 75-78 per cent for other categories (Table 2). It was only in the case
of the district of Hingoli that job cards were evenly distributed among SC, ST and other
categories. The districts like Thane, Nandurbar, and Gadchiroli sowed significantly high
[image:6.612.92.536.354.764.2]proportion of job cards issued to ST category.
Table 2: Share of SC, ST and Other Category in Job Card Issued under NREGA in Maharashtra
2006-07 2009-10
Districts
SC ST Others SC ST Others Thane 2.42 69.95 27.63 2.42 69.95 27.63 Raigad 4.61 16.19 79.2 4.81 16.83 78.36 Ratnagiri 3.86 0.46 95.68 3.76 0.44 95.8 Sindhudurg 13.33 0 86.67 9.56 0.57 89.87 Dhule 2.83 10.3 86.87 2.83 10.29 86.88 Nandurbar 4.35 82.43 13.22 4.42 82.3 13.28 Jalgaon 18.9 19.82 61.28 16.81 19.19 64 Pune 7.63 6.11 86.26 6.55 5.22 88.23 Satara 8.95 1.02 90.03 8.95 1.02 90.03 Sangli 21.25 0.18 78.57 21.25 0.18 78.57 Solapur 14.67 2.42 82.91 12.77 2.39 84.84 Kolhapur 10.64 0.2 89.16 9.76 0.15 90.09 Aurangabad 10.56 0.19 89.25 9.8 0.15 90.05 Jalna 0.05 0.02 99.93 0.05 0.02 99.93 Parbhani 3.2 0.15 96.65 3.2 0.15 96.65 Hingoli 34.49 32.39 33.12 33.86 31.78 34.36 Beed 0.05 0.02 99.93 0.06 0.02 99.92 Nanded 14.26 9.01 76.73 14.21 8.98 76.81 Osmanabad 17.9 0.98 81.12 17.68 0.9 81.42 Latur 31.04 1.89 67.07 30.8 1.88 67.32 Amravati 3.39 1.84 94.77 3.35 1.83 94.82 Washim 17.64 6.54 75.82 17.11 6.36 76.53 Yavatmal 10.59 20.12 69.29 10.54 19.56 69.9 Akola 16.02 4.77 79.21 16.02 4.77 79.21 Buldhana 7.04 0.89 92.07 6.97 0.89 92.14
Nagpur - - - 6.45 2.15 91.4
Most of the districts showing higher percentage of job cards issued to ST are tribal
dominated. Since 54 per cent of ST population of Maharashtra is confined to districts like Thane,
Nashik, Nagpur, Dhule, Nandurbar and Yavatmal, the job cards issued to this category stands
higher in Thane and Nandurbar. On the other hand, Latur has the highest proportion of SC
population in the state, followed by Bhandara. The proportion of SC workers being issued job
cards therefore stands higher than ST in the district of Latur.
Employment Generation
The objective of the NREGA is to enhance the livelihood security of the people in rural
areas by guaranteeing 100 days of wage employment in a financial year to a rural household
whose members volunteer to do unskilled manual work. The Act further aims at creating durable
assets and strengthening the livelihood resource base of the rural poor. The choice of works
suggested in the Act address causes of chronic poverty like drought, deforestation, soil erosion,
etc., so that the process of employment generation is on a sustainable basis. However, despite
making provision of 100 days of employment in a year, it is often seen that there has been wide
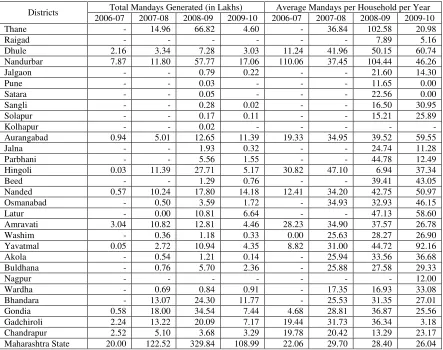
deviation in terms of actual employment generation. For instance, the actual employment
generation is much below than 100 days in a year in almost all the districts of Maharashtra with
[image:7.612.94.537.412.762.2]the exception of districts like Thane and Nandurbar (Table 3).
Table 3: Employment Generation under NREGA in Maharashtra
Total Mandays Generated (in Lakhs) Average Mandays per Household per Year Districts
2006-07 2007-08 2008-09 2009-10 2006-07 2007-08 2008-09 2009-10
Thane - 14.96 66.82 4.60 - 36.84 102.58 20.98
Raigad - - - 7.89 5.16
Dhule 2.16 3.34 7.28 3.03 11.24 41.96 50.15 60.74
Nandurbar 7.87 11.80 57.77 17.06 110.06 37.45 104.44 46.26
Jalgaon - - 0.79 0.22 - - 21.60 14.30
Pune - - 0.03 - - - 11.65 0.00
Satara - - 0.05 - - - 22.56 0.00
Sangli - - 0.28 0.02 - - 16.50 30.95
Solapur - - 0.17 0.11 - - 15.21 25.89
Kolhapur - - 0.02 - - - - -
Aurangabad 0.94 5.01 12.65 11.39 19.33 34.95 39.52 59.55
Jalna - - 1.93 0.32 - - 24.74 11.28
Parbhani - - 5.56 1.55 - - 44.78 12.49
Hingoli 0.03 11.39 27.71 5.17 30.82 47.10 6.94 37.34
Beed - - 1.29 0.76 - - 39.41 43.05
Nanded 0.57 10.24 17.80 14.18 12.41 34.20 42.75 50.97
Osmanabad - 0.50 3.59 1.72 - 34.93 32.93 46.15
Latur - 0.00 10.81 6.64 - - 47.13 58.60
Amravati 3.04 10.82 12.81 4.46 28.23 34.90 37.57 26.78
Washim - 0.36 1.18 0.33 0.00 25.63 28.27 26.90
Yavatmal 0.05 2.72 10.94 4.35 8.82 31.00 44.72 92.16
Akola - 0.54 1.21 0.14 - 25.94 33.56 36.68
Buldhana - 0.76 5.70 2.36 - 25.88 27.58 29.33
Nagpur - - - 12.00
Wardha - 0.69 0.84 0.91 - 17.35 16.93 33.08
Bhandara - 13.07 24.30 11.77 - 25.53 31.35 27.01
Gondia 0.58 18.00 34.54 7.44 4.68 28.81 36.87 25.56
Gadchiroli 2.24 13.22 20.09 7.17 19.44 31.73 36.34 3.18
Chandrapur 2.52 5.10 3.68 3.29 19.78 20.42 13.29 23.17
Among various districts, Nandurbar invariably showed significantly higher mandays
generated under NREGA during the entire period between 2006-07 and 2009-10. Nandurbar is
one of the most backward districts in the state. The average per household employment
generation in Nandurbar district was found to be more than 100 days during 2006-07 and
2008-09. Like Nandurbar, the district of Thane also showed higher employment generation, especially
during 2008-09 when the average employment generation per household stood at more than 100
days. The districts belonging to Nagpur and Nashik regions did not show any employment
generation during 2006-07 as the programme was in its first phase and yet to be implemented in
these districts. The highest employment generation under NREGA was noticed to be during
2008-09 when majority of backward districts showed about 40-50 mandays of employment generation
per household. The impact of NREGA in terms of employment generation was not seen to be
significant in forward districts of Maharashtra like Nashik, Pune, Kolhapur and Nagpur.
However, in Aurangabad district, the average per household employment generation was found to
be as high as 60 days during 2009-10. In general, the state of Maharashtra has shown very poor
performance in terms per household employment generation, which remained well below 30 days
all through the period between 2006-07 and 2009-10. This is an indication of the fact that
employment generation under NREGA in Maharashtra is so far not very successful and it has to
do a lot of catching to make its presence felt in the rural Maharashtra.
Wage Payment under NREGA
Under NREGA, while the central government bears the entire cost of wages of unskilled
manual workers, 75 per cent of the cost of material, wages of skilled and semi skilled workers,
administrative expenses as may be determined by the Central Government, which will include,
inter alia, the salary and the allowances of the Programme Officer and his supporting staff and
work site facilities, and expenses of the National Employment Guarantee Council, the state
Governments have to bear the costs on some other items like 25 per cent of the cost of material,
wages of skilled and semi skilled workers, unemployment allowance payable in case the State
Government cannot provide wage employment on time, and administrative expenses of the State
Employment Guarantee Council. Further, the legal guarantee of the Act mandates that wages due
to workers be paid within 15 days of work completion. This requires that a fair record be
maintained for the work done. In order to ensure that authentic muster rolls are used, numbered
muster rolls are to be issued for each sanctioned work. The wage payment to workers is in
accordance with the provisions made under NREGA. However, the wages offered under the
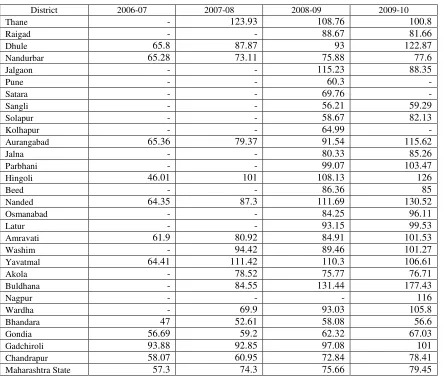
scheme are sometimes below the minimum prescribed norms. In the state of Maharashtra, the
wages offered under NREGA range from as low as Rs. 47 to Rs. 130 across various districts
during the period between 2006-07 and 2009-10 (Table 4). However, the average per day wage
rates are seen to be increasing in the state during this period despite the fact that some of the
Table 4: Average Per Day Wages Offered under NREGA in Maharashtra (in ruppes)
District 2006-07 2007-08 2008-09 2009-10
Thane - 123.93 108.76 100.8
Raigad - - 88.67 81.66
Dhule 65.8 87.87 93 122.87
Nandurbar 65.28 73.11 75.88 77.6
Jalgaon - - 115.23 88.35
Pune - - 60.3 -
Satara - - 69.76 -
Sangli - - 56.21 59.29
Solapur - - 58.67 82.13
Kolhapur - - 64.99 -
Aurangabad 65.36 79.37 91.54 115.62
Jalna - - 80.33 85.26
Parbhani - - 99.07 103.47
Hingoli 46.01 101 108.13 126
Beed - - 86.36 85
Nanded 64.35 87.3 111.69 130.52
Osmanabad - - 84.25 96.11
Latur - - 93.15 99.53
Amravati 61.9 80.92 84.91 101.53
Washim - 94.42 89.46 101.27
Yavatmal 64.41 111.42 110.3 106.61
Akola - 78.52 75.77 76.71
Buldhana - 84.55 131.44 177.43
Nagpur - - - 116
Wardha - 69.9 93.03 105.8
Bhandara 47 52.61 58.08 56.6
Gondia 56.69 59.2 62.32 67.03
Gadchiroli 93.88 92.85 97.08 101
Chandrapur 58.07 60.95 72.84 78.41
Maharashtra State 57.3 74.3 75.66 79.45
Though wages offered under the scheme were higher than existing agricultural wages,
several districts of the state offered wages below par than the prescribed wages under NREGA.
For instance, wages offered in Bhandara were less than Rs.60 per day. Sangli district also showed
lower wages on offer. However, an increasing trend was noticed in terms of wages offered under
NREGA across various district of Maharashtra. There could several reasons for lower wages on
offer. The improper methods of measurement of productivity led to low wages on offer. Lack of
information to the workers about wage rates for different kinds of work in different types of
terrain, lack of bargaining power of workers, fudging of muster rolls leading to low wage
payment, difficulty in understanding the mode of payment-mix of cash and kind as prescribed in
Maharashtra, etc. were some other problems relating to wages offered under NREAGA in the
state of Maharashtra.
Type of Work Undertaken
The works undertaken under NREGA in Maharashtra were mainly relating to rural
bodies. The estimates relating to different works undertaken under NREGA across various
districts of Maharashtra for the year 2008-09 are provided in Table 5. Since during 2006-07 and
2007-08, the NREGA was in implementation phase in several districts of Maharashtra, the
[image:10.612.94.534.164.597.2]estimates relating to works undertaken under the scheme for these years are not shown in Table 5.
Table 5: Works Undertaken under NREGA in Maharashtra: 2008-09 Share (%) Districts Total
Works RI FC WCH DP MI ILD WB LD Others Thane 6723 0.03 - 27.38 0.18 - - 34.06 38.35 - Raigad 1360 11.99 - 59.63 16.84 - 0.07 8.68 2.79 - Ratnagiri 16 12.5 - 87.5 - - - - Sindhudurg 4 100 - - - - Nashik 114 0.88 - 92.98 0.88 - 0.88 - 2.63 1.75 Dhule 1336 18.26 - 58.83 1.88 - - 5.91 - 15.12 Nandurbar 3637 15.23 0.41 15.23 5.95 0.03 - 60.21 - 2.94 Jalgaon 2080 20.19 - 34.23 31.1 - - 14.38 0.1 - Pune 54 7.41 1.85 66.67 - - - - 24.07 - Satara 259 - - 78.76 - - - - 21.24 - Sangli 1092 38.64 - 39.29 8.61 - - 9.98 1.65 1.83 Solapur 1977 19.68 - 67.07 1.01 - 0.05 2.83 4.05 5.31 Kolhapur 190 21.05 - 73.68 - - - 0.53 0.53 4.21 Aurangabad 7338 0.29 0.03 81.08 1.61 0.05 2.32 14.58 0.04 - Jalna 1364 - - 92.74 7.19 - - - - 0.07 Parbhani 1208 0.66 - 99.01 0.33 - - - - - Hingoli 7074 0.03 - 81.69 2.27 - - 12.65 0.01 3.35 Beed 937 1.17 - 97.33 1.39 - 0.11 - - - Nanded 9195 - 0.24 17.14 10.59 0.02 0.16 66.16 5.55 0.14 Osmanabad 3242 1.57 0.03 75.14 22.49 - - 0.77 - - Latur 1516 1.65 6.4 80.21 0.07 - - 5.08 3.03 3.56 Amravati 11032 10.79 0.05 61.87 7.95 2.26 2.42 1.52 0.34 12.8 Washim 1771 3.11 - 36.48 42.18 3.16 1.69 8.92 2.43 2.03 Yavatmal 4456 5.34 0.81 18.38 32.21 0.22 0.02 32.94 0.74 9.34 Akola 2253 0.31 - 18.29 79.81 - 0.04 0.13 0.8 0.62 Buldhana 5238 7.33 - 13.1 76.63 - - 0.02 1.53 1.39 Nagpur 42 - - - 100 - - - - - Wardha 528 - - - 85.23 11.74 0.19 2.84 - - Bhandara 1665 53.27 - 22.22 1.57 2.04 0.12 16.82 1.26 2.7 Gondia 4110 44.31 0.07 25.11 6.59 0.1 0.07 21.75 0.61 1.39 Gadchiroli 3005 22.73 0.07 34.04 10.24 - 11.65 16.87 4.33 0.07 Chandrapur 4389 3.26 0.07 2.57 20.44 0.27 - 71.36 0.23 1.8 Maharashtra 89205 13.17 0.31 48.67 18.01 0.62 0.61 12.78 3.63 2.2 Note: RI = Rural Irrigation; FC = Flood Control; WCH = Water Conservation and Harvesting; DP = Draught Proofing; MI = Micro Irrigation; ILD = Irrigation Facility to Land Development; WB = Water Bodies (renovation of water bodies); LD Land Development
The number of water conservation and harvesting activities accounted for the maximum
share in total works undertaken under NREGA, followed by draught proofing, rural irrigation and
renovation of water bodies. The work relating to WCH was the highest in Aurangabad region and
lowest in Nagpur region. In Konkan region, the works given priority were WCH, rural irrigation,
renovation of water bodies and land development. In Nashik and Pune regions, 50-65 per cent of
the activities were relating to WCH, rural irrigation and renovation of water bodies, whereas
NREGA in Maharashtra were mainly concentrated on irrigation and water conservation related
activities since irrigation is the major problem of the state. The growth in agricultural sector
chiefly depends on irrigation facilities and, therefore, it was given foremost priority under
NREGA in Maharashtra.
Coping Strategies
In order to strengthen the implementation of NREGA, a number of strategies need to be
initiated, which include removal of the ceiling of 100 days of employment, changing employment
provision from household to an individual entitlement, ensuring running of the scheme in federal
manner, undertaking capacity building of locally elected bodies through advocacy efforts,
incorporating skilled activities into NREGA, incorporating project mapping for the entire country
in the next 3-4 years, evolving of a NREGS employment calendar to tap the supply of labourers
during the agricultural slack season, ranking NREGA districts using appropriate performance
evaluation criteria, developing recognition and reward mechanisms for NGOs, social actors,
animators, civil society organizations, etc. (Shah, 2009).
Conclusions
Although there has always been a debate about the effectiveness of NREGA in terms of
coverage of the target group, and also it is criticized on two grounds that it is expensive and
corruption will not allow it to succeed, the experience of Maharashtra shows that it is partly true.
The scheme is successful in terms asset creation, watershed development, prevention of draught,
large scale administration of rural public works and reduction in large scale migration. The
scheme is also successful in terms of coverage of weaker sections of the society. However, the
major problem relates to the employment generation as the mandays generated and the number
households provided 100 days of employment are quite low in almost all the districts of
Maharashtra. With the sole exception of providing employment opportunities to the weaker
sections of the society, the Act has not been able to succeed in any of its other provisions. In
Maharashtra, only 34 per cent households registered under NREGA received job cards, which is
quite a low proportion. The wages offered under NREGA are low in several districts of the state,
which could be due to improper methods of measurement of productivity. The other problems
relating to wages encompass lack of information on the part of workers about wage rates for
different kinds of work in different types of terrain, lack of their bargaining power, fudging of
muster rolls leading to low wage payment, difficulty in understanding the mode of payment-mix
of cash and kind as prescribed in Maharashtra, etc. However, the NREGA is much better scheme
than any other employment related programmes. It has still to do a lot of catching to make its
presence felt in different parts of the country. The linking of employment guarantee schemes with
other schemes of public works will certainly improve skill levels among workers, though this will
End Notes
1. Gujarat experienced a 4 percentage point increase (over the HCR in 1983) in the HCR during the 1987-8 drought, whereas poverty continued to fall in Maharashtra through this crisis. This indicates that though poverty decline in Maharashtra could have been better, the EGS certainly enhances security.
2. A list of permissible works is given in Schedule I of the Act. These are concerned mainly with water conservation, minor irrigation, land development, rural roads, etc. However, the Schedule also allows “any other work which may be notified by the Central Government in consultation with the State Government”.
3. The districts included under NREGA in Maharashtra were: Phase I (2006) –
Ahmednagar, Amravati, Aurangabad, Bhandara, Chandrapur, Dhule, Gadchiroli, Gondia, Hingoli, Nanded, Nandurbar and Yavatmal; Phase II (2007)) – Thane, Wardha, Buldhana, Osmanabad, Akola and Washim; Phase III (2008) – Raigad, Ratnagiri, Sindhudurg, Nashik, Jalgaon, Pune, Satara, Sangli, Solapur, Kolhapur, Jalna, Parbhani, Beed, Latur and Nagpur.
References
Ambasta, P., P.S.V. Shankar and Mihir Shah (2008), ‘Two years of NREGA: The road ahead’,
Economic and Political Weekly, 43(08); 41-50.
Gopal, K. S. (2009), ‘NREGA Social Audit: Myths and Reality’ Economic and Political Weekly,
17th January.
Dreze, J. and Khera, R.eetika (2009), ‘The battle for employment guarantee’, Frontline, 16th January.
Gaiha, R., V.S. Kulkarni, M.K. Pandey and K.S. Imai (2009), ‘National Rural Employment Guarantee Scheme, Poverty and Prices in Rural India, ASARC Working Paper, 2009/03.
Jha, R., Gaiha, R., Shankar, S. (2008), ‘Reviewing the National Rural Employment Guarantee Programme’, Economic and Political Weekly, 43(10), 44–48.
Jha, R., Bhattacharya, S., Gaiha, R., Shankar, S. (2009), ‘Capture” of Anti-Poverty Programs: An Analysis of the National Rural Employment Guarantee Program in India’, Journal of Asian Economics, (forthcoming).
Jha, R., Gaiha, R., Shankar, S. (2009a), ‘National Rural Employment Guarantee Programme in
Andhra Pradesh and Rajasthan: Some recent evidence’, Contemporary South Asia, (forthcoming).
Khera, Reetika (2005), ‘Employment Guarantee in Maharashtra and India’, UNDP Report, Regional Office, Delhi.
Mehrotra, S. (2008), ‘NREG two years on: Where do we go from here?’, Economic and Political
Weekly, 43(31), 27–35.
Shah, Mihir (2007), ‘Multiplier Accelerator Synergy in NREGA’, The Hindu, 4th April.
Shah, Mihir (2007), ‘Employment Guarantee, Civil Society and Indian Democracy, Economic and Political Weekly, 17th November.