ISSN Online: 2169-2645 ISSN Print: 2169-2637
Powering Renewable Programs: The Utility
Perspective
Nicole Griffin
*, Athens Gomes Silaban
UtiliWorks Consulting, Baton Rouge, LA, USA
Abstract
In order to make renewable energy projects successful, there are many factors that utilities need to consider. These include policy drivers, assessing what renewable technologies it will employ, identifying the rates and pricing incentives that could be made available, and how customers can be better engaged. Utilities have created re-newable programs with varying degrees of customer participation: some have taken the initiative to provide customers with 100% renewable generated power, others rely exclusively on customers to participate to meet renewable energy goals and the last alternative is a blend of both in which utilities offer customers the option to purchase renewable power matches or install and generate their own renewable power. Over-all, the economics of solar and wind technologies are trending in the upward direc-tion—the costs of the technologies are decreasing and the yields are getting higher. Better still, predictive modeling, energy storage and the plethora of research in this area will only make the prospects of integrating renewables more viable.
Keywords
Renewable Energy, Electric Utility, Solar, Wind, Energy Storage
1. Introduction
When considering how to build out a renewable energy portfolio, there are a lot of fac-tors and many points of view to consider. For purposes of this narrative, we will take the point of view of the electric utility itself.
The interest in renewable energy is rapidly increasing with many countries proposing ambitious roadmaps of their power sector renewable integration. So how does an elec-tric utility begin building its renewable roadmap? First, the utility needs to identify what types of renewable technologies are suited for its environment. Using the US, for How to cite this paper: Griffin, N. and Si-
laban, A.G. (2016) Powering Renewable Pro- grams: The Utility Perspective. Open Jour-nal of Energy Efficiency, 5, 148-159. http://dx.doi.org/10.4236/ojee.2016.54013
Received: October 22, 2016 Accepted: December 19, 2016 Published: December 22, 2016
Copyright © 2016 by authors and Scientific Research Publishing Inc. This work is licensed under the Creative Commons Attribution International License (CC BY 4.0).
N. Griffin, A. G. Silaban
this example, we of course know that there are some regions that are well suited for hy-dro-electricity, such as the infamous Hoover Dam area. In drier areas of the Midwest where there are not steady tides or waves that can be used to produce electricity, hy-droelectric power is simply not an option. Solar and wind represent a different scena-rio, whereby all areas have varying degrees of either. The questions for solar and wind energy then become:
How much energy can we generate? Is it profitable to utilize these technologies? Is it policy driven?
2. Drivers for Solar and Wind Generation
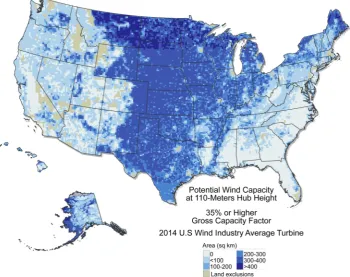
Let’s start on the concept of how much renewable energy we can generate. Firstly, wind power. Of the approximately 48,800 operating utility-scale wind turbines, majority of them correlate to where the capacity is on the map presented in Figure 1 [1]. Tradi-tionally in the US, the Midwest has the largest wind capacity—as farmlands in plains states can produce large amount of winds [2]. In terms of actual production, the state of Texas far surpasses wind generation of any state at 17,711 MW, with Indiana coming in second at 6209 MW and California third at 5662 MW.
[image:2.595.199.550.408.685.2]In the United States alone, the additions of new wind turbines and infrastructure in-creased the power capacity for the year 2015 by 41% and powered 88,000 jobs [3]. The DOE’s “2014 Wind Technologies Market Report” shows that wind turbine prices have
fallen drastically, 20% - 40% lower than their highs in 2008. Larger rotors are advancing in technology with increasing capacity and efficiencies. Concurrently, wind energy is selling at lower and lower prices, hitting 2.5 cents per kWh per the report as compared to the national average 11 cents per kWh [4].
As impressive as the investments in wind energy have been, the global investments in solar have been even greater in recent years (Figure 2).
One of the reasons that solar is gaining so much popularity is due to its versatility. As opposed to wind power, solar can be easily implemented at local business and residen-tial premises. The graphic below shows how along with utility-owned photovoltaics (PV), homes and businesses have a high adoption rate. One of the largest drivers is the continued decrease in costs of solar panels, at about an average of 10% each year since the 1980s [6]. Along with a decrease in costs, the panels are becoming more efficient and more aesthetically pleasing (thinner and blend in better with rooftops). The amount of solar power installed in the US has increased with this trend at more than 23 times from 1.2 GW in 2008 to an estimated 27.4 GW at the end of 2015 [7]. The grow-ing industry also has had an extremely positive effect on the US workforce. The Solar Foundation’s National Solar Jobs Census 2015, revealed “that in 2015 the solar work-force grew at a rate 12 times faster than the overall economy and now boasts 208,859 solar workers [8].”
As presented in Figure 3, the estimated PV installation is estimated to decrease in 2017, while residential and non-residential PV are projected to increase; the utility PV installation is anticipated to experience decrease due to the Solar Investment Tax Credit (ITC) project completion deadline extension [10]. Installations are expected to pick up again in 2019.
[image:3.595.196.552.487.689.2]As valuable as solar and wind power may prove to be, they are naturally unreliable— the wind doesn’t always blow, and the sun doesn’t always shine. The energy that can be captured is intermittent. The conundrum, especially in the instance of residential solar
N. Griffin, A. G. Silaban
Figure 3. Installed photovoltaic & projected photovoltaic installation in the US [9].
power for example is that when power is being produced (mid) is often opposite of when consumers need it (after work hours in the evening). This defies the premise that electrical supply and demand must be equal at any given moment.
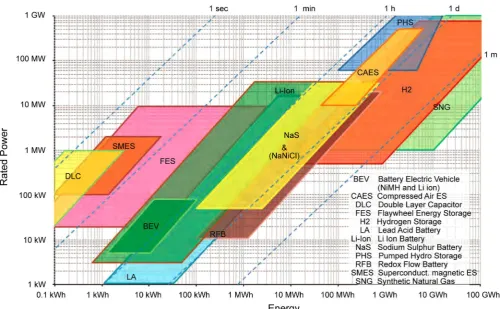
Thus, what is required to make these renewables truly effective is energy storage. Energy storage helps balances the act of supply and demand by storing excess energy and distributing that energy when needed, creating a more flexible and reliable grid system. Deploying energy storage will also reduce and potentially eliminate the need to generate or buy power during high (peak) demand times. Conventional energy storage methods utilized by utilities include pumped hydroelectric (largest storage system op-erating today in the US), thermal storage, compressed air and hydrogen [11]. However the most promising energy storage option may be the use of battery cells, where elec-tricity is converted to chemical potential for storage and generated when needed. Ad-vanced batteries are a major focus of research into improving the efficiency of battery cells, with various technologies being examined as reflected in Figure 4[12].
Figure 4. Characteristics of electrical energy storage technologies compared by energy, rated power & discharge time.
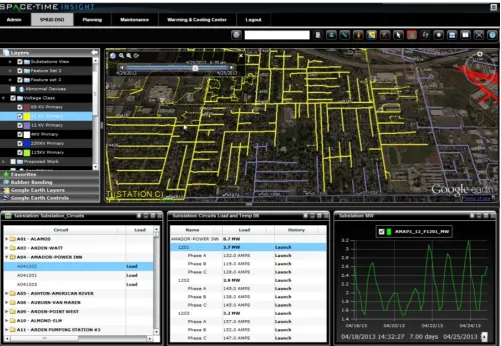
Predictive analytics are also an important part of the conversation especially with the variable nature of renewable energy such as solar and wind. These are remote monitor-ing solutions that track the performance of renewable energy productions. Predictive analytics provide a forecast of the amount of energy produced that can be directly supplied to the power grid or stored with energy storage. Predictive analytics software translates data into information which utilities can then possess to make better deci-sions. With predictive analytics (better yet complemented with energy storage), the utility’s operational efficiency and renewable energy assets life span improves. Various predictive analytics models are developed by various vendors, from the large players of IBM, Accenture to Locus Energy, and Space-Time Insight which is represented in Fig-ure 6[15].
Overall, the economics of solar and wind technologies are trending in the upward direction—the costs of the technologies are decreasing and the yields are getting higher. Better still, predictive modeling, energy storage and the plethora of research in this area will only make the prospects of integrating renewables more viable.
N. Griffin, A. G. Silaban
Figure 6. Screen sample of a predictive analytics software (Space-Time insight software, used for a utility’s grid planning and operations).
Many of the US states are looking towards a similar 20% renewable by 2020, and 25% by 2025. California Policies tend to surmount those for the rest of the US. Recently, Governor Brown of California signed a standard into law to mandate 50% renewables by 2030, which is expected to rely heavily on solar [16]. Hawaii may have its sights set higher than California even, as the first state to set a goal of producing 100% of its elec-tricity from renewable sources by 2045 [17].
3. Renewable Energy Program Comparisons
N. Griffin, A. G. Silaban
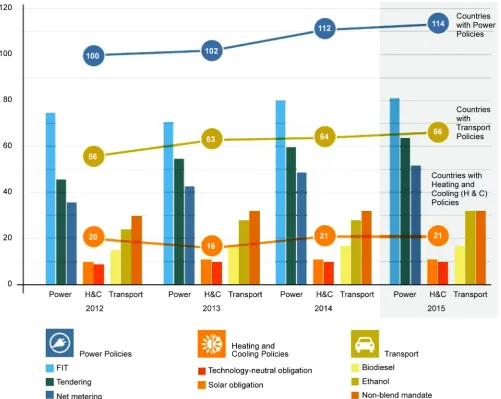
Figure 7. World’s renewable energy policies overview (2012-2015).
What all of this means is that all customers throughout the utility’s territory will be getting clean power—no residential or commercial solar or wind generation required. What’s more is the utility rates for customers are expected to stay low; residential cus-tomers currently paying $20/month customer charge plus $0.0939/kWh. Georgetown utility is continuing to receive customer requests regarding rooftop solar. The decision on whether or not the utility will recognize residential or commercial wind or solar af-ter they’ve achieved a 100% renewable status in 2017 is yet to be deaf-termined. Largely, customer education is expected to be a major factor in navigating through the customer owned renewable conversation.
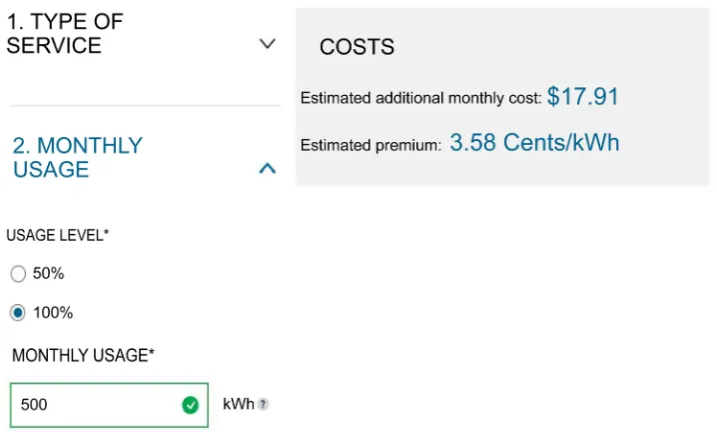
Majority of utilities are not in a position to take renewables completely in house as Georgetown has. Another model is to offer customers the choice of generating their own renewable power or giving them the option of purchasing renewable power from their utility company. Pacific Gas & Electric (PG & E) for example, offers a “solar choice” for its customers in which they can opt to have 50% or 100% of their monthly power matched with solar power provided by the utility. Instead of purchasing and in-stall rooftop solar, customers can pay a premium for the service through their utility provider. PG & E offers a rate calculator to assist customers in understanding the costs. For example, Figure 8 demonstrates that a customer can expect an additional cost of almost $18 a month if they opt for 100% solar choice participation at 500 kWh monthly [19]. The estimated premium is approximately $3.58 cents/kWh regardless if usage is 50% or 100%.
[image:9.595.194.553.459.675.2]Like PG & E, SMUD offer its customers both the option to self-install or participate in a community solar program. SMUD’s SolarShares program is setup so that custom-ers pay a flat monthly fee to subscribe. On the SMUD website, they describe the struc-ture further as such: the fee is based on your historical energy use and the share size you
N. Griffin, A. G. Silaban
select. You will then receive energy credits to your bill for the amount of solar power your SolarShare generates. Both the flat monthly fee and the energy credits from the solar power will be combined on your SMUD bill [20].
Now, let’s take a look at various examples of how the customer-owned renewable programs are managed. In January 2016, the California Public Utilities Commission (CPUC) voted to enact a policy that would ensure net-metered customers earn tail-rate payments for their surplus solar energy. The decision also comes with re-quirement for solar customers to move to time of use (TOU) rates “that charge differ-ent prices during differdiffer-ent times of the day, to better match real-time costs of generat-ing and transmittgenerat-ing energy across the grid at large [21].”
Unlike California, many Texas utilities have not adopted net-metering policies for their end-users, nor are they required to do so. However, there are some utilities such as Texas Gas Service who offers solar water heating rebates. Other Texas utilities in-cluding Oncor, Austin Energy, CPS Energy, El Paso, AEP TCC and AEP TNC have so-lar incentive options, but vary from one to the other [22]. Farmers Electric Cooperative in Iowa will pay its customers a fixed retail rate of 12.5 cents per kWh up to 100% of the accounts consumption. Above and beyond that, they are compensated 6 cents per kWh [23].
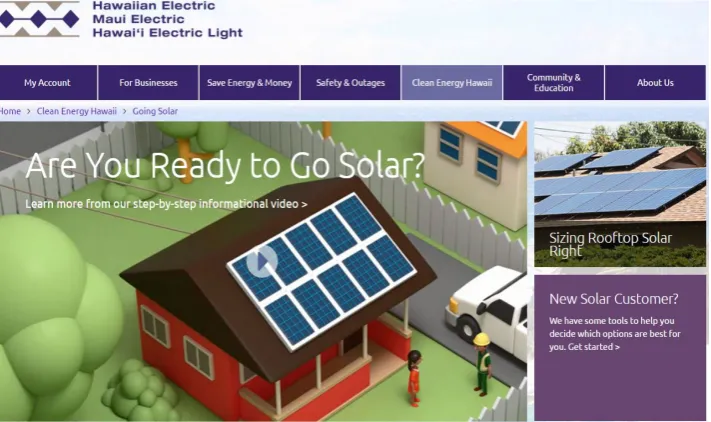
Figure 9. Hawaiian Electric’s Webpage, encouraging customers to implement solar panels.
The utility energy transformation is here, and renewables are undoubtedly a major component. In order to make these projects successful, there are many factors that util-ities need to consider. These include policy drivers, assessing what renewable technolo-gies it will employ, understanding how these will be integrated into the grid, identifying the rates and pricing incentives that could be made available, and how customers can be better engaged. With all factors considered, the utility will be equipped to build out a thoughtful renewable roadmap.
References
[1] American Wind Energy Association. Wind Energy Facts at a Glance.
http://www.awea.org/Resources/Content.aspx?ItemNumber=5059
[2] Union of Concerned Scientists. Farming the Wind: Wind Power and Agriculture.
http://www.ucsusa.org/clean_energy/smart-energy-solutions/increase-renewables/farming-the-wind-wind-power.html#.WCQv7fkrI2w
[3] American Wind Energy Association. Wind Energy Facts at a Glance.
http://www.awea.org/Resources/Content.aspx?ItemNumber=5059
[4] Weiner, J. (2015) Study Finds That the Price of Wind Energy in the United States Is at an All-Time Low, Averaging under 2.5₵/kWh.
http://newscenter.lbl.gov/2015/08/10/study-finds-that-the-price-of-wind-energy-in-the-uni ted-states-is-at-an-all-time-low-averaging-under-2-5%C2%A2kwh/
[5] Ren21. (2016) Renewables 2016 Global Status Report.
http://www.ren21.net/wp-content/uploads/2016/10/REN21_GSR2016_FullReport_en_11.pdf
[6] Darby, M. (2016).
https://www.theguardian.com/environment/2016/jan/26/solar-panel-costs-predicted-to-fall -10-a-year
[7] US Department of Energy. Tackling the Hidden Costs of Rooftop Solar.
http://energy.gov/science-innovation/energy-sources/renewable-energy/solar
N. Griffin, A. G. Silaban
http://energy.gov/articles/solar-energy-jobs-outpace-us-economy
[9] Solar Energy Industries Association (2016) Solar Market Insight Report 2016 Q2.
http://www.seia.org/research-resources/solar-market-insight-report-2016-q2
[10] Solar Energy Industries Association (2015) Impacts of Solar Investment Tax Credit Extension.
http://www.seia.org/research-resources/impacts-solar-investment-tax-credit-extension
[11] Union of Concerned Scientists. How Energy Storage Works.
http://www.ucsusa.org/clean-energy/how-energy-storage-works#.V73ECEtTHIV
[12] Electrical Energy Storage Project Team, International Electrotechnical Commission. Elec-tric Energy Storage. http://www.iec.ch/whitepaper/pdf/iecWP-energystorage-LR-en.pdf [13] Tesla. Powerwall. https://www.tesla.com/powerwall
[14] Kawashima, M. (2011) Overview of Electrical Power Storage. Internal Paper of Tepco. [15] Puttre, M. (2015) Analytics and Big Data Are Changing the Energy Market Map.
http://solarindustrymag.com/online/issues/SI1501/FEAT_03_Analytics-And-Big-Data-Are-Changing-The-Energy-Market-Map.html
[16] Roselund, C. (2015) California Governor Brown Signs 50% Renewable Portfolio Standard into Law.
http://www.pv-magazine.com/news/details/beitrag/california-governor-brown-signs-50-ren
ewable-portfolio-standard-into-law_100021447/#ixzz4He6NKmAP
[17] US Energy Information Administration. Hawaii State Profile and Energy Estimates.
http://www.eia.gov/state/?sid=HI
[18] Georgetown Going 100% Renewable. https://gus.georgetown.org/renewable-energy [19] PG&E’s Solar Choice Rate Calculator.
https://www.pge.com/en_US/residential/solar-and-vehicles/options/solar/solar-choice/rate-calculator.page
[20] SolarShares®: Solar for Everyone!
https://www.smud.org/en/residential/environment/solarshares.htm
[21] John, J. (2016) Breaking: California’s NEM 2.0 Decision Keeps Retail Rate for Rooftop So-lar, Adds Time of Use.
http://www.greentechmedia.com/articles/read/Californias-Net-Metering-2.0-Decision-Roof
top-Solar-to-Keep-Retail-Payme
[22] Blum, J. (2016) Texas Gets “F” Grade on Net-Metering Policies for Solar Power and More.
http://fuelfix.com/blog/2016/01/26/texas-gets-f-grade-on-net-metering-policies-for-solar-p
ower-and-more/
[23] Solar Outreach Partnership. Farmer Electric Cooperative: A Small Rural Cooperative Be-comes a Solar Leader.
http://www.solarelectricpower.org/media/230417/SEPA031-SolarOPs-Study_FEC_0914.pdf
[24] New Jersey’s Clean Energy Programs.
http://www.njcleanenergy.com/renewable-energy/programs/programs
[25] New Jersey Renewable Electric Storage.
http://www.njcleanenergy.com/renewable-energy/programs/energy-storage
[26] Coulter, S. (2012). Report Finds Shorter Payback Periods on Home Solar in Ten US States
http://www.prweb.com/releases/2012/3/prweb9282391.htm
[27] Hawaiian Electric Company. Clean Energy Hawaii: Going Solar.
Submit or recommend next manuscript to SCIRP and we will provide best service for you:
Accepting pre-submission inquiries through Email, Facebook, LinkedIn, Twitter, etc. A wide selection of journals (inclusive of 9 subjects, more than 200 journals)
Providing 24-hour high-quality service User-friendly online submission system Fair and swift peer-review system
Efficient typesetting and proofreading procedure
Display of the result of downloads and visits, as well as the number of cited articles Maximum dissemination of your research work
Submit your manuscript at: http://papersubmission.scirp.org/
![Figure 2. New investments in renewable energy, Developed & developing countries (2015) [5]](https://thumb-us.123doks.com/thumbv2/123dok_us/7795618.728038/3.595.196.552.487.689/figure-new-investments-renewable-energy-developed-developing-countries.webp)
![Figure 3. Installed photovoltaic & projected photovoltaic installation in the US [9].](https://thumb-us.123doks.com/thumbv2/123dok_us/7795618.728038/4.595.196.551.71.314/figure-installed-photovoltaic-projected-photovoltaic-installation.webp)
![Figure 5. Presentation of electrical energy storage role in maximizing renewable energy [14]](https://thumb-us.123doks.com/thumbv2/123dok_us/7795618.728038/6.595.157.549.67.692/figure-presentation-electrical-energy-storage-maximizing-renewable-energy.webp)